
Abstract
BACKGROUND AND PURPOSE: To our knowledge, very few MR imaging data have been reported in isolated cortical venous thrombosis (ICoVT). The purpose of this study was to describe MR imaging features, including T2*gradient-echo (GE) sequence, in presumed ICoVT.
MATERIALS AND METHODS: MR imaging examinations were performed in 8 patients with ICoVT (MR venography was performed in all patients and digital substraction angiography in 4) at the time of diagnosis and during the follow-up at 15 days (4 patients) and at 3 (8 patients), 6 (6 patients), 12 (3 patients), and 18 months (1 patient). We assessed the presence of a magnetic susceptibility effect (MSE) on T2*GE imaging at each site of cerebral venous thrombosis and the presence or absence of a normal flow void and iso-, hypo-, or hyperintense signal intensity on T1, T2, diffusion-weighted imaging (DWI), and fluid-attenuated inversion recovery (FLAIR) images. Parenchymal signal-intensity changes were also assessed on the same sequences.
RESULTS: MSE was detected on T2*GE imaging at the site of a cortical vein in all subjects at the first MR imaging examination. The occluded vein appeared as hyperintense in 3 patients, iso- to slightly hyperintense in 1 on T1, hypointense in 6 on FLAIR images, and as signal-intensity loss on DWI in 3. At follow-up, persisting signal-intensity abnormalities on T2*GE imaging were detected at the venous sites in all patients, whereas signal-intensity changes on T1- and T2-weighted images were no longer present. Parenchymal hyperintensities on FLAIR and DWI (increased apparent diffusion coefficient [ADC]) were observed in close vicinity to the thrombosis in 6/8 patients. Petechial hemorrhages (n = 3) or hematoma (n = 2) was present on T2*GE imaging in 5/8 patients. During the follow-up, all cerebral tissue signal-intensity changes on T1, T2, and FLAIR images decreased both in volume and intensity. ADC values normalized within the tissue after 3 months in all patients.
CONCLUSIONS: On T2*GE imaging, MSE of hemoglobin products within the thrombus was observed both at the early and late phases of ICoVT and appears to be of high diagnostic value compared with the other signal intensity changes detected on standard MR imaging.
Diagnosis of cerebral venous thrombosis (CVT) is difficult due to its wide spectrum of clinical presentation. The combination of MR imaging showing the thrombosed vessel and MR venography (MRV) demonstrating the nonvisualization of the same vessel is considered to be the best diagnostic tool in CVT.1–3 The signal intensity of venous thrombi on T1- and T2-weighted MR images varies according to the interval between the onset of thrombus formation and imaging. In the acute stage (0–5 days), the signal intensity is predominantly isointense on T1-weighted images and hypointense on T2-weighted images and is presumably related to the appearance of deoxyhemoglobin in red cells within the thrombus. In the subacute stage (6–15 days), the signal intensity is predominantly hyperintense on both T1- and T2-weighted images due to the accumulation of methemoglobin in the thrombus. Finally, the signal intensity in a chronic thrombus is typically isointense or hyperintense on T2-weighted and isointense on T1-weighted images. Recently, the use of a T2*-weighted gradient-echo (T2*GE) sequence very sensitive to all paramagnetic products of hemoglobin was also found particularly useful for early diagnosis of CVT.4–8
Isolated CVT (ICoVT) (ie, without sinus involvement) appears extremely rare and has been mainly reported as isolated case reports or in small series.9–18 ICoVT is particularly difficult to diagnose by using only T1-weighted, T2-weighted, and MRV imaging for different reasons: 1) Cortical veins are extremely variable in number, size, and location, 2) occluded small veins at the cortical level are difficult to identify by using these MR images, and 3) only the occlusion of the largest veins is detectable on MRV. Therefore, digital substraction angiography (DSA) is usually required for diagnostic confirmation in most cases of ICoVT to show indirect signs such as collateral venous pathways, tortuous veins, or delayed local venous drainage. We report the clinical and MR imaging results obtained by using standard MR imaging sequences combined with T2*GE and diffusion-weighted images (DWIs) at the time of diagnosis and during follow-up in 8 consecutive patients with ICoVT.
Materials and Methods
Patients
All patients with ICoVT seen in our institution from April 2002 through September 2006 were selected on the basis of the following criteria: 1) history and clinical manifestations compatible with or suggestive of CVT, 2) MR imaging features at first examination or during follow-up examinations suggestive of CVT in the absence of sinus thrombosis, and 3) clinical improvement and significant reduction of MR imaging signal-intensity abnormalities under anticoagulant treatment.
MR Imaging Data
All MR imaging was performed on a 1.5T system (Signa imager; GE Healthcare, Milwaukee, Wis) and included the following sequences: T1, T2, FLAIR, and DWI, including automated calculation of apparent diffusion coefficient (ADC) maps. T2*GE images were obtained in all subjects (TR, 560 ms; TE, 15 ms; 20 sections; sagittal and/or axial and coronal planes; section thickness, 5 mm; matrix size, 256 × 192; FOV, 24 × 24 cm) as well as 2D time-of-flight MRV. DSA was performed in 4 patients.
MR imaging examinations were performed at the time of diagnosis and during the follow-up at 15 days (4 patients), 3 months (all patients), 6 months (6 patients), 12 months (3 patients), and 18 months (1 patient).
All MR imaging data were reviewed by 2 readers (M.B. and I.C.). In all patients, the presence of a typical magnetic susceptibility effect (MSE) (ie, a strong and obvious hypointense signal intensity encompassing the vessel lumen on T2*GE imaging) was assessed at each site of CVT after consensus between the 2 readers.
At the parenchymal level, the presence of hyper-, iso-, or hypointense signal-intensity abnormalities was also assessed on each sequence, including DWI. In addition, ADC was measured within the largest hyperintense area as seen on DWI and outside hemorrhagic lesions, as well as within a symmetric contralateral normal-appearing area.
Results
Patients
Among 127 patients with CVT seen in our institution between April 2002 and October 2006, 8 (2 men, 6 women; mean age, 36 years; range, 23–57 years; median, 34 years) had ICoVT (6.3%). Their main clinical manifestations are presented in On-line Table 1. Clinical onset was acute (<48 hours) in 2 patients or subacute (>48 hours, <1 month) in 6 patients. At the time of diagnosis, all patients had headache, which was the only symptom in 1 patient. Other clinical manifestations included focal neurologic deficits in 7 patients and seizures in 4. All patients were treated with heparin immediately after diagnosis. If necessary, additional treatments were given according to the cause (steroids, antibiotics) or the symptoms (antiepileptic drugs). A transient worsening was observed in 4 patients (patients 2, 3, 7 and 8, see On-line Table 1). Despite this worsening, all patients improved, with a full clinical recovery in 6 and incomplete recovery in 2 (patients 7 and 8) at 1 year after diagnosis.
MR Imaging Results
MR imaging was performed 3–19 days after clinical onset (symptoms).
Cortical Veins: Acute Stage.
In all patients, a typical MSE was detected on T2*GE at the first MR imaging examination. MSE was recognized as a marked homogeneous well-delineated hyposignal, which was tubular, serpentine, or rounded or was seen as an extracerebral “bandlike” area on different planes (Figs 1A, -B; 2B; 3A; 4A; 5A). MSE was found in all planes when available (axial, sagittal, and/or coronal). On T1-weighted imaging, the occluded vein appeared as hyperintense in 3 patients, isointense to slightly hyperintense in 1 (Fig 2B), and hypointense in 1 patient. On T2-weighted images, the clot was either hypointense in 4/6 or isointense in 2/6 patients. On FLAIR images, it was hypointense in 6/8 patients (Fig 3C) and hyperintense in 1. The signal-intensity changes on FLAIR images were identified with the help of data on T2*GE imaging. On DWI, a signal-intensity loss at the site of MSE was detected in 3 patients and appeared as a “spot,” a “cord,” or a bandlike structure lying on the cortex surface (Fig 3D).

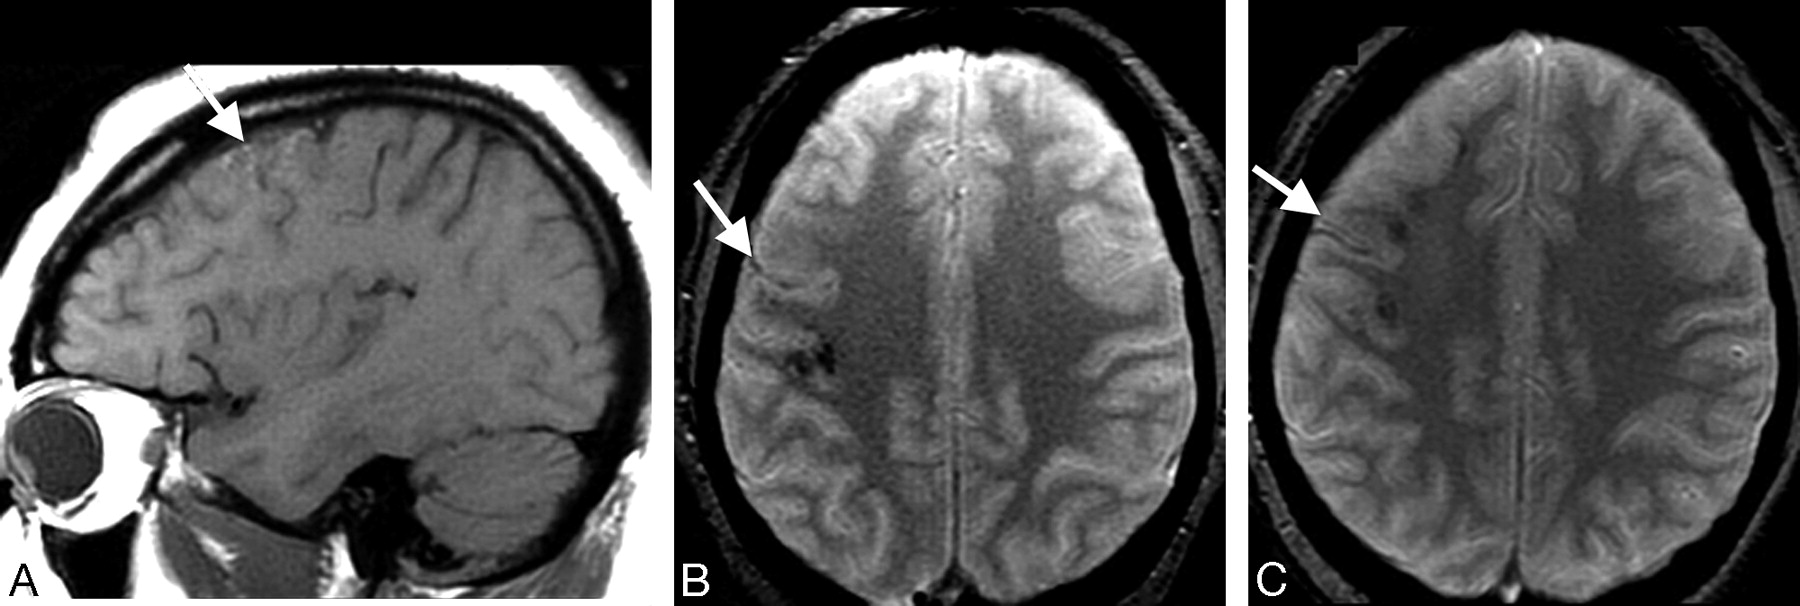
Patient 6. A and B, Initial MR imaging at day 7. On T2*GE images, linear hypointensity is seen in the right precentral sulcus, due to MSE at site of the thrombosed veins (small arrow) and hypointense areas corresponding to cortical hemorrhages (long arrows). C, On T1-weighted image, only swollen gyri (arrow) are identified.

Patient 6. A, Follow-up at month 3 reveals cortical hyperintensity on the T1-weighted image due to petechial hemorrhages. B, On the T2*GE image (same plane as in Fig 1A), note reduced but still visible MSE at the site of venous thrombosis (arrow), as well as petechial hemorrhages. C, At month 12, T1-weighted imaging findings are normal on T2*GE image (arrow); MSE is still identified.

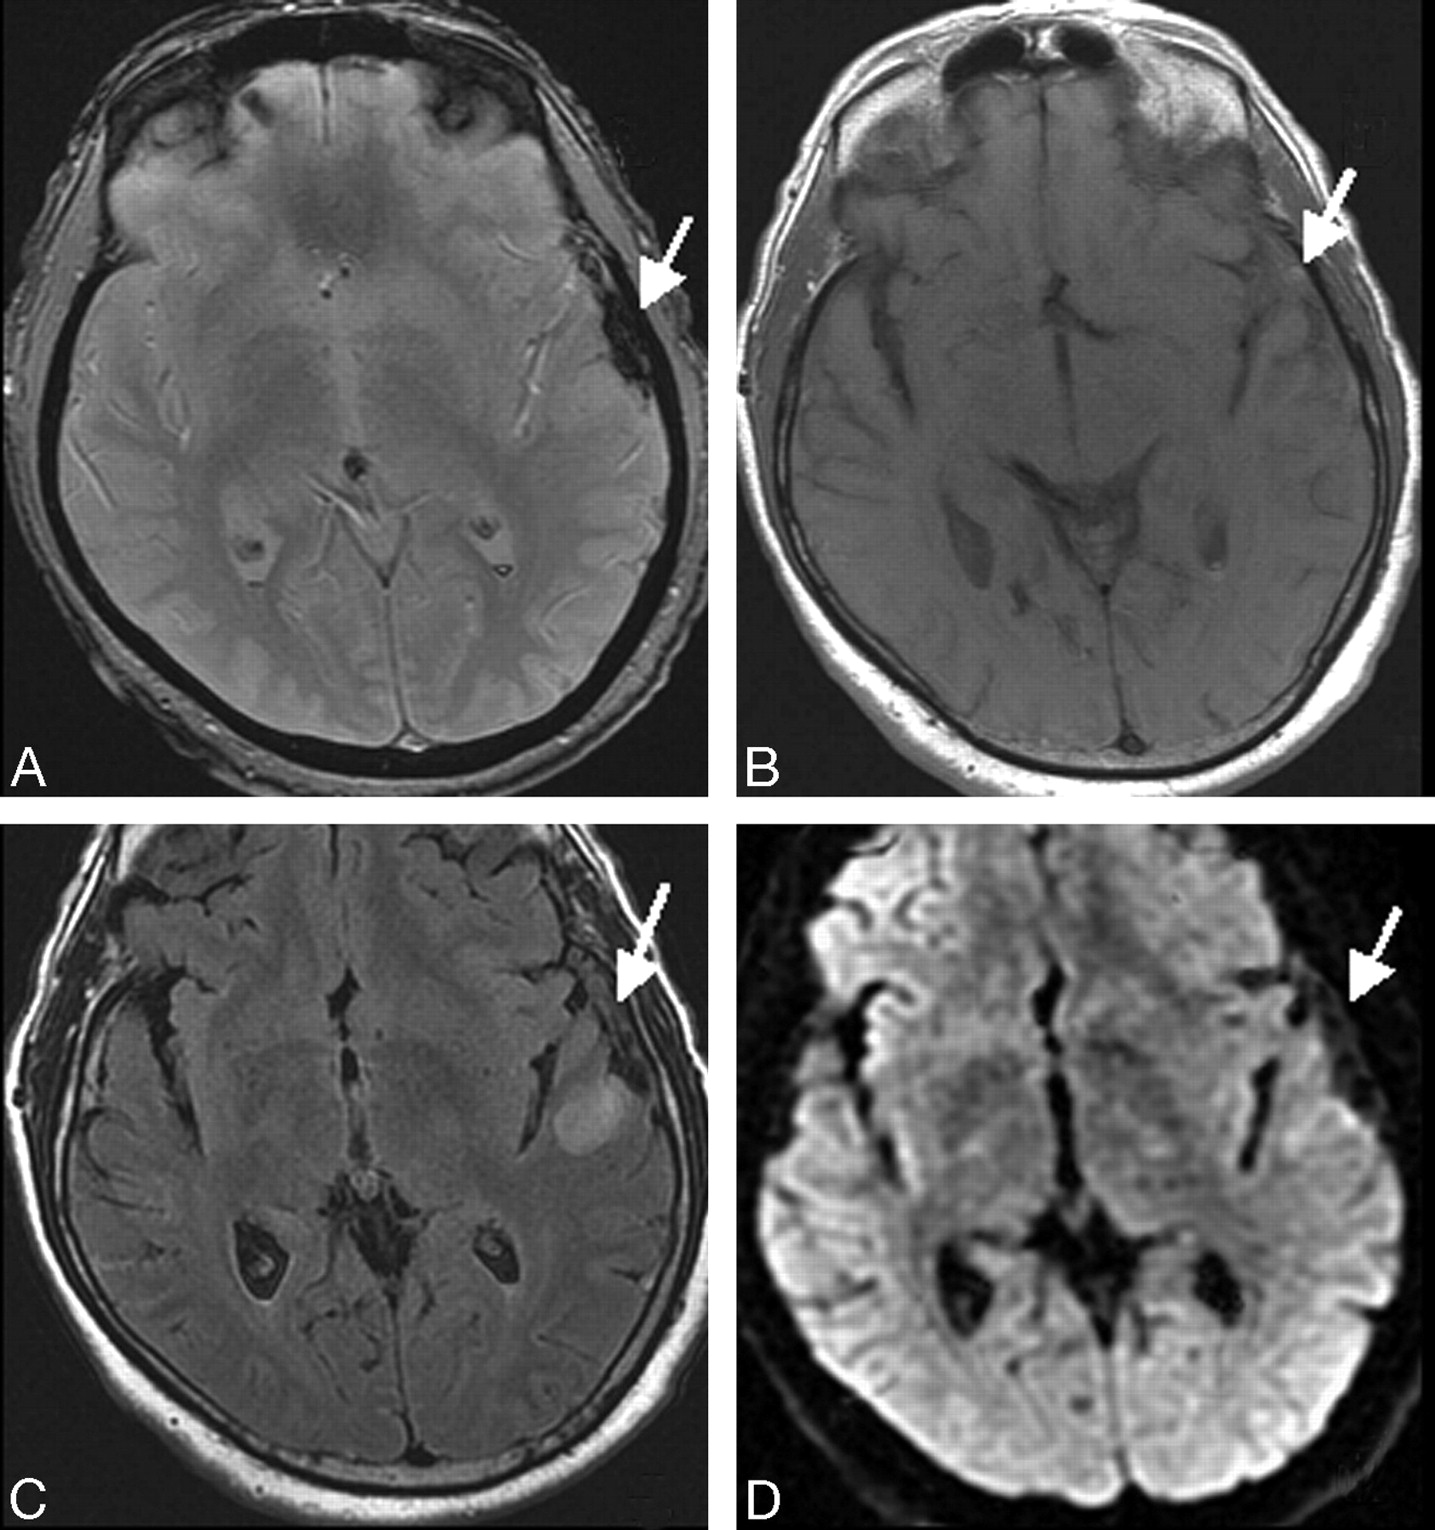
Patient 7. MR imaging at initial examination at day 5. An extra-axial band corresponding to the thrombosed vein of Labbé appears as a marked MSE on T2*GE image (A, arrow), isointense on T1 (B, arrow), hypointense on FLAIR sequence (C, arrow), and as a signal-intensity loss on DWI (D, arrow).

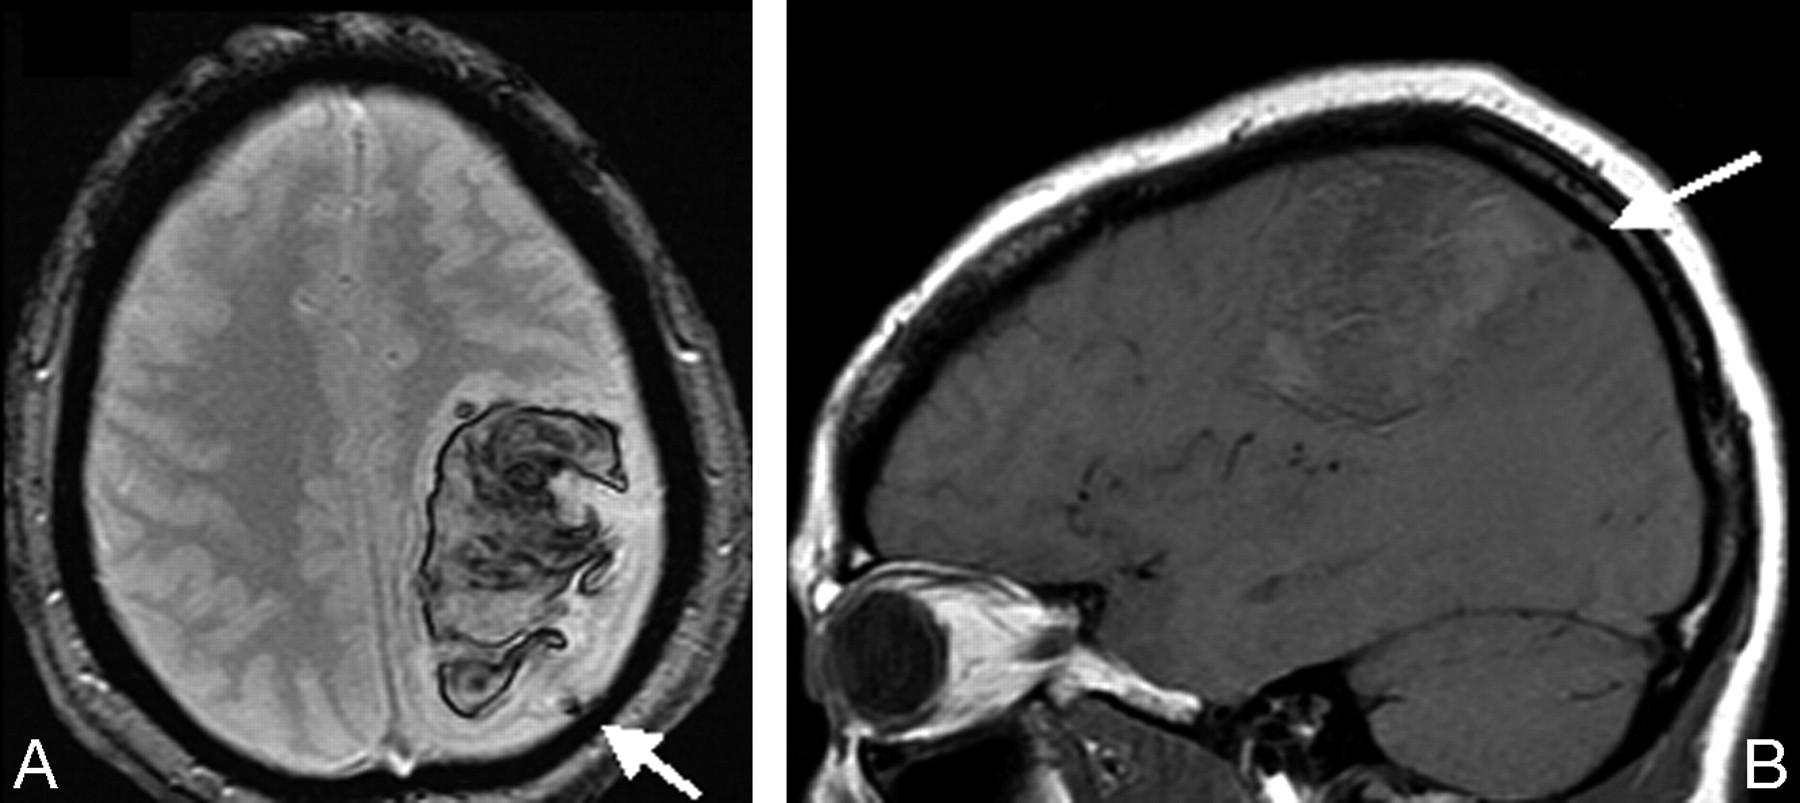
Patient 8. Initial MR imaging at day 3. T2*GE shows MSE in the thrombosed cortical vein (A, arrow) and the hematoma, appearing on the T1-weighted image as a mass of mixed signal intensity (B, arrow).

Patient 8. A, Follow-up at day 15. MSE is still identified in the thrombosed vein. B, A hyperintense spot is present in the lumen of a cortical vein on the T1-weighted image (arrow), appearing as a flow void on the initial T1-weighted image (Fig 4B, arrow). C−E, On coronal images in the same plane, the aspect of a cord sign is visualized at the surface of the cortex, hyperintense on T1- and T2-weighted images (arrow, C and D) and hypointense on the T2*GE image (E). The underlying hematoma is well identified on T1- and T2*GE images.
Cortical Veins: Chronic Stage.
Follow-up MR imaging showed that MSE remained detectable on the last examination (3–18 months), but its size was significantly reduced in 5/8 patients at 3 months (Fig 2B, -C) and markedly reduced in all patients with late MR imaging, at 1 year (3 patients) and at 18 months (1 patient). On the other MR imaging sequences, the signal-intensity changes corresponding to the occluded vein decreased after 3 months in all patients. On the last MR imaging examination (from 3 to 18 months depending on the patient), no signal-intensity abnormality was detected at the site of ICoVT on T1-weighted, T2-weighted, FLAIR, or DWI.
Cortical Veins: Venous System Involvement.
In 4 patients, ICoVT involved anastomotic veins, the Trolard vein in 2 patients (patients 3 and 8), and the vein of Labbé in 2 others (patients 5 and 7), with extension in 1 patient to the superficial Sylvian and frontal veins (patient 7). The central vein, precentral vein, a small frontal vein, and the midfrontal vein were involved respectively in patients 1, 2, 4, and 6.
After identification of the thrombus on T2*GE imaging, an occlusion of the Trolard vein and of the vein of Labbé was recognized on MRV, respectively, in patients 3 and 8. No other abnormality was detected on MRV, even after careful examination of all source images.
In addition to MR imaging examination, DSA was performed in patients 1, 5, 7, and 8. Indirect signs suggestive of ICoVT were present in all these patients (delayed local venous drainage in 3 patients; collateral venous pathways in 1 patient).
Brain Parenchymal Signal-Intensity Changes.
Parenchymal signal-intensity abnormalities were present in 7 patients at initial MR imaging. In all cases, tissue signal-intensity changes were detected close to the occluded vein with T2*GE imaging. Petechial hemorrhages were observed on T2*GE images in 3 patients (patients 3, 5, and 6) at the time of diagnosis and in 1 patient later after clinical worsening and in the absence of signal-intensity abnormality suggestive of hemorrhage on the other sequences (Fig 1A−C). In 2 patients (patients 7 and 8), an intracerebral hematoma was detected both on T2*GE and T1-weighted images (Fig 4A, -B).
Among the 6 patients who did not have any lobar hematoma, hyperintense parenchymal lesions were detected on DWI in 5. They were present outside the petechial hemorrhagic areas in 3. ADC was increased from 12% to 22% in hyperintense areas on DWI in the 5 patients with hyperintensities. In contrast, the parenchymal abnormalities observed with the other MR imaging sequences decreased both in volume and intensity. ADC values normalized after 3 months in all patients.
Discussion
In ICoVT, signal-intensity changes on T1- and T2-weighted images, identical to those observed in sinus thrombosis, have been previously detected in cortical veins. 10 However, because the number and location of these veins are highly variable, these changes are difficult to visualize. Hypointensity on T2*GE images of the thrombosed vein has been reported in only isolated cases.5,6,17,18 In 8 patients with ICoVT selected from a large series of CVT (6.3%), we found a typical MSE at the site of venous occlusion in all patients by using T2*GE imaging. The corresponding signal-intensity changes were easily recognized at the time of diagnosis in all subjects, no matter what time had elapsed since clinical onset. The shape of signal-intensity changes was very similar to that of the “cord” sign, a rare CT indicator of CVT only reported in 2 cases with MR imaging on T1-weighted images.13,19 Of note, MSE was detected in the 4 patients examined within 5 days after clinical onset when there was no hyperintense vessels on T1-weighted images. In addition, although a moderate-to-intense hyposignal of the thrombosed vein was also detected on FLAIR images in 6 patients within the first week after clinical onset (not previously detected), the detection of MSE was found helpful to discern these subtle vascular signal-intensity changes. Altogether, the present data underline the additional and crucial diagnostic value of T2*GE for the diagnosis of ICoVT, especially at the early phase.
The follow-up data showed that MSE was present, though significantly reduced, in all patients, regardless of the time elapsed since the clinical onset and, in 4 cases, even 1 year after the diagnosis and a complete recovery. This suggests that the sole presence of a venous MSE on T2*GE images cannot be used in isolation for diagnosis of active ICoVT and that the other sequences and/or follow-up data are still useful to estimate the thrombus age. The persisting signal-intensity changes of thrombosed veins on T2*GE images previously reported several months after onset in different types of CVT7 are presumably related to hemosiderin deposits within old clots or venous walls. On the other hand, these findings also suggest that the observation of isolated MSE may indicate, in specific circumstances, a past thrombotic event and may be useful in performing a post hoc diagnosis of ICoVT.
Parenchymal abnormalities were present in 7/8 patients at initial MR imaging. The lesions were characterized by the presence of cortical-subcortical hyperintensities on FLAIR and DWI associated with petechial hemorrhages observed only on T2*GE images in 5 patients or lobar hemorrhage in 2 patients. Both of our patients with lobar hemorrhages presented with a thrombosed vein of Labbé. The relatively benign clinical course, distribution of initial parenchymal involvement, and regression of lesions at follow-up MR imaging were close to features previously reported in the rare cases of ICoVT involving the vein of Labbé, despite initial clinical worsening and MR imaging signs of herniation.11–14 Therefore, our results emphasize that ICoVT should be considered as a potential cause of lobar hemorrhage, and they suggest that T2*GE is then crucial to reach the diagnosis and for therapeutic decisions. Finally, increased ADC in the cerebral tissue was consistent with the presence of vasogenic edema as also suggested by the complete recovery of hyperintense lesions on FLAIR images in the same area parallel to the clinical improvement as previously observed.20–22
In conclusion, this study further shows the great value of T2*GE for the early diagnosis of ICoVT, a rare presentation of CVT. In contrast to the transient signal-intensity changes on standard MR imaging, the cortical venous MSE observed on T2*GE images can persist several months and possibly years after the diagnosis and treatment of ICoVT.
Acknowledgments
We thank Philippe Burty for technical assistance.
Footnotes
indicates article with supplemental on-line table.
References
- Received June 9, 2008.
- Accepted after revision August 22, 2008.
- Copyright © American Society of Neuroradiology
In this issue


Jump to section
Related Articles
Cited By...
- A case of isolated cortical venous thrombosis presenting radiographically as a subacute multifocal leukoencephalopathy, and review of literature
- Isolated cortical venous thrombosis after fetal demise
- Current endovascular strategies for cerebral venous thrombosis: report of the SNIS Standards and Guidelines Committee
- Pearls & Oy-sters: Delayed progression of isolated cortical vein thrombosis despite therapeutic INR
- Early Detection and Quantification of Cerebral Venous Thrombosis by Magnetic Resonance Black-Blood Thrombus Imaging
- Teaching NeuroImages: Magnetic resonance susceptibility effect for acute isolated cortical vein thrombosis
- Isolated Cortical Vein Thrombosis: Systematic Review of Case Reports and Case Series
- Vein of Labbe thrombosis by CT and MRI
- Diagnosis and Management of Cerebral Venous Thrombosis: A Statement for Healthcare Professionals From the American Heart Association/American Stroke Association
- Isolated Acute Nontraumatic Cortical Subarachnoid Hemorrhage
- Cerebral Venous Thrombosis: Diagnostic Accuracy of Combined, Dynamic and Static, Contrast-Enhanced 4D MR Venography
- Reply:
- T2* Signal Hyperintensity in Subacute Cerebral Vein Thrombosis
- Diagnosis of cerebral cortical vein thrombosis with T2* weighted magnetic resonance imaging