
In their article, “Catheter Angiography, MR Angiography, and MR Perfusion in Posterior Reversible Encephalopathy Syndrome” (PRES), Drs Bartynski and Boardman1 describe their findings in hypertensive patients with PRES who were studied retrospectively with MR perfusion imaging. The authors have done a commendable job in displaying and analyzing their data and have provided interesting and thoughtful theories to support their findings.
A few words of caution are necessary, however, when interpreting perfusion data under these circumstances. The authors reported that perfusion MR imaging in PRES demonstrates reduced perfusion to the brain. However, it is important to recognize that PRES is a dynamic process, characterized by rapid and transient changes in brain hemodynamics. Bartynski and Boardman performed a retrospective analysis, and several of their patients were examined between 1 and 3 days after their hypertensive crisis. Observations made subsequent to the initiating event, especially after the patient has been treated, may not be reflective of the local processes occurring at the time when the edema was first produced, and this may result in spurious conclusions with regard to the etiology of PRES.
As an example, Figs 1 and 2 present 2 sets of data obtained in a patient with labile hypertension whom we studied with MR perfusion imaging; these data reflect the wide variation in intracranial perfusion that can occur with PRES in the setting of fluctuations in mean arterial blood pressures (MAP). A 41-year-old woman with a B-cell lymphoproliferative disorder, status post unrelated bone marrow transplant, was admitted with seizures and acute hypertension and was scanned within 24 hours after she received antihypertensive medication; her systemic blood pressure at the time of the first scanning was 150/90 mm Hg (MAP, 110.0 mm Hg).
While in the hospital, the patient developed renal failure and accelerated hypertension, accompanied by worsening seizures. She was scanned again within an hour of this episode, when her blood pressure was 230/130 mm Hg (MAP, 163.3 mm Hg).
We have found that brain perfusion in PRES often is markedly increased in the acute hypertensive setting, but after blood pressures are reduced, perfusion also tends to decrease; indeed, the presence of interstitial or intracellular edema would be expected to reduce local perfusion under any circumstance. Observations of perfusion data in PRES, therefore, must be placed in the appropriate temporal framework to avoid misinterpretation of the findings. A prospective study in which blood pressures are measured at the time of MR perfusion imaging would be necessary to address these issues.

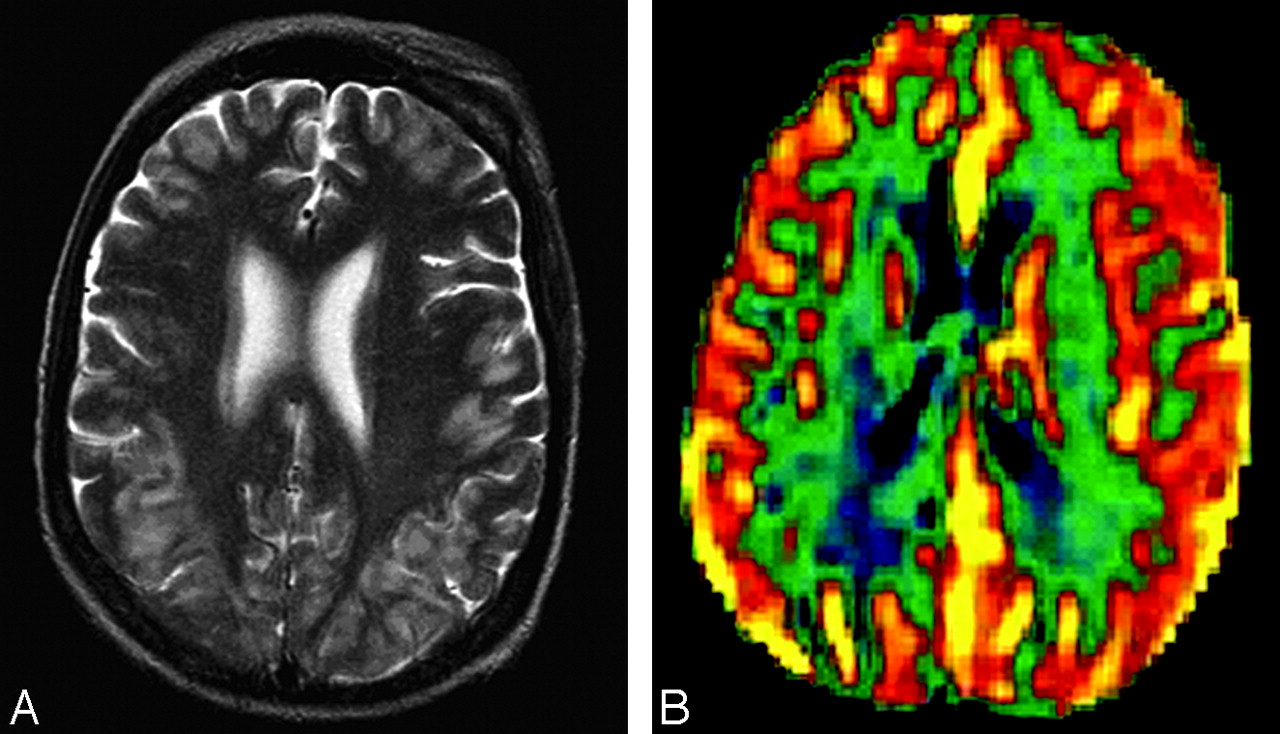
A, Axial T2-weighted image. Signal-intensity abnormalities are present in the subcortical white matter of the occipital lobes. B, Regional cerebral blood volume colorized map shows mild hyperperfusion at multiple cortical sites. Reprinted from Schwartz et al.2

A, Extensive hyperintense T2 signal intensity is noted in the subcortical white matter and cortex of the occipital and parietal lobes and, to a lesser degree, in the frontal lobes. B, Regional cerebral blood volume colorized map shows markedly increased perfusion throughout the brain, with maximal perfusion shown posteriorly. Reprinted from Schwartz et al.2
References
- Copyright © American Society of Neuroradiology


