
Abstract
BACKGROUND AND PURPOSE: It has been reported that iron concentration influences DTI metrics in deep gray matter nuclei. We hypothesized that increased FA in the deep gray nuclei may indicate abnormal iron accumulation in patients with PKAN and their siblings.
MATERIALS AND METHODS: Seven patients with the characteristic “eye-of-the-tiger sign,” their 5 siblings, and 5 age-matched controls were prospectively studied. One-way ANOVA with Bonferroni post hoc multiple comparisons was used to compare DTI metrics (FA and MD) among subject groups in the putamen, CN, GP, SN, and ALIC. In addition, hypointense and hyperintense regions of the eye-of-the-tiger sign were segmented, and their DTI metrics were compared. In the patient group, the values of DTI metrics in hypointense regions were also compared with those of the ALIC.
RESULTS: A significant increase in FA values of the GP and SN from controls to the patient group to siblings was observed. In the GP, MD values were significantly higher in patients compared with controls and siblings. The patients showed significantly increased FA with decreased MD in hypointense compared with hyperintense regions of the eye-of-the-tiger sign. No difference in FA values were observed between the ALIC and hypointense regions of the eye-of-the-tiger sign in patients.
CONCLUSIONS: High FA values in siblings of patients with PKAN suggest the presence of abnormal iron in deep gray matter nuclei, even in the absence of its demonstration on T2*-weighted GRE.
Abbreviations
- ALIC
- anterior limb of the internal capsule
- ANN
- artificial neural networks
- ANOVA
- analysis of variance
- CN
- caudate nucleus
- Diff.
- difference
- DTI
- diffusion tensor imaging
- FA
- fractional anisotropy
- FDRI
- field-dependent relaxation increase
- FSE
- fast spin-echo
- GP
- globus pallidus
- GRE
- gradient recalled-echo
- HBT
- hemorrhagic brain tumor
- LVQ
- learning vector quantization
- MD
- mean diffusivity
- NBIA
- neurodegeneration with brain iron accumulation
- PANK2
- pantothenate kinase 2
- PKAN
- pantothenate kinase−associated neurodegeneration
- SN
- substantia nigra
- SNR
- signal-to-noise ratio
PKAN with brain iron accumulation is a rare autosomal recessive neurodegenerative disorder that involves the pallidum and SN. It is typically an obstinately progressive disease of childhood and adolescence, in which motor symptoms predominate with rigidity, dystonia, and intellectual impairment with or without pyramidal tract signs.1,2
PKAN is placed in a group of neurodegenerative disorders known as NBIA.3–5 NBIA covers a spectrum of disorders including PKAN, aceruloplasminemia, neuroferritinopathy, hypoprebetalipoproteinemia acanthocytosis retinopathy, and pallidal degeneration. On the basis of the age of onset and disease progression, Hayflick et al6 classified PKAN in 2 clinical forms, early-onset (first decade of life) rapidly progressive disease (classic form) and late-onset (second or third decade of life) slowly progressive disease (atypical form). The PANK2 gene has been found to be mutated in all patients with the classic form and in one-third of patients with the atypical form.6
Pathologically, there is neuronal loss and gliosis affecting mainly the internal segment of the GP and SN. PKAN is associated with widely disseminated rounded or oval non-nuclear spheroids along with intracellular and extracellular iron deposition in the GP and SN.7,8
Conventional MR imaging shows bilateral high signal intensity surrounded by a region of low signal intensity on T2-weighted and T2*-weighted MR imaging in the medial GP. This signal intensity distribution is characteristically described as the “eye-of-the-tiger sign.”6,9 Hayflick et al6 have reported that all patients with the eye-of-the-tiger sign, whether classic or atypical, show PANK2 mutations.
DTI is a noninvasive MR imaging technique, which provides information about the microstructural organization of the brain by measuring the diffusion of water molecules in vivo.10 The 2 commonly used DTI metrics are FA and MD. These metrics have been widely used to study the microstructural white matter abnormalities in a number of neurologic disorders. Apart from normal white matter, high FA values have also been reported in the developing cerebral cortex,11,12 brain abscess cavities,13 and leptomeningeal-cortical regions of patients with meningitis.14
High FA has been reported in patients with gliomas with chronic hemorrhage, and a metalloanisotropic effect of intracellular iron has been suggested as the reason for this increase.15 Recently, high FA has also been reported in the deep gray matter nuclei with advancing age, and the physiologic increase in iron deposition has been implicated as the cause.16,17
In view of observed increased iron accumulation associated with high FA,15–17 we hypothesized that the increase in iron concentration in the basal ganglia of these children should result in increased anisotropy, because the disorder is known to have abnormal iron metabolism. The study aimed to compare DTI metrics in deep gray matter of patients with PKAN and their siblings with age-matched healthy controls and to see whether these changes indicate abnormal iron metabolism, especially in siblings of patients with PKAN.
Materials and Methods
Subjects
Seven patients with PKAN (mean age, 8.0 ± 3.2 years; 6 boys), 5 of their siblings (mean age, 6.0 ± 4.4 years; 2 boys), and 5 age-matched healthy controls (mean age, 8 ± 3.2 years; 3 boys) were prospectively studied, and medical records of the patients were checked for clinical evaluation. Institutional ethics and research committees approved the study. Parental informed consent was obtained for all subjects.
MR Imaging
Conventional MR imaging and DTI were performed on a 1.5T MR imaging scanner (LX EchoSpeed Plus; GE Healthcare, Milwaukee, Wisconsin) by using a quadrature birdcage head coil. MR imaging protocol included T2-weighted FSE images with TR/TE/NEX = 4900 ms/85 ms/2; T1-weighted spin-echo images with TR/TE/NEX = 625 ms/14 ms/2; and T2*-weighted GRE images with TR/TE/NEX/flip angle = 500 ms/15 ms/1/20°. A total of 36 axial sections were acquired with a section thickness of 3 mm, no intersection gap, and an FOV of 240 × 240 mm.
DTI data were acquired with a single-shot echo-planar dual spin-echo sequence with ramp sampling.18 The dual spin-echo sequence reduces image distortions in the diffusion-weighted images by compensating for the effect of eddy currents.19 A dodecahedral diffusion-encoding scheme with 10 uniformly distributed directions over the unit sphere was used for obtaining 10 diffusion-weighted images and 2 non-diffusion-weighted images. The imaging parameters were the following: TR/TE/NEX, 8 sec/100 ms/8, and a b factor of 1000 s/mm2. A total of 36 axial sections were acquired with a section thickness of 3 mm, no intersection gap, and an FOV of 240 × 240 mm. The acquisition matrix was 128× 80, and a homodyne algorithm was used to construct the k-space data to 128 × 128. This was zero-filled to reconstruct an image matrix of 256 × 256. To enhance the SNR, we temporally averaged magnitude-constructed images. The SNR0 in the reference (b ∼ 0) image was approximately 100, which helped to reduce the bias in the estimated DTI metrics.
DTI Data Processing and Analysis
The DTI data were processed by using JAVA-based software as described in detail elsewhere.20 Data quantification was performed by 2 independent observers blinded to each other and subject groups. Regions of interest were manually placed on a color-coded FA map overlaid on MD/T2 maps to calculate the DTI-derived metrics (FA, and MD) in the CN, putamen, GP, and SN in the 3 subject groups (Fig 1A, -B). To ensure the consistent pattern of FA values in gray matter nuclei in these patients, we also placed regions of interest on the ALIC and compared them with those in controls (Fig 1A). The size of regions of interest varied from 2 × 2 to 4 × 4 pixels. In each subject, regions of interest were placed on 5 sections for the CN, putamen, and GP and on 3 sections for the SN and ALIC, where the respective structure was best visualized.

A, Color-coded FA map overlaid on an MD map at the level of the basal ganglia shows placement of regions of interest at the CN (square), putamen (solid rectangle), GP (hollow rectangle), and ALIC (ellipse). B, Color-coded FA map overlaid on the MD map at the level of the SN shows region-of-interest placement on the SN. Note that the cutoff value for the color-coded FA map overlaid on the MD map for display is kept at 0. 20.
In addition to region-of-interest analysis, hypointense and hyperintense components of the eye-of-the-tiger sign visible on T2*-weighted GRE images in patients were automatically segmented to compare the value of FA in the hypointense and hyperintense regions, because hypointensity on T2-weighted and T2*-weighted images is known to correspond to abnormal iron accumulation. Segmentation was done by using in-house-developed JAVA-based software (Fig 2J). The segmentation methodology used a 2-layer LVQ-ANN classification network (Kohonen20), implemented in-house in a JAVA interface (Fig 2J). The steps of the LVQ clustering algorithm are as follows:
Step 1) Given unlabeled dataset X = {x1, x2,…, xn} ⊂ RP Fix c, T, and ε > 0]
Step 2) Initialize V = (v0,1,…….,vc,0) ∈ Rcp and learning rate α0 ∈ (1,0).
Step 3) For t = 1,2, ……,T
For k = 1,2, ……,n
A) Find ‖xk − vi,t−1‖ = min {‖xk − vj,t−1‖}. B) Update the winner; vi,t = vi,t−1 +αt (xk − vi,t−1).
Step 4) If ‖Vt −Vt−1‖ ≤ ε step, or else adjust the learning rate αt for the next t. (In our case, αt = [1 − t / T]), and T = 2000.)

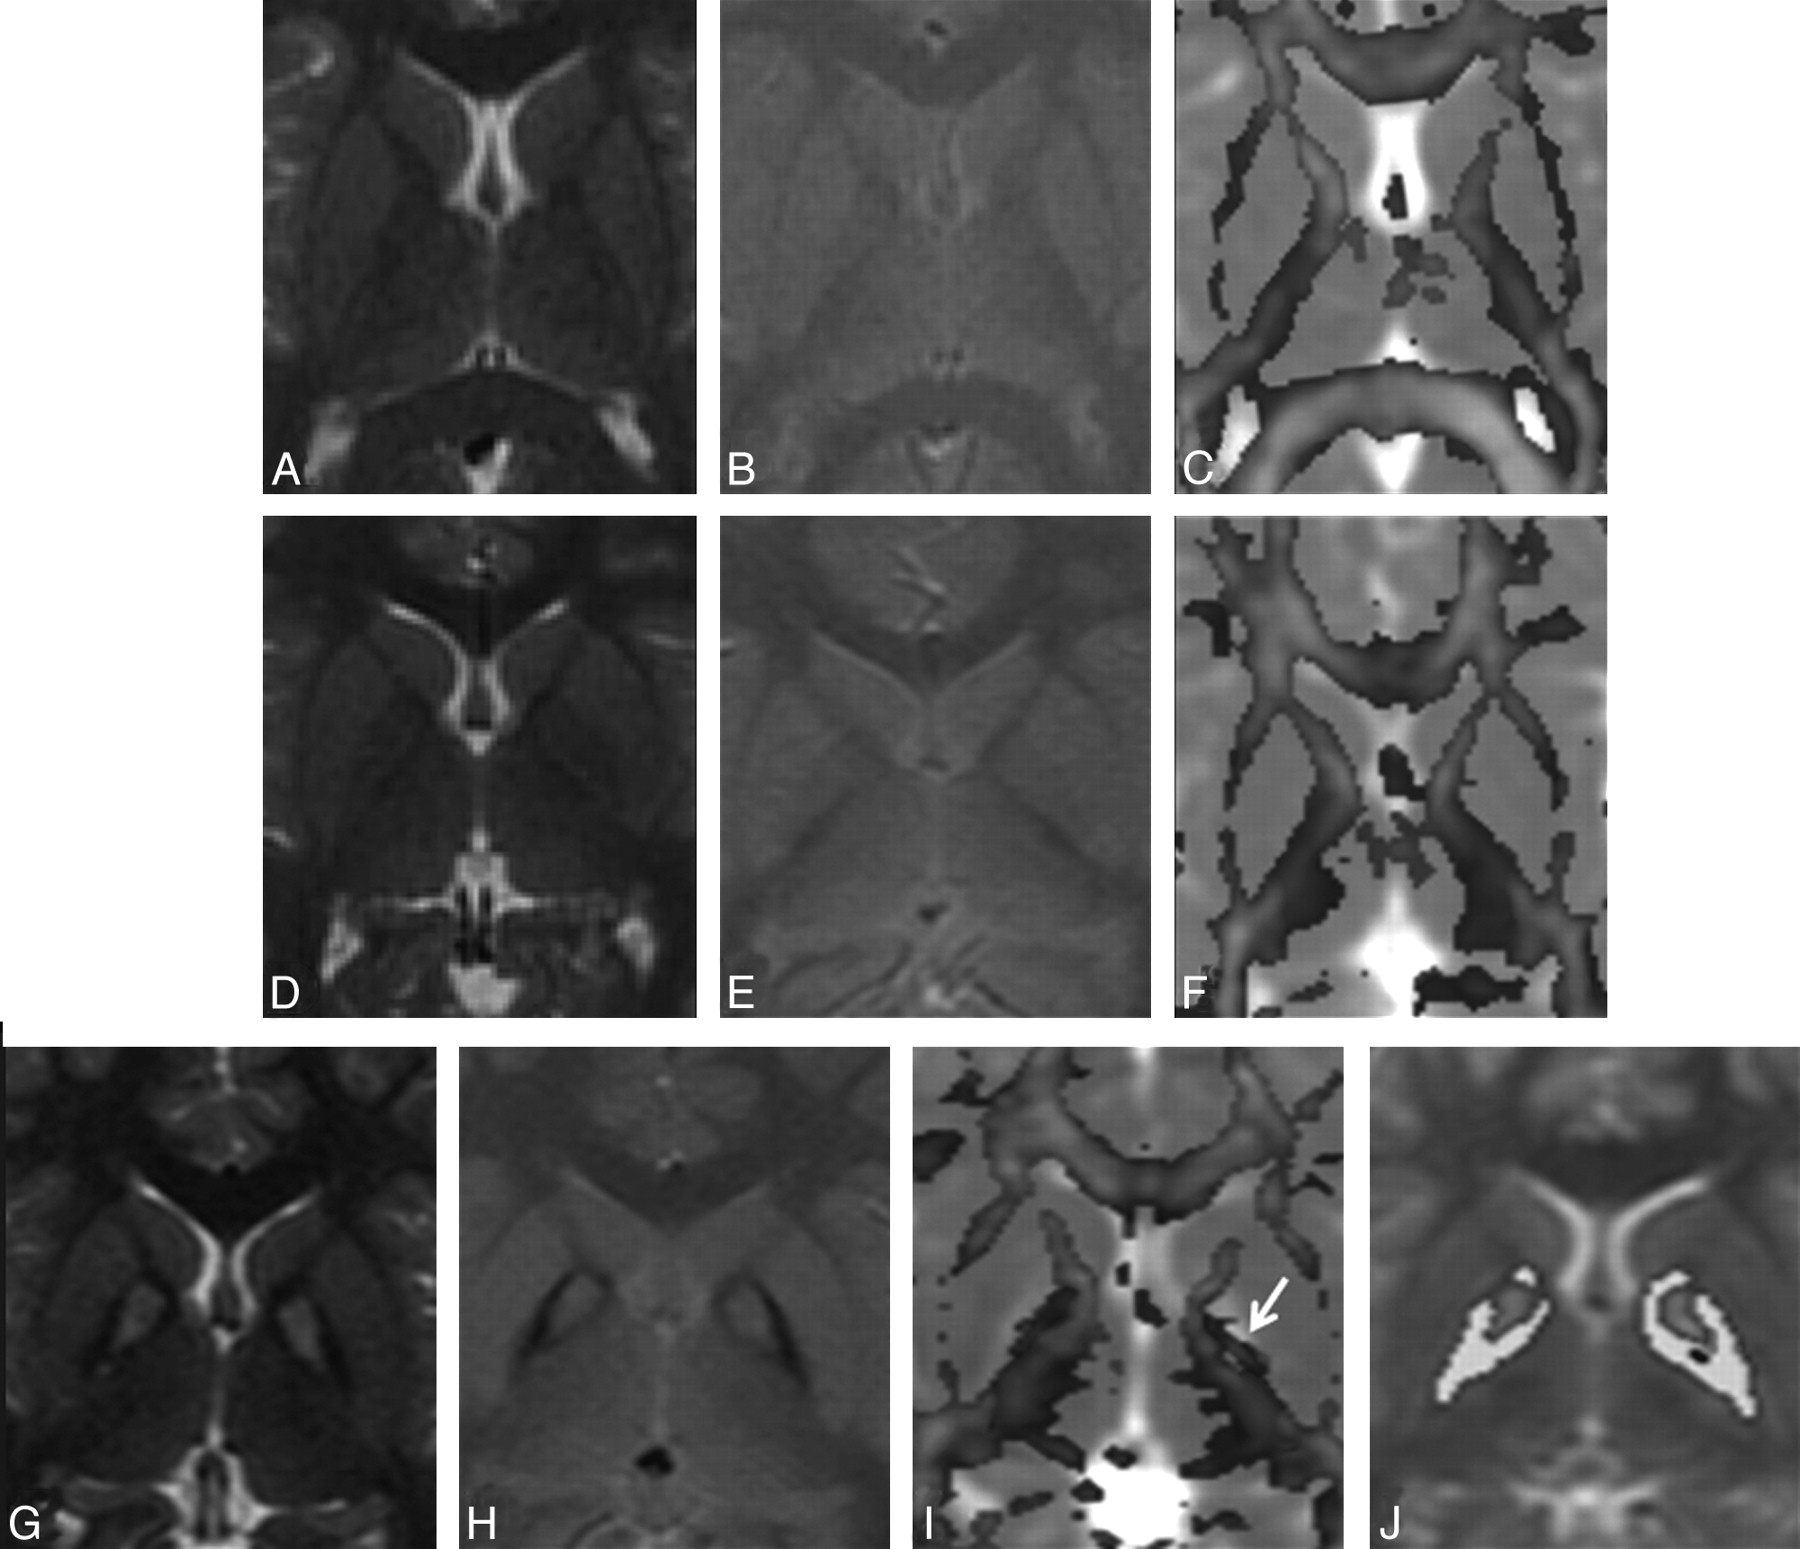
A–C, MR imaging of a 6-year-old male healthy control shows normal distribution of white and gray matter on the T2-weighted image (A), the T2*-weighted GRE image (B), and the color-coded FA map overlaid on the MD map (C). D–F, A 6-year-old male sibling of the patient with PKAN G–J. Findings of T2-weighted (D) and T2*-weighted GRE (E) images appear normal in the sibling; however, the quantified color-coded FA map overlaid on the MD map (F) shows intermediate FA values between patients and controls. G–I, In a 10-year-old male patient with PKAN, T2-weighted (G) and T2*-weighted GRE (H) images show the eye-of-the-tiger sign. The color-coded FA map overlaid on the MD map (I) shows high FA values (arrow) in the GP (0.20) compared with those in both the control (0.10) and his sibling (0.12). J, Segmented FA map of the patient overlaid on T2. The hypointense regions are shown in yellow.
For segmentation of the eye-of-the-tiger sign, a small rectangular region of interest covering both the left and right eye-of-the-tiger signs was drawn on the B0 image, and the LVQ algorithm was applied in the region of interest with only 6 initial reference vectors (prototype). Final image pixels that were closest to the first weight vector having the lowest intensity were classified as object pixels. DTI metrics were calculated for the object pixels.
Statistical Analysis
A Student paired t test was performed to evaluate the difference between the region-of-interest measurements in the right and left hemispheres in the healthy controls. Bivariate analysis of correlation was performed to rate inter-rater reliability between the 2 observers, with the assumption that there was no correlation between FA and MD values quantified by the 2 observers (null hypothesis = 0). Alternatively, if a correlation >0.00 was observed at α = 0.05% and 90% power of the test, the null hypothesis was rejected.
One-way ANOVA by using Bonferroni post hoc multiple comparisons was performed to compare the DTI metrics among the subject groups in the CN, putamen, GP, SN, and ALIC. The Student independent t test was performed to see the difference in DTI metrics between hypointense and hyperintense regions of the eye-of-the-tiger sign visible on T2- and T2*-weighted GRE images in the patient group. The Student independent t test was also performed to compare DTI metrics between the ALIC of the patient and the hypointense regions of the eye-of-the-tiger sign. A P value < .05 was considered statistically significant. All statistical computations were performed by using SPSS statistical software (Version 14.0; SPSS, Chicago, Illinois).
Results
Clinical Presentation
All 7 patients presented with extrapyramidal features, including dystonia, dysarthria, and rigidity; however, the degree of severity was dependent on the difference between the age of onset of symptoms and the clinical evaluation at the time of imaging. Four patients had a time gap of 14–18 months between the onset of disease and diagnosis on MR imaging, whereas in 3 patients, this time gap was 4–6 months. Two patients developed orofacial dystonia, resulting in difficulty in swallowing. None of the siblings of the patients was symptomatic, and they were imaged along with the patient. According to the parents, each of the siblings (both male) of 2 patients from different families died at 9 years and 12 years of age, respectively. Both had symptoms similar to those of patients with PKAN. The controls were examined and were found to have no clinical or neurologic abnormalities.
Qualitative Analysis
All patients diagnosed with PKAN showed the characteristic eye-of-the-tiger sign on T2-weighted images (ie, T2 signal-intensity hypointensity in the GP with a central region of T2 hyperintensity) (Fig 2). Besides the eye-of-the-tiger sign, no abnormality was evident in the brain parenchyma of patients. None of the siblings showed abnormal signal intensities including the eye-of-the-tiger sign on conventional MR imaging. Findings of all controls appeared normal on MR imaging.
Quantitative Analysis
The inter-rater reliability for the DTI-based approach was 0.93 (P < .001). In healthy controls, no significant difference in FA and MD values in the right hemisphere was observed compared with the left hemisphere, so the values of the right and left hemispheres in all 3 groups were pooled together, and average values were taken for statistical analysis. Mean values of FA and MD in the CN, GP, putamen, SN, and ALIC among the 3 groups are summarized in Table 1.
Summary of FA and MD (×10−3 mm2s−1) values quantified in patients with PKAN, their siblings, and age-matched healthy controls in deep gray matter nuclei and ALIC
Bonferroni post hoc multiple comparisons showed a significant difference in FA values among all subject groups in the GP and SN (Table 2 and Figs 2 and 3). In these regions, significantly higher FA values in the patient group were observed compared with both siblings and controls. Significantly increased FA values were observed in siblings compared with controls in the GP and SN. No significant change in FA values was observed among groups in the putamen, CN, and ALIC. Among different regions, a significantly higher MD value in patients was observed only in the GP compared with both controls and siblings. In the rest of the regions, no significant change in MD values was observed among the 3 groups.
Multiple comparisons, using the Bonferroni test for FA and MD valuesa of deep gray matter nuclei, among the subject groups

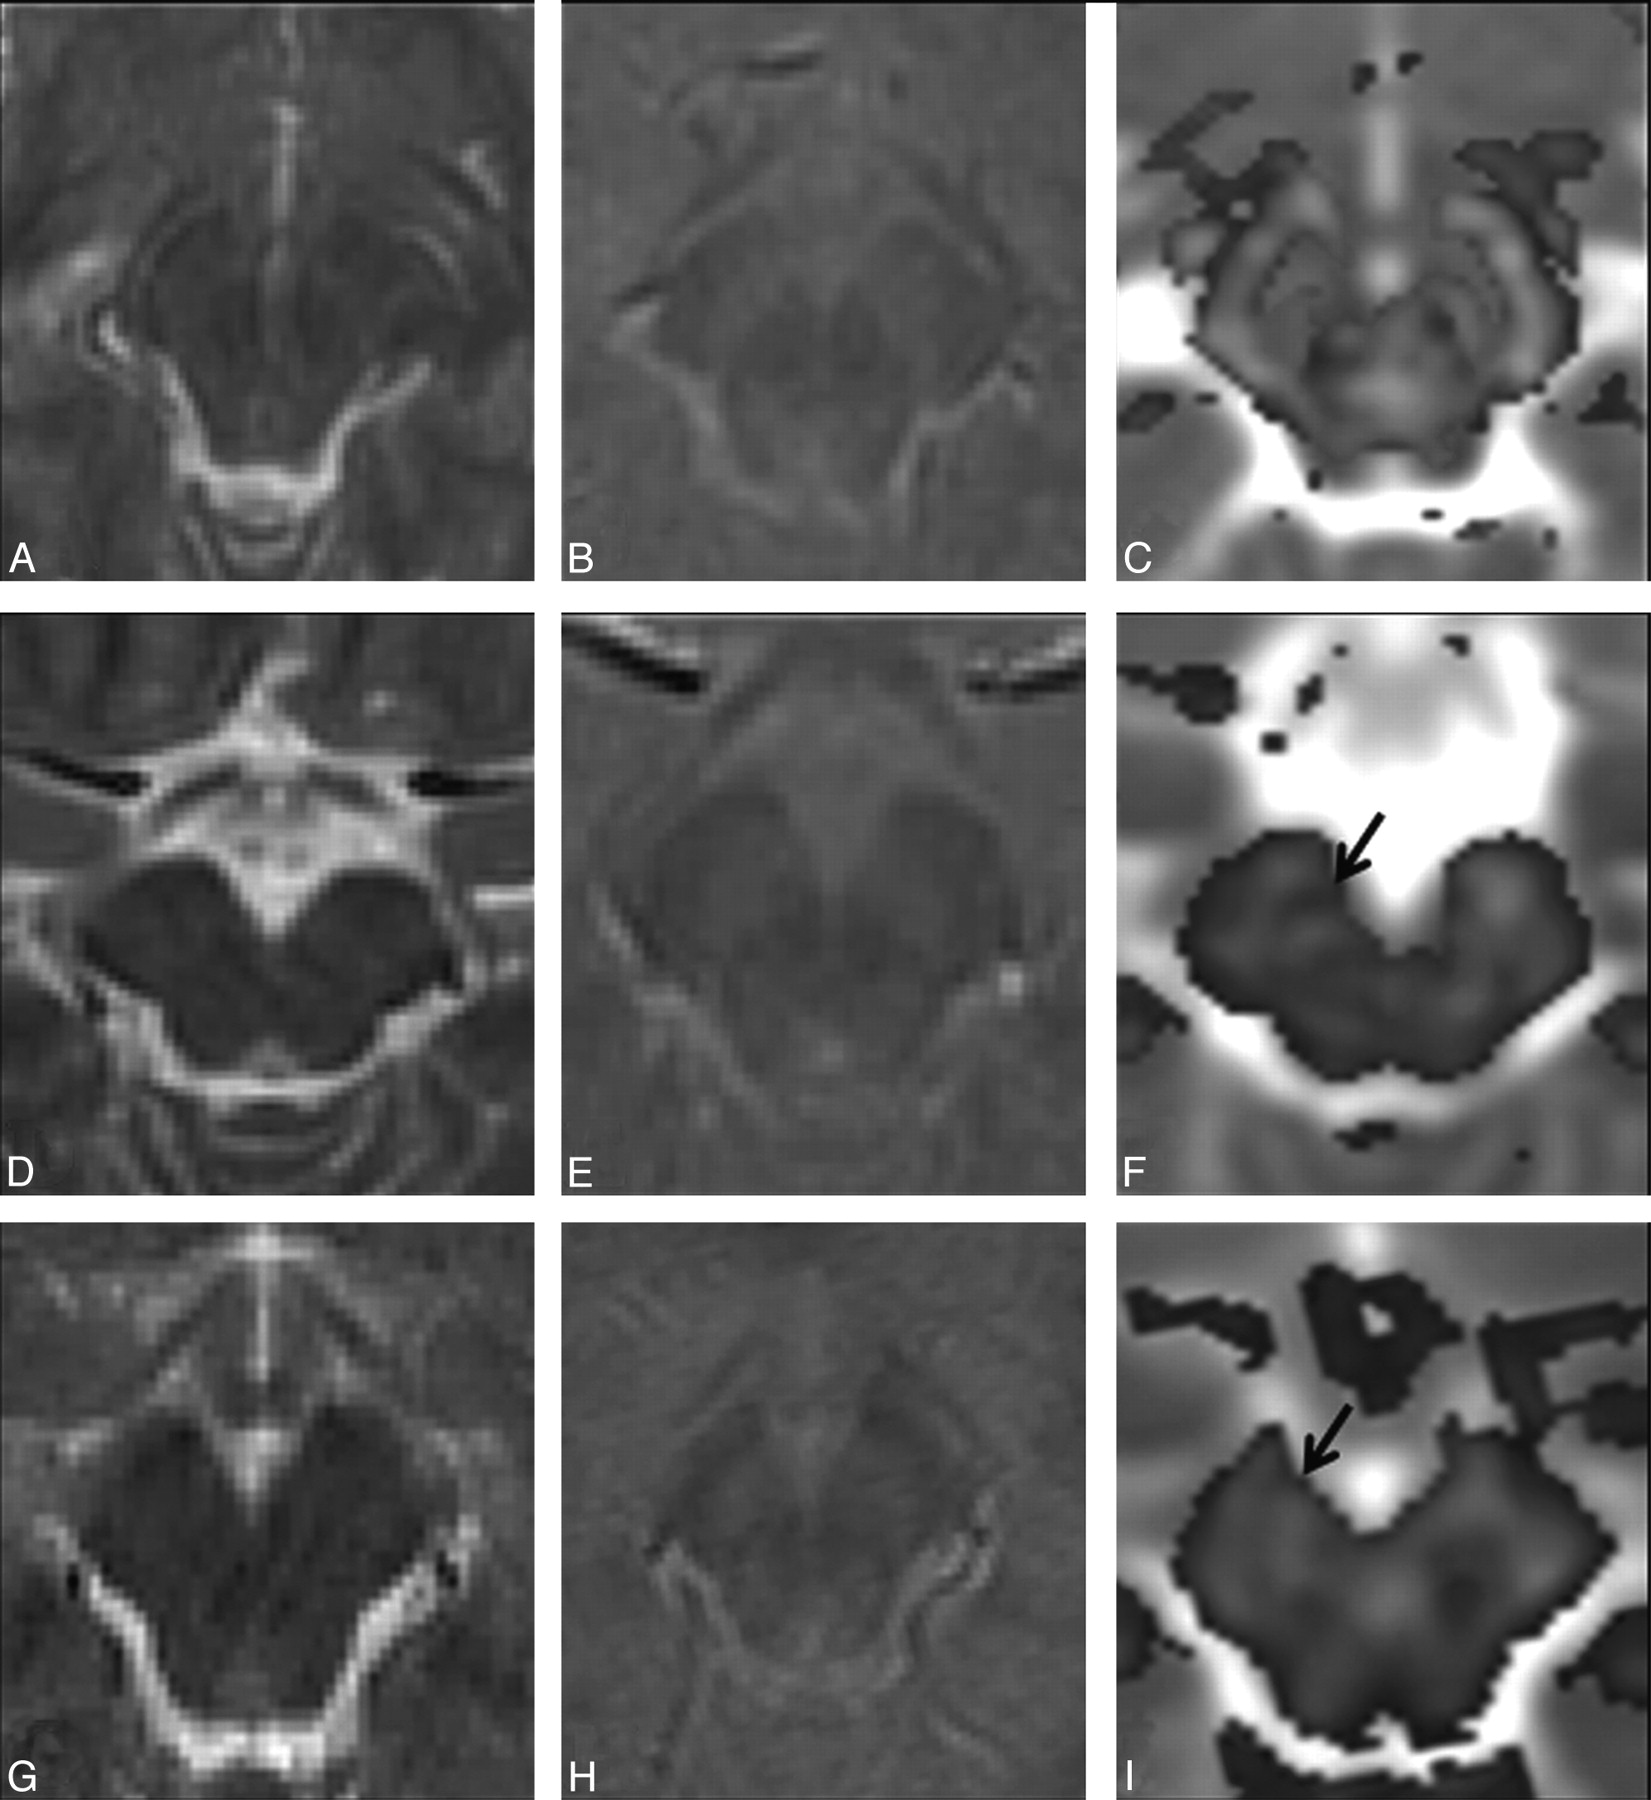
A–C, Imaging of a 6-year-old male healthy control shows normal distribution of white and gray matter on the T2-weighted image (A), the T2*-weighted GRE image (B), and the color-coded FA map (C) at the level of the SN. D–F, In a 6-year-old male sibling of the patient with PKAN shown in Fig G–I, findings on T2-weighted (D) and T2*-weighted GRE (E) images appear normal; however, the color-coded FA map overlaid on the MD map (F) shows higher FA values (0.22, arrow) than those in the control (0.18). G–I, In imaging of a 10-year-old male patient with PKAN, findings on T2-weighted (G) and T2*-weighted GRE (H) images are normal-appearing. The color-coded FA map overlaid on the MD map (I) from the patient shows high FA values (0.30) in the SN (arrow) compared with those in both the control and his sibling.
On the independent Student t test, significantly increased FA (P < .001) with decreased MD values (P < .001) in hypointense (FA = 0.33 ± 0.09, MD = 0.72 ± 0.05) regions was observed compared with hyperintense regions (FA = 0.18 ± 0.05, MD = 0.88 ± 0.06) of the eye-of-the-tiger sign in the patient group. In addition, hypointense regions of the eye-of-the-tiger sign did not show any significant difference in FA (P = .09) or MD (P = .14) from the ALIC (FA = 0.36 ± 0.01, MD = 0.71 ± 0.03) in these patients.
Discussion
The present study demonstrates an increase in FA values in the GP and SN from controls to patients to siblings, and the difference was found to be statistically significant. The MD values in the GP were significantly higher in patients compared with both controls and siblings. In addition, patients showed significantly increased FA along with decreased MD in hypointense regions compared with the hyperintense region of the eye-of-the-tiger sign. The FA values in hypointense regions were comparable with those in the ALIC.
Pathologic finding in PKAN include both extracellular and intracellular iron deposition, axonal swelling, and spheroids predominately in the GP and pars reticularis of the SN.7,8 Abnormal iron accumulation in deep gray matter nuclei has been reported in various neurodegenerative disorders, but the exact mechanism in PKAN and related neurodegenerative disorders is not clear.6 Both PKAN and neuroferritinopathy may show the eye-of-the-tiger sign on conventional MR imaging.21 In PKAN, deficiency of the pantothenate kinase enzyme occurs due to mutation in any of the 4 human pantothenate kinase genes. Its deficiency causes chelation of iron.22,23 Neuroferritinopathy is associated with mutation in the light chain of the ferritin gene. The mutation causes abnormal iron accumulation in basal ganglia.24
It has been reported that iron deposition influences DTI metrics16,17 by introducing local field gradients that have been shown to increase anisotropy.25 Pfefferbaum et al16 reported increased anisotropy in deep gray matter nuclei with age and correlated it with FDRI estimates. A near-perfect correlation between FDRI estimates and brain iron concentration measured postmortem has also been reported.16,26 It suggests that iron accumulation influences FA values in controls and patients with abnormal iron metabolism. In another DTI study on brain hemorrhage and HBT, increased FA has been reported even in glioma with a chronic stage of bleed. The authors explained it by demonstrating intracellular iron in the tumor cells on histology.15 Abnormal intracellular iron in deep gray matter regions predominantly in GP and SN, as described previously on pathology, may explain the reason for high FA in these regions in patients with PKAN and their siblings in the current study. The absence of significant changes in DTI metrics of the CN and putamen in patients and their siblings suggests the absence of abnormal iron accumulation in these regions.
T2*-weighted GRE imaging has been found to be valuable in detecting the presence of iron in different brain lesions27; however, the T2* effect is field- and pulse-sequence-dependent. An imaging study has shown that T2*-weighted GRE imaging at 3T is more sensitive than at 1.5T in the detection of hemorrhagic foci related to diffused axonal injury.28 These observations suggest that T2*-weighted GRE may have sensitivity constraints on a 1.5T unit. In the present study, though the FA values of the hyperintense region of the eye-of-the-tiger sign were lower than those of the hypointense region, these were still higher compared with FA values of the GP in the control group, suggesting that some nonheme iron is present in the gliotic region of these patients. In addition, significantly increased anisotropy in the GP and SN in siblings compared with controls suggests that there is probably an abnormal iron deposition in the siblings of these patients, which may be beyond the sensitivity of T2*-weighted GRE on the 1.5T MR imaging system.
MD is the average measure of the molecular diffusion, and it is affected by the cellular size and integrity.29 The increased MD value in normal-appearing white matter in various diffuse brain pathologies probably reflects gliosis30 and neuronal loss.18 The observed high MD values in the medial GP in patients compared with siblings and the control group may be explained pathologically by neuronal loss, gliosis, and spongiosis.6,7
Although manually placed region-of-interest analysis has been widely used in the DTI literature, it is not always reliable due to some intraobserver and interobserver variability. However in the current study, significantly strong positive correlation was observed between 2 independent observers who quantified FA and MD values, suggesting the reliability of the data used in this study.
The presence of the eye-of-the-tiger sign strongly suggests that all patients had a strong probability of a mutated PANK2 gene, though the eye-of-the-tiger sign has also been reported in other neurodegenerative disorders.21 Lack of a genetic testing facility for PKAN in our neighborhood limited us to making the differential diagnosis in these patients and to studying the possible presence of an associated mutation in their siblings. This may be considered the major limitation of this study. Due to the rarity of the disease, the number of patients studied was small and may be considered as another limitation of the study.
Conclusions
We conclude that FA appears to be an indicator of abnormal iron metabolism and its accumulation in deep gray matter, even in the absence of its demonstrable T2* effect on GRE. This may be of value in early diagnosis and management of pathologies associated with abnormal iron accumulation.
Footnotes
This study was supported by the Department of Biotechnology (grant BT/PR5009/MED/14/581/2004), New Delhi, India. Rishi Awasthi received financial assistance from the Indian Council of Medical Research, New Delhi, India
Indicates open access to non-subscribers at www.ajnr.org
References
- Received June 18, 2009.
- Accepted after revision July 24, 2009.
- Copyright © American Society of Neuroradiology
In this issue


Jump to section
Related Articles
Cited By...
- No citing articles found.