Advertisement

Main menu

  • Home
  • Content
    • Current Issue
    • Accepted Manuscripts
    • Article Preview
    • Past Issue Archive
    • Video Articles
    • AJNR Case Collection
    • Case of the Week Archive
    • Case of the Month Archive
    • Classic Case Archive
  • Special Collections
    • AJNR Awards
    • Low-Field MRI
    • Alzheimer Disease
    • ASNR Foundation Special Collection
    • Photon-Counting CT
    • View All
  • Multimedia
    • AJNR Podcasts
    • AJNR SCANtastic
    • Trainee Corner
    • MRI Safety Corner
    • Imaging Protocols
  • For Authors
    • Submit a Manuscript
    • Submit a Video Article
    • Submit an eLetter to the Editor/Response
    • Manuscript Submission Guidelines
    • Statistical Tips
    • Fast Publishing of Accepted Manuscripts
    • Graphical Abstract Preparation
    • Imaging Protocol Submission
    • Author Policies
  • About Us
    • About AJNR
    • Editorial Board
    • Editorial Board Alumni
  • More
    • Become a Reviewer/Academy of Reviewers
    • Subscribers
    • Permissions
    • Alerts
    • Feedback
    • Advertisers
    • ASNR Home

User menu

  • Alerts
  • Log in

Search

  • Advanced search
American Journal of Neuroradiology

American Journal of Neuroradiology

ASHNR American Society of Functional Neuroradiology ASHNR American Society of Pediatric Neuroradiology ASSR
  • Alerts
  • Log in

Advanced Search

  • Home
  • Content
    • Current Issue
    • Accepted Manuscripts
    • Article Preview
    • Past Issue Archive
    • Video Articles
    • AJNR Case Collection
    • Case of the Week Archive
    • Case of the Month Archive
    • Classic Case Archive
  • Special Collections
    • AJNR Awards
    • Low-Field MRI
    • Alzheimer Disease
    • ASNR Foundation Special Collection
    • Photon-Counting CT
    • View All
  • Multimedia
    • AJNR Podcasts
    • AJNR SCANtastic
    • Trainee Corner
    • MRI Safety Corner
    • Imaging Protocols
  • For Authors
    • Submit a Manuscript
    • Submit a Video Article
    • Submit an eLetter to the Editor/Response
    • Manuscript Submission Guidelines
    • Statistical Tips
    • Fast Publishing of Accepted Manuscripts
    • Graphical Abstract Preparation
    • Imaging Protocol Submission
    • Author Policies
  • About Us
    • About AJNR
    • Editorial Board
    • Editorial Board Alumni
  • More
    • Become a Reviewer/Academy of Reviewers
    • Subscribers
    • Permissions
    • Alerts
    • Feedback
    • Advertisers
    • ASNR Home
  • Follow AJNR on Twitter
  • Visit AJNR on Facebook
  • Follow AJNR on Instagram
  • Join AJNR on LinkedIn
  • RSS Feeds

AJNR Awards, New Junior Editors, and more. Read the latest AJNR updates

Research ArticleMethodologic Perspectives

Characterization of Cyclic CSF Flow in the Foramen Magnum and Upper Cervical Spinal Canal with MR Flow Imaging and Computational Fluid Dynamics

S. Hentschel, K.-A. Mardal, A.E. Løvgren, S. Linge and V. Haughton
American Journal of Neuroradiology June 2010, 31 (6) 997-1002; DOI: https://doi.org/10.3174/ajnr.A1995
S. Hentschel
  • Find this author on Google Scholar
  • Find this author on PubMed
  • Search for this author on this site
K.-A. Mardal
  • Find this author on Google Scholar
  • Find this author on PubMed
  • Search for this author on this site
A.E. Løvgren
  • Find this author on Google Scholar
  • Find this author on PubMed
  • Search for this author on this site
S. Linge
  • Find this author on Google Scholar
  • Find this author on PubMed
  • Search for this author on this site
V. Haughton
  • Find this author on Google Scholar
  • Find this author on PubMed
  • Search for this author on this site
  • Article
  • Figures & Data
  • Info & Metrics
  • Responses
  • References
  • PDF
Loading

Article Figures & Data

Figures

  • Fig 1.
    • Download figure
    • Open in new tab
    • Download powerpoint
    Fig 1.

    An illustration of the computational model of the SAS used in the fluid dynamics simulations. The SAS is displayed as a series of connected points outside the spinal cord and inside the external boundary of the SAS. Flow and pressure are calculated for each point for a fluid with specific properties and flow rates. The number of points and their distance from each other determine the resolution of the computations and the length of time required for computation.
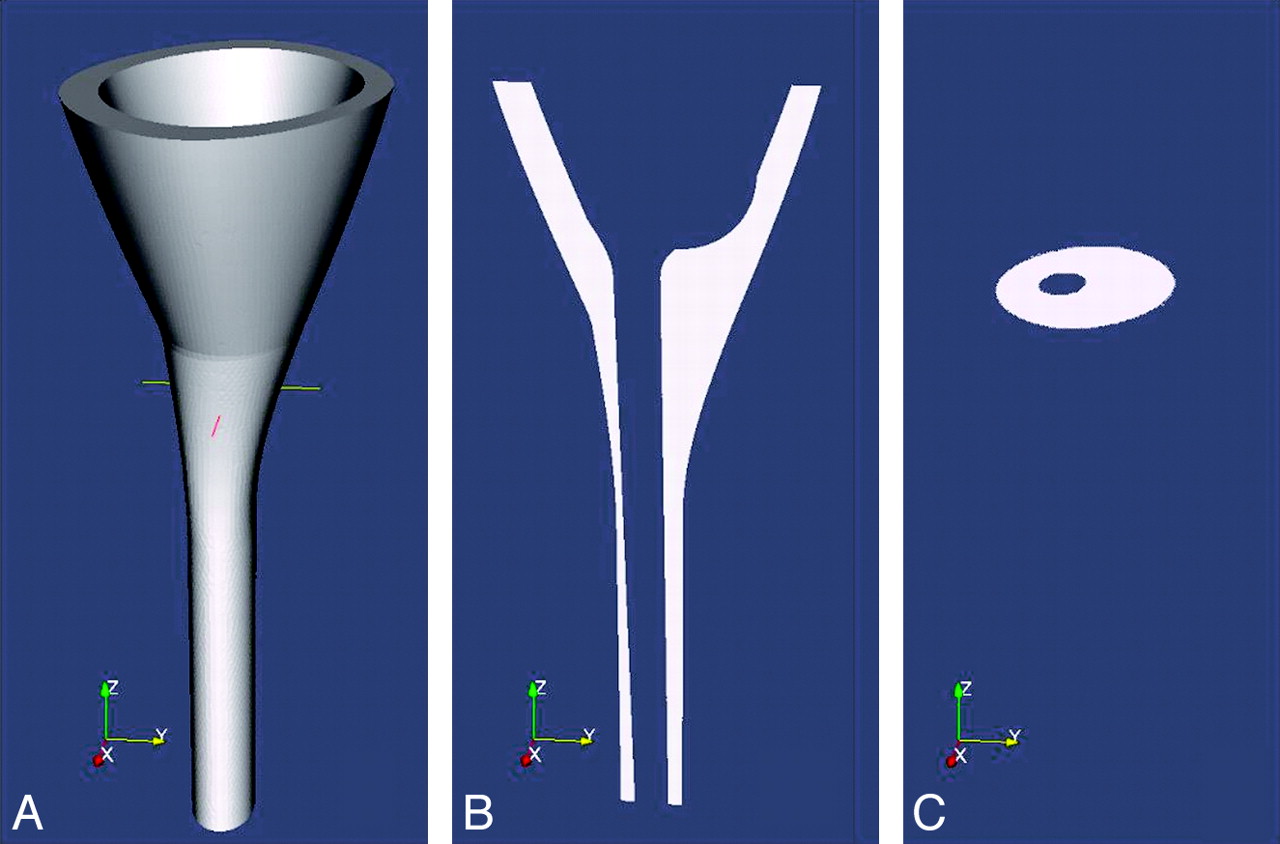
  • Fig 2.
    • Download figure
    • Open in new tab
    • Download powerpoint
    Fig 2.

    Sketches illustrating an idealized model of the SAS for CFD. A, A 3D hollow funnel-shaped structure is used to represent the surfaces of the SAS in the lower cranial vault and in the cervical spine. The internal surface of the SAS is created by the idealized model of the brain and spinal cord inserted into a nearly funnel-shaped structure. The transverse line in A represents the location of the craniovertebral junction in the model. B, A sagittal section of the structure shows the SAS as white and tissues external and internal to it as gray. C, An oblique axial section at the craniovertebral junction shows the SAS as white. Reprinted with permission from Linge et al.22
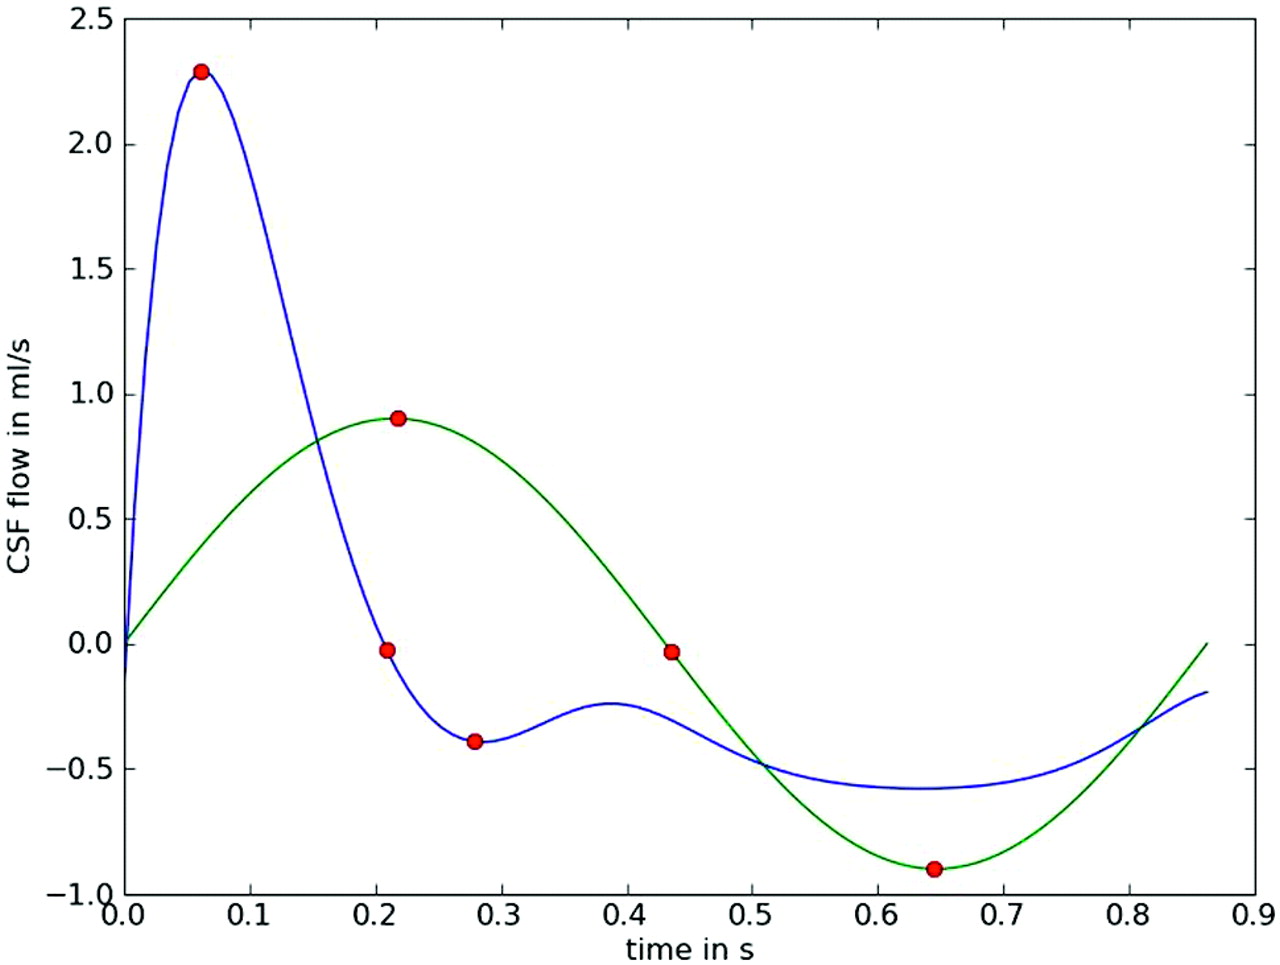
  • Fig 3.
    • Download figure
    • Open in new tab
    • Download powerpoint
    Fig 3.

    Line graphs demonstrating different time courses for CSF flow that can be used as input functions in CFD simulations. The y-axis shows the magnitude of flow in positive and negative directions; the x-axis shows time as a decimal fraction of the cardiac cycle. One time course (green line) illustrates CSF flowing in a sinusoidal manner, similar to that observed in some PC MR studies.11 The other (blue line) illustrates CSF flowing in a less symmetric manner as observed in other PC MR studies.7 The 3 red points illustrate first the maximal velocity in a positive direction (systolic flow) and then the change in direction from a positive to a negative flow and then maximal negative (diastolic) flow. Systolic flow lasts a shorter time and has a greater magnitude than diastolic flow in the second plot. Net flow during the cardiac cycle is zero in both plots.

  • Fig 4.
    • Download figure
    • Open in new tab
    • Download powerpoint
    Fig 4.

    Examples of CSF velocity simulations for maximal systolic flow for a single axial section in an idealized model of the SAS with different cord shapes or sizes. The asymmetric CSF flow pattern from Fig 3 is assumed for this simulation. The upper image shows velocities for a SAS containing a cord assumed to have a cylindric shape. The next image shows systolic flow when the cord is modeled with an elliptic rather than a circular cross-section. The boundary conditions are otherwise the same as those for the upper image. Note that changing the shape of the spinal cord changes the flow pattern during systole. The bottom image illustrates velocities in a model with a larger cylindric spinal cord and a smaller SAS. Note the marked increase in velocities due to a smaller SAS.
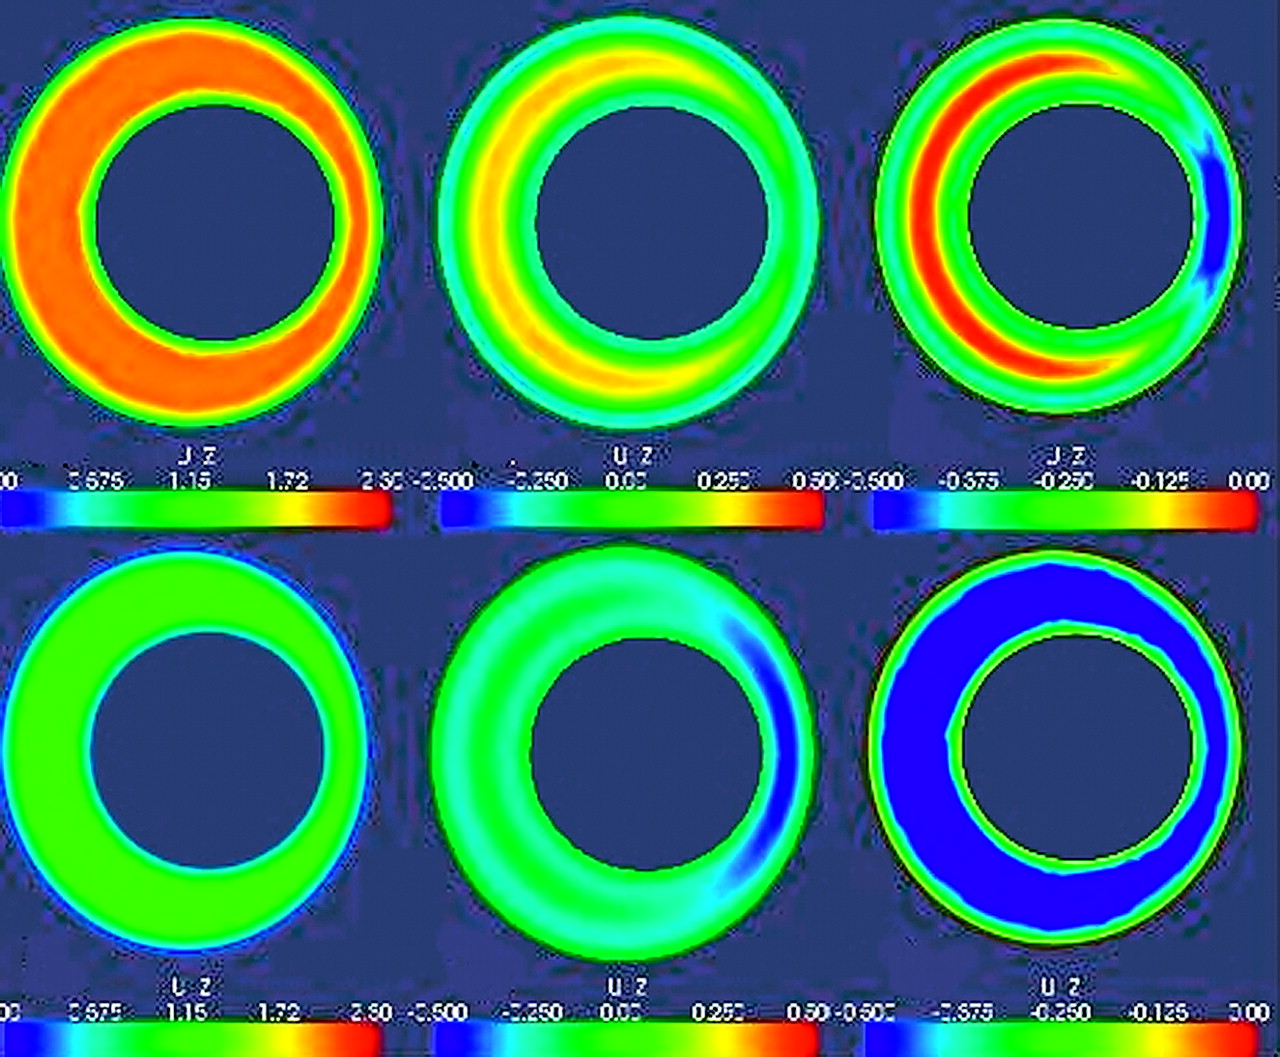
  • Fig 5.
    • Download figure
    • Open in new tab
    • Download powerpoint
    Fig 5.

    Effect of different temporal patterns of CSF flow on the homogeneity and magnitude of CSF velocities. In the first model used in Fig 4, CSF velocities at peak systolic flow (left column), at the transition to diastolic flow (middle column), and at peak diastolic flow (right column) are shown for an asymmetric temporal flow pattern (top row) and a symmetric sinusoidal flow pattern (lower row). For the asymmetric flow pattern, systolic velocities are greater than those for the symmetric flow pattern. Simultaneous cephalad (negative) and caudad flow (positive) at the transition is more obvious for the asymmetric flow pattern. During peak diastolic flow (right column), both positive and negative flow velocities are noted for the asymmetric flow patterns.
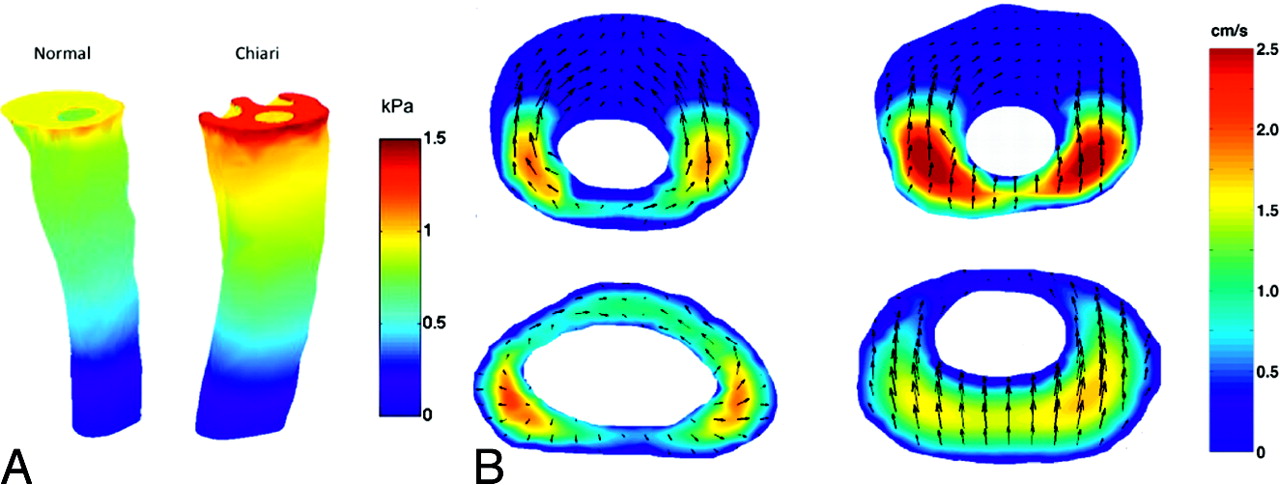
  • Fig 6.
    • Download figure
    • Open in new tab
    • Download powerpoint
    Fig 6.

    CSF flow velocities and pressures simulated in patient-specific models of the SAS for a healthy subject (left) and a patients with Chiari I (right). A, Pressure distribution at the inlet and along the outer spinal canal surface for the normal (left) and Chiari I (right) models during peak systole. B, Axial sections at the foramen magnum (upper images) and 4 cm lower in the spinal canal (lower images) are shown. The magnitude of flow through the axial section is indicated in centimeters per second by a color scale (reader's far right). The magnitude and direction of secondary (in section) flow are indicated by arrows. Flow is more inhomogeneous and faster in the patient with Chiari than in the healthy subject. Velocities are greater in both subjects at the foramen magnum than at the selected lower section. Courtesy of Alejandro Roldan.

  • Fig 7.
    • Download figure
    • Open in new tab
    • Download powerpoint
    Fig 7.

    Idealized models (above) of the brain, spinal cord, and SAS for simulating CSF flow in a healthy subject (left) and in a patient with Chiari (right). The red lines indicate the volume for which flow was calculated, and the yellow lines, the location of the axial section (below). In the axial sections, the flow patterns are heterogeneous in both the healthy subject (left in A and B) and the patient with Chiari (right in A and B). Peak velocities reach 2.27 cm/s in the healthy volunteer and 5.24 cm/s in the patient with Chiari (color scales to the right of the images).
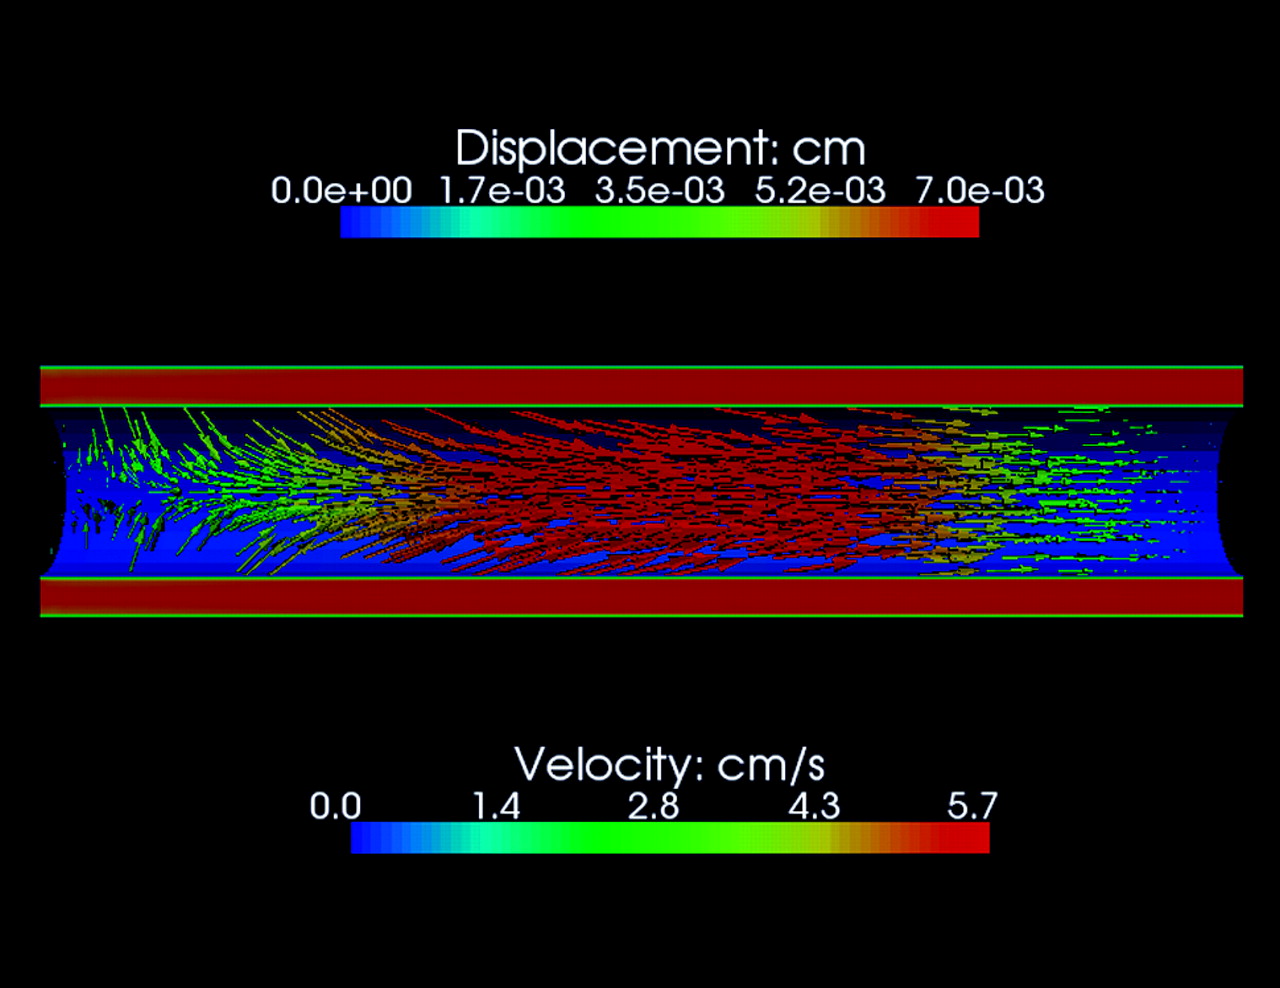
  • Fig 8.
    • Download figure
    • Open in new tab
    • Download powerpoint
    Fig 8.

    Deformation of the spinal cord secondary to CSF flow calculated by a CFD program that includes equations for the effect of elasticity. For the simulation, isotropic linear elasticity in the spinal cord is assumed. The diagram shows a sagittal view through the SAS and the spinal cord at the time of maximal systolic pressure. The CSF velocity, indicated by the color scale below the model, reaches 4–7 cm/s in the SAS while approaching zero near the dura and spinal cord. The velocity also changes from left (cephalad) to right (caudad), due to the effect of deformation on the cross-sectional area of the spinal cord. When the pressure wave passes along the cord, it initiates a caudad movement of the cord that results in narrowing the cord cephalad to the pulse. Where the cord is narrowed, the CSF velocity is diminished due to the increased volume of the SAS. The spinal cord deformation is indicated in this diagram by arrows that show the direction and colors that show the magnitude according to the scale above. Note that most of the deformation is longitudinal in a caudad direction, but radial deformation of lesser magnitude occurs cephalad to the pressure wave (left). CSF velocity and spinal cord deformation vary with the phase of the cardiac cycle. Integrated for the entire cycle, the spinal cord deformation and the CSF flow are zero at each spinal level. Although not illustrated here, the magnitude of deformation increases as the elasticity in the model is increased.

PreviousNext
Back to top

In this issue

American Journal of Neuroradiology: 31 (6)
American Journal of Neuroradiology
Vol. 31, Issue 6
1 Jun 2010
  • Table of Contents
  • Index by author
Advertisement
Print
Download PDF
Email Article

Thank you for your interest in spreading the word on American Journal of Neuroradiology.

NOTE: We only request your email address so that the person you are recommending the page to knows that you wanted them to see it, and that it is not junk mail. We do not capture any email address.

Enter multiple addresses on separate lines or separate them with commas.
Characterization of Cyclic CSF Flow in the Foramen Magnum and Upper Cervical Spinal Canal with MR Flow Imaging and Computational Fluid Dynamics
(Your Name) has sent you a message from American Journal of Neuroradiology
(Your Name) thought you would like to see the American Journal of Neuroradiology web site.
CAPTCHA
This question is for testing whether or not you are a human visitor and to prevent automated spam submissions.
Cite this article
S. Hentschel, K.-A. Mardal, A.E. Løvgren, S. Linge, V. Haughton
Characterization of Cyclic CSF Flow in the Foramen Magnum and Upper Cervical Spinal Canal with MR Flow Imaging and Computational Fluid Dynamics
American Journal of Neuroradiology Jun 2010, 31 (6) 997-1002; DOI: 10.3174/ajnr.A1995

Citation Manager Formats

  • BibTeX
  • Bookends
  • EasyBib
  • EndNote (tagged)
  • EndNote 8 (xml)
  • Medlars
  • Mendeley
  • Papers
  • RefWorks Tagged
  • Ref Manager
  • RIS
  • Zotero
0 Responses
Respond to this article
Share
Bookmark this article
Characterization of Cyclic CSF Flow in the Foramen Magnum and Upper Cervical Spinal Canal with MR Flow Imaging and Computational Fluid Dynamics
S. Hentschel, K.-A. Mardal, A.E. Løvgren, S. Linge, V. Haughton
American Journal of Neuroradiology Jun 2010, 31 (6) 997-1002; DOI: 10.3174/ajnr.A1995
del.icio.us logo Twitter logo Facebook logo Mendeley logo
  • Tweet Widget
  • Facebook Like
  • Google Plus One
Purchase

Jump to section

  • Article
    • Abstract
    • Abbreviations
    • Modeling the SAS to Simulate CSF Flow
    • Effect on CSF Flow of Varying Anatomy and Boundary Conditions in Rigid Models of the SAS
    • Effect of Tissue Elasticity, Motion, and Compressibility on CSF Flow in Nonrigid Models of the SAS
    • Conclusions
    • References
  • Figures & Data
  • Info & Metrics
  • Responses
  • References
  • PDF

Related Articles

  • No related articles found.
  • PubMed
  • Google Scholar

Cited By...

  • The myodural bridge of the American alligator (Alligator mississippiensis) alters CSF flow
  • Tapering of the Cervical Spinal Canal in Patients with Distended or Nondistended Syringes Secondary to Chiari Type I Malformation
  • Toward Improving Fidelity of Computational Fluid Dynamics Simulations: Boundary Conditions Matter
  • Patient-Specific 3D Simulation of Cyclic CSF Flow at the Craniocervical Region
  • Crossref
  • Google Scholar

This article has not yet been cited by articles in journals that are participating in Crossref Cited-by Linking.

More in this TOC Section

  • A Meta-Analysis on the Diagnostic Performance of 18F-FDG and 11C-Methionine PET for Differentiating Brain Tumors
  • Multivariate Classification of Blood Oxygen Level–Dependent fMRI Data with Diagnostic Intention: A Clinical Perspective
  • Guidelines for the Ethical Use of Neuroimages in Medical Testimony: Report of a Multidisciplinary Consensus Conference
Show more METHODOLOGIC PERSPECTIVES

Similar Articles

Advertisement

Indexed Content

  • Current Issue
  • Accepted Manuscripts
  • Article Preview
  • Past Issues
  • Editorials
  • Editor's Choice
  • Fellows' Journal Club
  • Letters to the Editor
  • Video Articles

Cases

  • Case Collection
  • Archive - Case of the Week
  • Archive - Case of the Month
  • Archive - Classic Case

More from AJNR

  • Trainee Corner
  • Imaging Protocols
  • MRI Safety Corner
  • Book Reviews

Multimedia

  • AJNR Podcasts
  • AJNR Scantastics

Resources

  • Turnaround Time
  • Submit a Manuscript
  • Submit a Video Article
  • Submit an eLetter to the Editor/Response
  • Manuscript Submission Guidelines
  • Statistical Tips
  • Fast Publishing of Accepted Manuscripts
  • Graphical Abstract Preparation
  • Imaging Protocol Submission
  • Evidence-Based Medicine Level Guide
  • Publishing Checklists
  • Author Policies
  • Become a Reviewer/Academy of Reviewers
  • News and Updates

About Us

  • About AJNR
  • Editorial Board
  • Editorial Board Alumni
  • Alerts
  • Permissions
  • Not an AJNR Subscriber? Join Now
  • Advertise with Us
  • Librarian Resources
  • Feedback
  • Terms and Conditions
  • AJNR Editorial Board Alumni

American Society of Neuroradiology

  • Not an ASNR Member? Join Now

© 2025 by the American Society of Neuroradiology All rights, including for text and data mining, AI training, and similar technologies, are reserved.
Print ISSN: 0195-6108 Online ISSN: 1936-959X

Powered by HighWire