
Abstract
BACKGROUND AND PURPOSE: Volumetric measurements on structural MR images are an established method to investigate pathology-related volume changes in cortex. Manual volumetric methods have sometimes been referred to as the reference standard for quality control of automatic volumetric methods. While some automatic methods, like VBM, may rely on a template, manual methods use sulci as indirect landmarks for the subdivision of cortex. The purpose of this study was to compare volumetric data generated by MM and VBM on 4 multimodal regions in the frontal lobe.
MATERIALS AND METHODS: We investigated 4 multimodal frontocortical regions by MM and VBM in patients with frontotemporal lobar degeneration and Alzheimer disease and controls.
RESULTS: MM and VBM results were highly correlated for dorsolateral prefrontal cortex, orbitofrontal cortex, and hippocampus, but not for the dorsal and rostral anterior cingulate. VBM results were more consistent with results from previous studies on cingulate in frontotemporal lobar degeneration. Our results may potentially be explained by 2 factors. First, the volume of small cortical regions may be more affected by anatomic variability than large regions in the MM. Second, it has been shown that the location of multimodal cytoarchitectonic areas, such as the cingulate cortex, may be difficult to predict by the appearance of sulci and gyri.
CONCLUSIONS: While both VBM and the MM may do equally poorly in predicting cytoarchitecture, the MM may add additional unrelated variance caused by anatomic variability. Thus, paradoxically, the higher anatomic precision of the MM may potentially cause a weaker relation to cytoarchitecture.
ABBREVIATIONS:
- DACC
- dorsal anterior cingulate cortex
- DLPC
- dorsolateral prefrontal cortex
- FTD
- frontotemporal dementia
- ICC
- intraclass correlation coefficient
- MM
- manual method
- RACC
- rostral anterior cingulate cortex
- SCI
- subjective cognitive complaint
- VBM
- voxel-based morphometry
The brain undergoes a constant structural change from birth to old age.1,2 Indirect evidence for such changes at a microscopic level may, for example, be found by a reduction or increase of the volume of cortical regions.2⇓–4 Numerous studies have shown that cortical regions increase or decrease in volume both during development2,5 and in aging.4,6,7 The frontal lobe and, in particular, the prefrontal cortex may be particularly vulnerable in aging, which is manifested by more age-related volume loss in this part than in other parts of the brain.3,4,8
Another hypothesis, however, suggests that multimodal areas, not just the frontal lobe, may display more shrinkage than unimodal and primary cortical areas during the greater part of adult life.8 Regional cortical volume loss may also be induced by pathology. In different variants of dementia, such as Alzheimer disease or frontotemporal lobar degeneration, brain volume loss is commonly more severe than in healthy aging.9,10 Different networks may be particularly vulnerable in different variants of dementia,11 which has been related to pathology-specific vulnerability of certain cells or cell structures in cortex. For example, the von Economo neurons and fork cells in the anterior cingulate gyrus and frontoinsular parts of the brain have been shown to be particularly vulnerable to degeneration in the behavior variant of frontotemporal lobar degeneration.12,13
Thus a central aim in cortical volumetric studies on structural MR images is to make a reliable and relevant subdivision of cortex. Traditionally, sulci and gyri are used as indirect landmarks for cytoarchitecture. Such landmarks may, however, be more or less reliable depending on what level in the synaptic hierarchy14 is investigated. Sulci and gyri may be good predictors for the location of primary and unimodal areas,15 but they may be highly unreliable landmarks for higher, multimodal areas in the synaptic hierarchy.15,16 This may create a particular problem in manual methods, as volumetric data, in some cases, may be more related to the anatomic variability in the size of gyri than to a potential age-related or pathology-related shrinkage of these gyri.
One example of a multimodal region with substantial anatomic variability is the anterior cingulate cortex.17 Interestingly, one study found that the volume and the cortical thickness in subparts of this region were related to the morphologic characteristics of the cingulate and paracingulate sulcus.18 Thus, if a paracingulate sulcus was present, then an increase in paracingulate cortex and decrease of anterior cingulate cortex volume was found in the same hemispheres.18 When a left paracingulate sulcus was present, this was associated with increased cortical thickness in the right anterior cingulate cortex as well as in the left paracingulate cortex. No corresponding effects were found when a right paracingulate was present.18 Thus, the cingulate cortex is an example of a multimodal area that displays pronounced anatomic variation. We have previously investigated frontocortical volumes, including the anterior cingulate, by MM in subtypes of frontotemporal lobar degeneration. However, in this study, we were not able to find significant atrophy in the anterior cingulate in FTD.19 We hypothesized that the anatomic variability of this region caused a larger difference in volume than a potential reduction of volume caused by atrophy.
In the present study, we compare volumetric data generated by MM from previous studies, with mean gray matter attenuation generated by VBM (using a template-based parcellation) in healthy controls and patients with subtypes of frontotemporal lobar degeneration and Alzheimer disease. Our aims are to 1) investigate the consistency between MM and VBM for 2 multimodal regions, and 2) compare results from MM and VBM with previous findings on the subtypes of dementia included in this study.
Materials and Methods
Participants
Participants were recruited retrospectively from the Memory Clinic at the Karolinska University Hospital Huddinge, Stockholm, Sweden. Participants have been previously described.19⇓⇓⇓–23
All participants went through the standard investigation procedure at the memory clinic. Clinical diagnoses were determined at a multidisciplinary consensus conference with physicians, neuropsychologists, speech-language pathologists, and nurses.24 Frontotemporal lobar degeneration syndromes were diagnosed following international consensus criteria.25 Patients with frontotemporal lobar degeneration and Alzheimer disease at different stages of the disease were included. Diagnoses of Alzheimer disease were based on criteria of the International Classification of Diseases (10th Revision). The control group included patients referred to the memory clinic because of mild subjective forgetfulness in everyday life. Objective cognitive impairment was ruled out through comprehensive neuropsychologic assessment (impairment was defined as performance 1.5 standard deviation units below the age-normal mean on any cognitive test). To further minimize the risk of including participants with neurodegenerative diseases in very early stages, we included only those participants whose performance did not deteriorate over a minimum of 2 years follow-up. The control group is denoted SCI in the investigations described here.
Manual measurements were available for the same frontotemporal lobar degeneration subjects for all regions. In Alzheimer disease and SCI subjects, more measurements were available for the hippocampus and dorsal anterior cingulate and the orbitofrontal cortex, and these were included in the analysis (Table 1).
Number of included patients in the comparison between manual tracing and VBM data
Image Acquisition
T1-weighted MR images were acquired on a 1.5T Magnetom Vision Plus scanner (Siemens Medical Systems, Erlangen, Germany). A 3D magnetization-prepared rapid acquisition of gradient echo pulse sequence (repetition time, 11.4 ms; echo time, 4.4 ms; inversion time, 300 ms; flip angle, 10°; number of excitations, 1) was used to obtain 72 contiguous coronal 2.5-mm sections, with a 512 × 144 matrix and a 230-mm field of view. Original images were subsequently interpolated to 1 × 1 × 1 mm voxels, on which images volumetric analyses were performed.
Volumetric Measurements
Manual and template-based volumetric data were obtained for 5 brain regions: the DLPC, the rostral and dorsal part of the anterior cingulate gyrus, the orbitofrontal cortex, and the hippocampus. The manual parcellation method, which relies on indirect landmarks of sulci and gyri, was done following the guidelines proposed by Suzuki et al26 (DLPC) and McCormick et al (cingulate cortex).17 In brief, the medial border of the DLPC was the cingulate sulcus, the lateral border was the inferior frontal gyrus, the posterior border was the precentral sulcus, and the anterior border was the frontomarginal sulcus. Borders for the cingulate cortex were the cingulate and the callosal sulcus. The posterior border of the rostral anterior cingulate was the 1 section anterior to where the forceps minor of the corpus callosum first connects the 2 hemispheres. For the posterior border of the dorsal anterior cingulate, we followed the guidelines proposed by Fornito et al, finishing 1 coronal section posterior to the anterior commisure.27 For the tracing of the orbitofrontal cortex, we followed the guidelines proposed by Crespo-Facorro et al.28 In the coronal view, the medial border at the most anterior end was the superior rostral sulcus. When the olfactory sulcus became visible, it was used as the medial border. The lateral border was the anterior frontomarginal sulcus, the center was the lateral orbital sulcus, and the most posterior section was the orbitoinsular sulcus. Tracing ended when the medial orbitofrontal gyrus was no longer visible, moving from anterior to posterior.
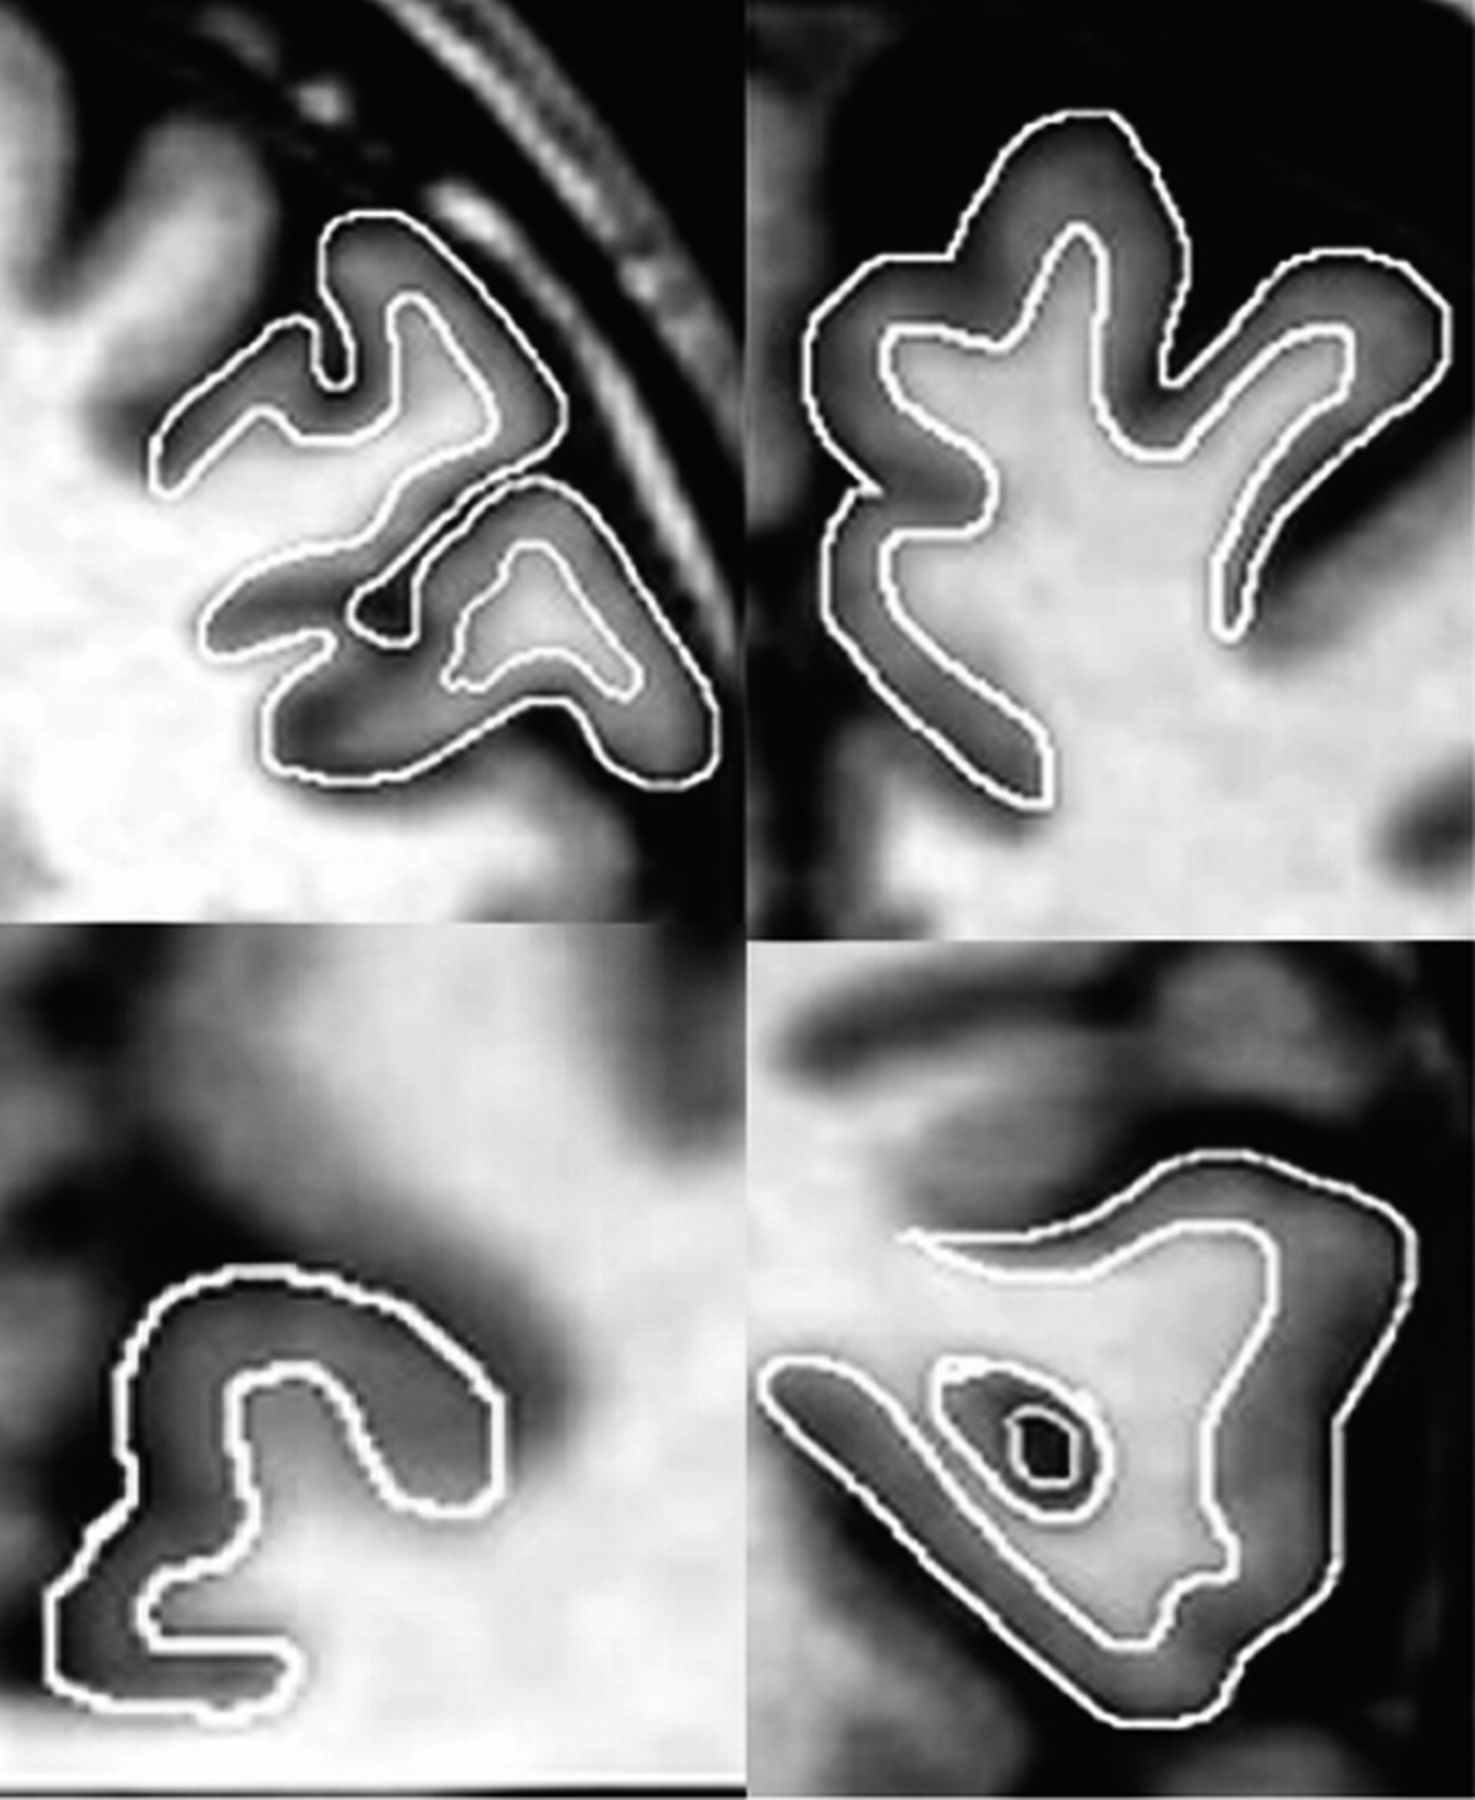
Manual measurement of the hippocampus was accomplished following the guidelines proposed by Malykhin et al.29 The hippocampus was included as a quality control of the VBM method. This region exhibits high reliability in manual tracing and relatively small anatomic variability compared with cortical regions. The intracranial volume was obtained using a stereologic point-counting technique, consisting of manual tracing of the intracranial volume on every fourth section, following the landmarks proposed by Eritaia et al.30 The manual tracing technique is illustrated in Fig 1.

The manual delineation technique in 4 regions. Top right, superior frontal gyrus; left, middle frontal gyrus. Bottom right, inferior frontal gyrus; left, dorsal anterior cingulate gyrus.
Structural data were processed with FSL-VBM, a voxel-based morphometry style analysis31,32 carried out with the FMRIB Software Library 4.1 tools (http://www.fmrib.ox.ac.uk/fsl).33 The procedure was carried out as follows:
1) Brain extraction of T1 images was performed by using BET.34 In this step, brain is extracted from surrounding tissue.
2) Tissue-type segmentation was carried out using FAST4.1.35 This tool segments a 3D image of the brain into different tissue types (gray matter, white matter, CSF, etc) while also correcting for spatial intensity variations.
3) The segmented gray matter images were then aligned to Montreal Neurological Institute 152 standard space using the affine registration tool FLIRT.36,37
4) The resulting images were averaged to create a study-specific template (which, thus, is an average image of all included subjects).
5) Native gray matter images (for each subject) were then nonlinearly reregistered to the study-specific template.
6) The registered segmented images were then smoothed with an isotropic Gaussian kernel with a sigma of 2 mm.
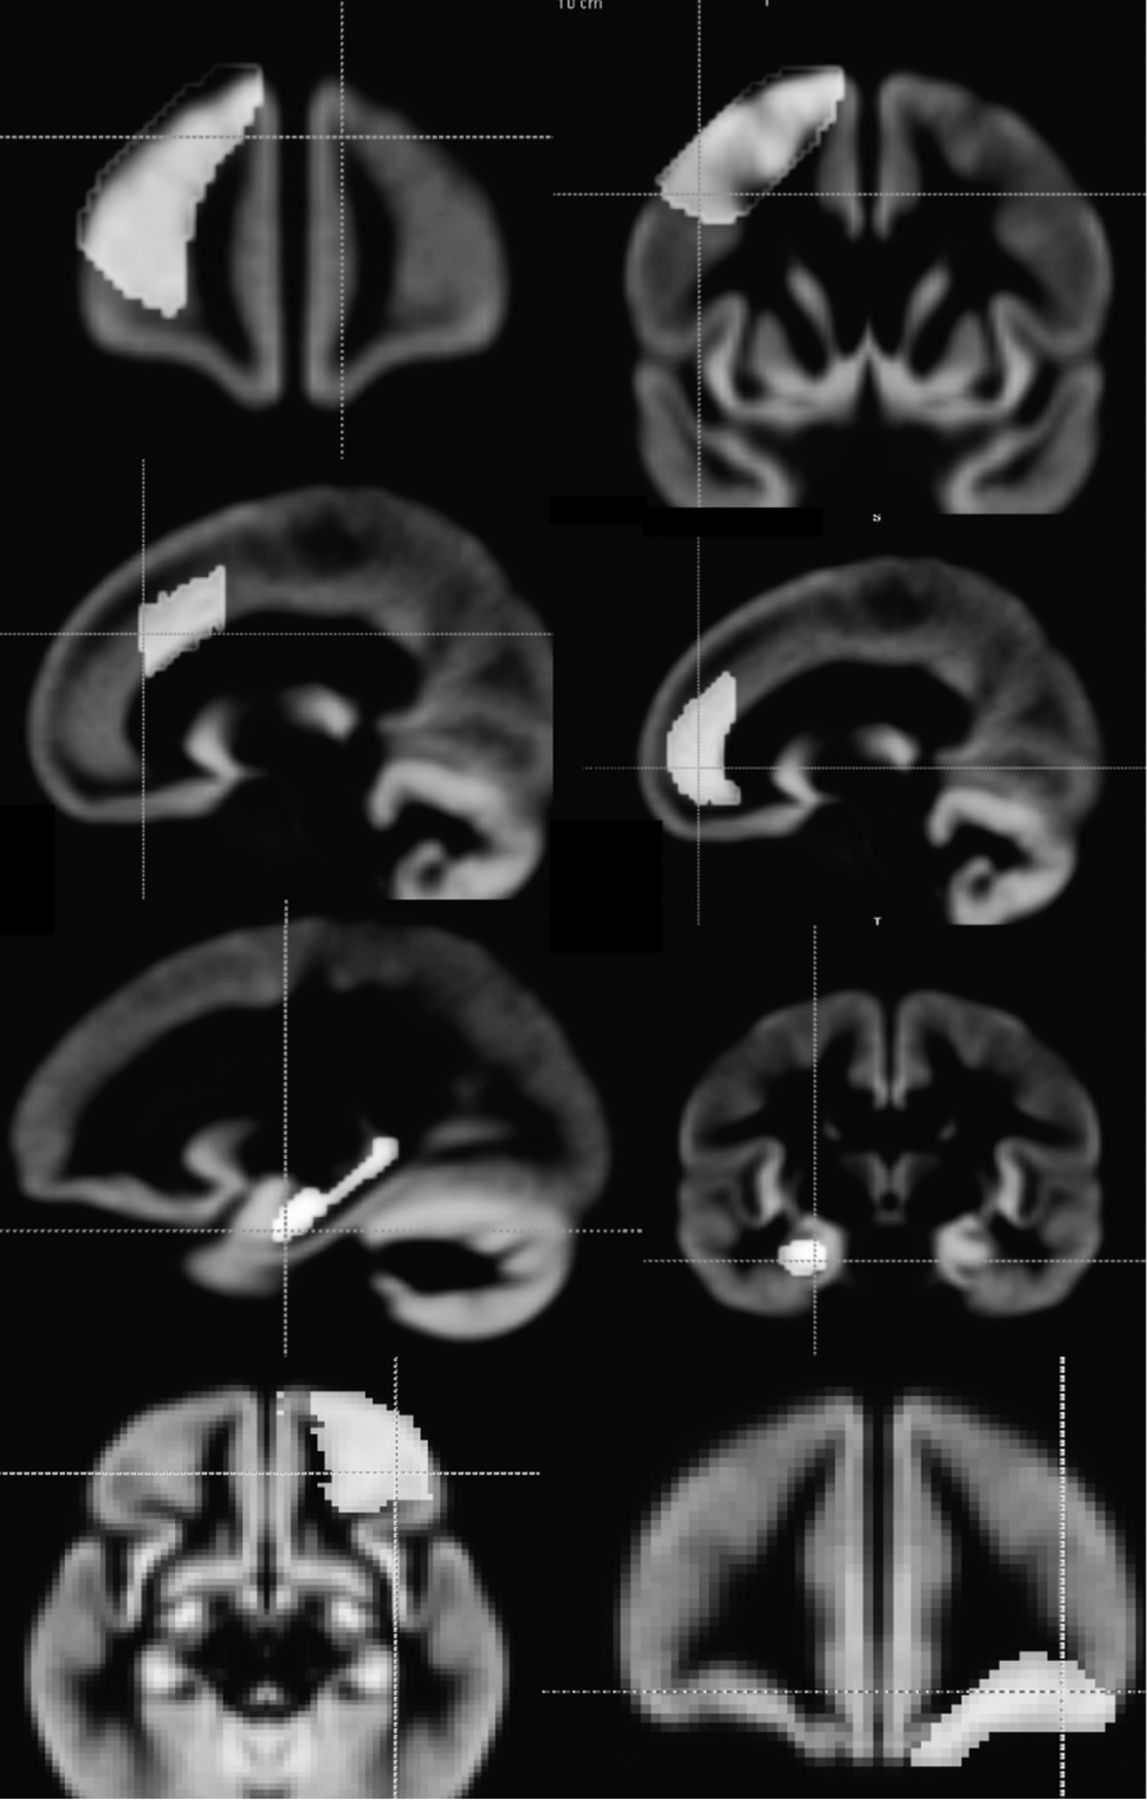
7) Gray matter masks for parcellation of the investigated brain regions were created by drawing on the study-specific template (from step 4) that is generated by the FSL program (Fig 2). The masks were drawn for the 5 regions previously measured by manual tracing.19
8) The regional masks were applied to the smoothed gray matter (sigma = 2 mm) data of each subject with AFNI (open source software for neuroimaging data analysis, http://afni.nimh.nih.gov/) to obtain the mean attenuation of gray matter in the masked regions.

Binary masks drawn on the gray matter template generated by the FSL program. In the top row, dorsolateral prefrontal cortex masks are displayed (anterior and posterior). The second row displays rostral anterior cingulate to the left, and dorsal anterior cingulate to the right. The third row displays the mask for the hippocampus, and the fourth row shows the subcallosal medial prefrontal cortex.
Consistency Between Methods
Consistency between the region/intracranial volume (normalized as z-scores) from the MM was compared with gray matter attenuation (normalized as z-scores) by ICCs.38 Contrary to a traditional correlation that operates on paired observations, ICC operates on data structured as groups. ICC is traditionally used for investigating interrated reliability of the MM.
The theoretic formula for ICC is:

where σ2(w) is the pooled variance within subjects and σ2(b) is the variance of the trait between subjects.
Results
Results revealed high consistency in z-scores for mean gray matter attenuation (VBM) and manual volumetric data (region of interest divided by intracranial volume) for the DLPC and hippocampus and orbitofrontal cortex.
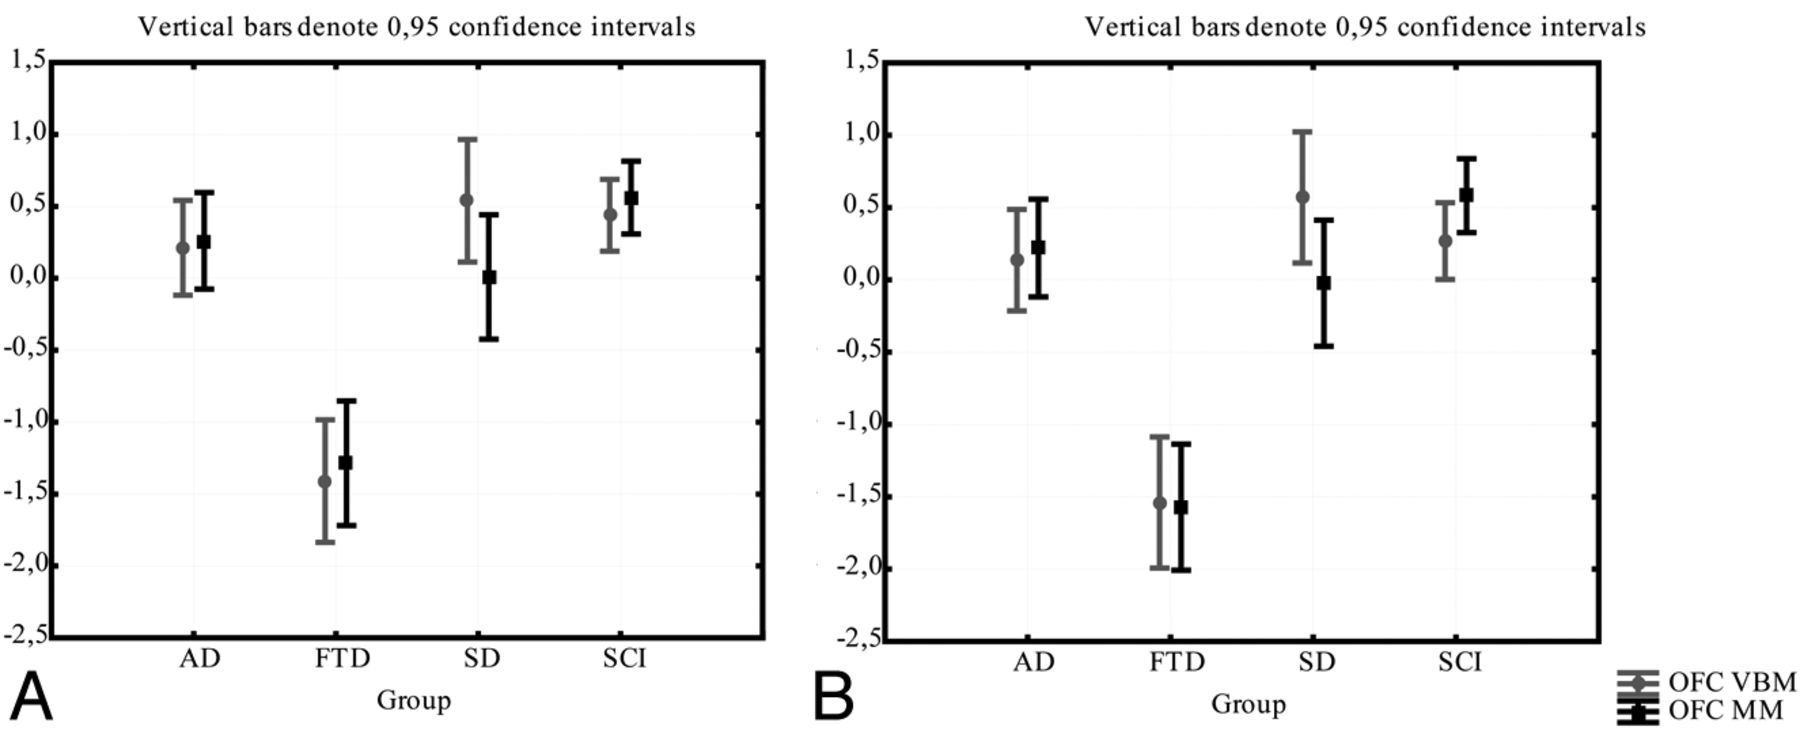
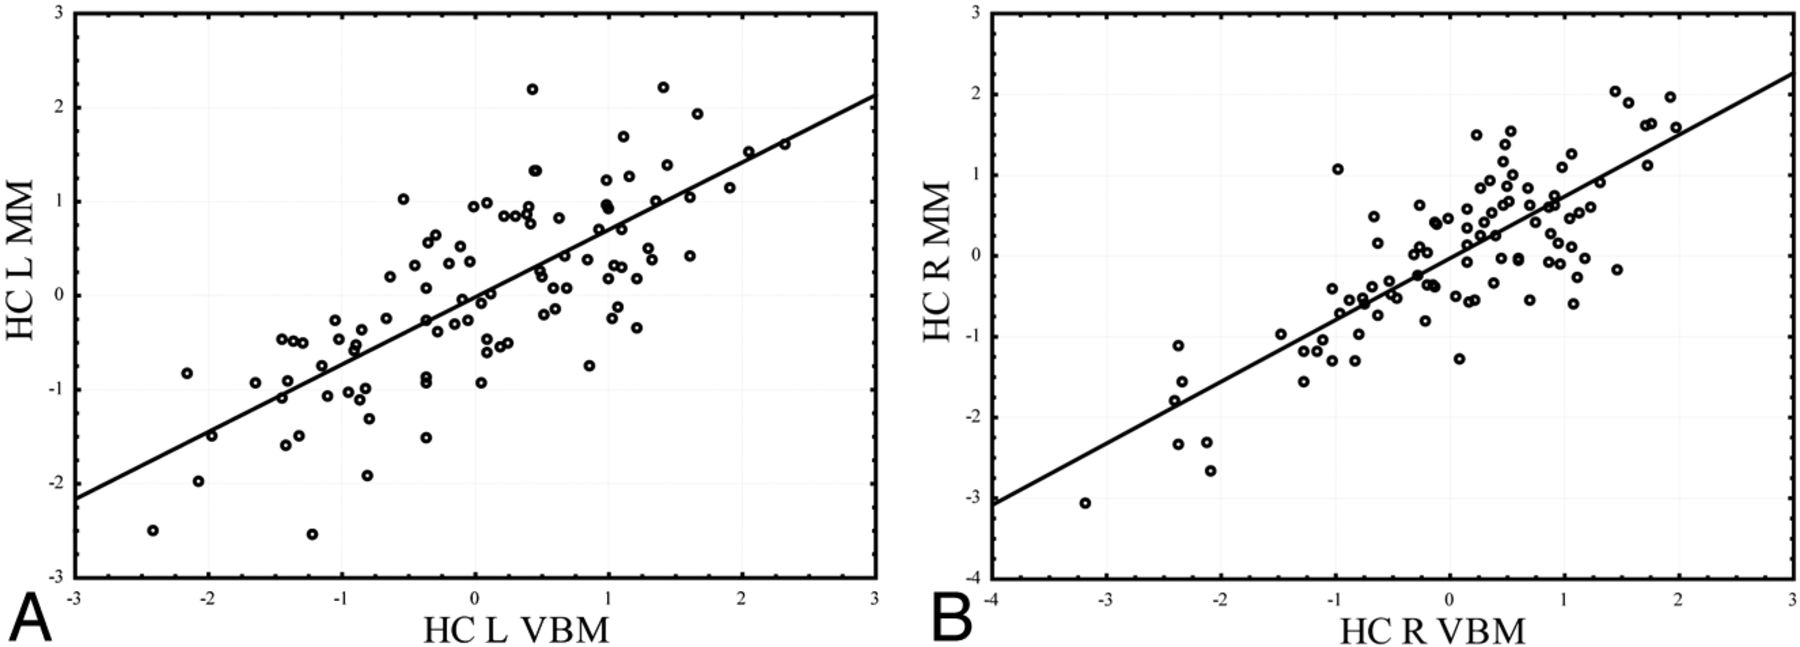
No significant difference was found between the methods in any of the investigated groups in a 1-way repeated ANOVA (Figs 3–5). Intraclass correlation between methods was also high (ICC 0.62–0.80; Table 2). Correlation between the MM and VBM methods is plotted in Figs 6–8.

The comparison between the manual and VBM methods for the hippocampus. Gray matter intensity (from VBM) and the volume/intracranial volume (from the manual method) are normalized as z-scores for comparison. Comparison of methods in the left (A) and right (B) hippocampus.

The comparison between the manual and VBM methods for the DLPC. Gray matter intensity (from VBM method) and the volume/intracranial volume (from the manual method), are normalized as z-scores for comparison. Comparison of methods in the left (A) and right (B) DLPC.

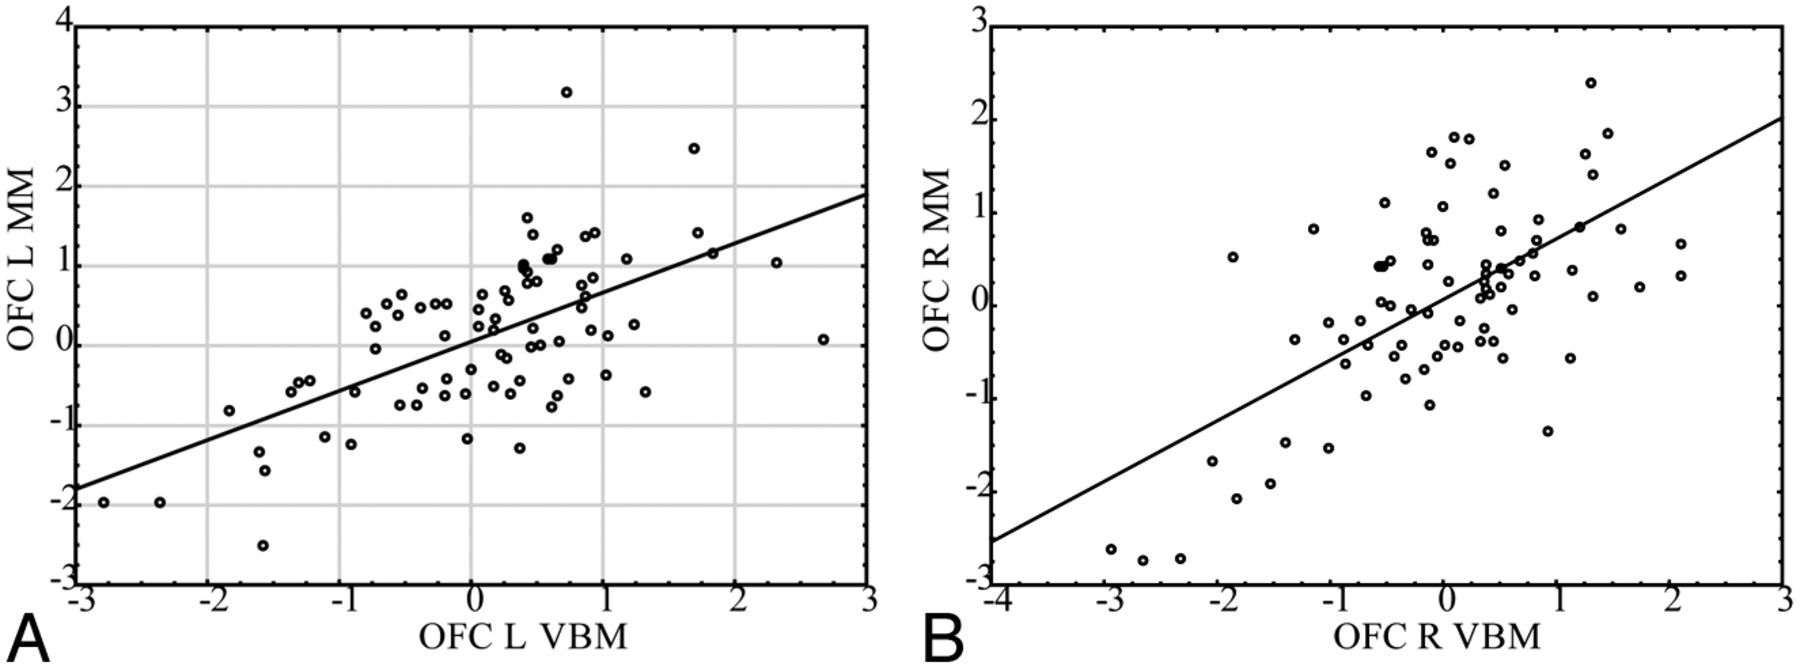
The comparison between the manual and VBM methods for the orbitofrontal cortex. Gray matter intensity (from VBM) and the volume/intracranial volume (from the manual method) are normalized as z-scores for comparison. Comparison between methods in the (A) left and right (B) orbitofrontal cortex.
ICC between the gray matter densities (VBM) and volume divided by intracranial volume (MM) in investigated regions of interest

The correlation between the VBM and manual methods for the hippocampus. Gray matter intensity (from VBM) and the volume/intracranial volume (from the manual method) are normalized as z-scores for comparison. A, Left hippocampus (Pearson r = 0.75); B, right hippocampus (Pearson r = 0.83).

The correlation between the VBM and manual methods for the dorsolateral prefrontal cortex. Gray matter intensity (from VBM) and the volume/intracranial volume (from the manual method) are normalized as z-scores for comparison. A, Left dorsolateral prefrontal cortex (Pearson r = 0.60); B, right dorsolateral prefrontal cortex (Pearson r = 0.71).

The correlation between the VBM and manual methods for the dorsolateral prefrontal cortex. Gray matter intensity (from VBM) and the volume/intracranial volume (from the manual method) are normalized as z-scores for comparison. A, Left orbitofrontal cortex (Pearson r = 0.62); B, right orbitofrontal cortex (Pearson r = 0.64).
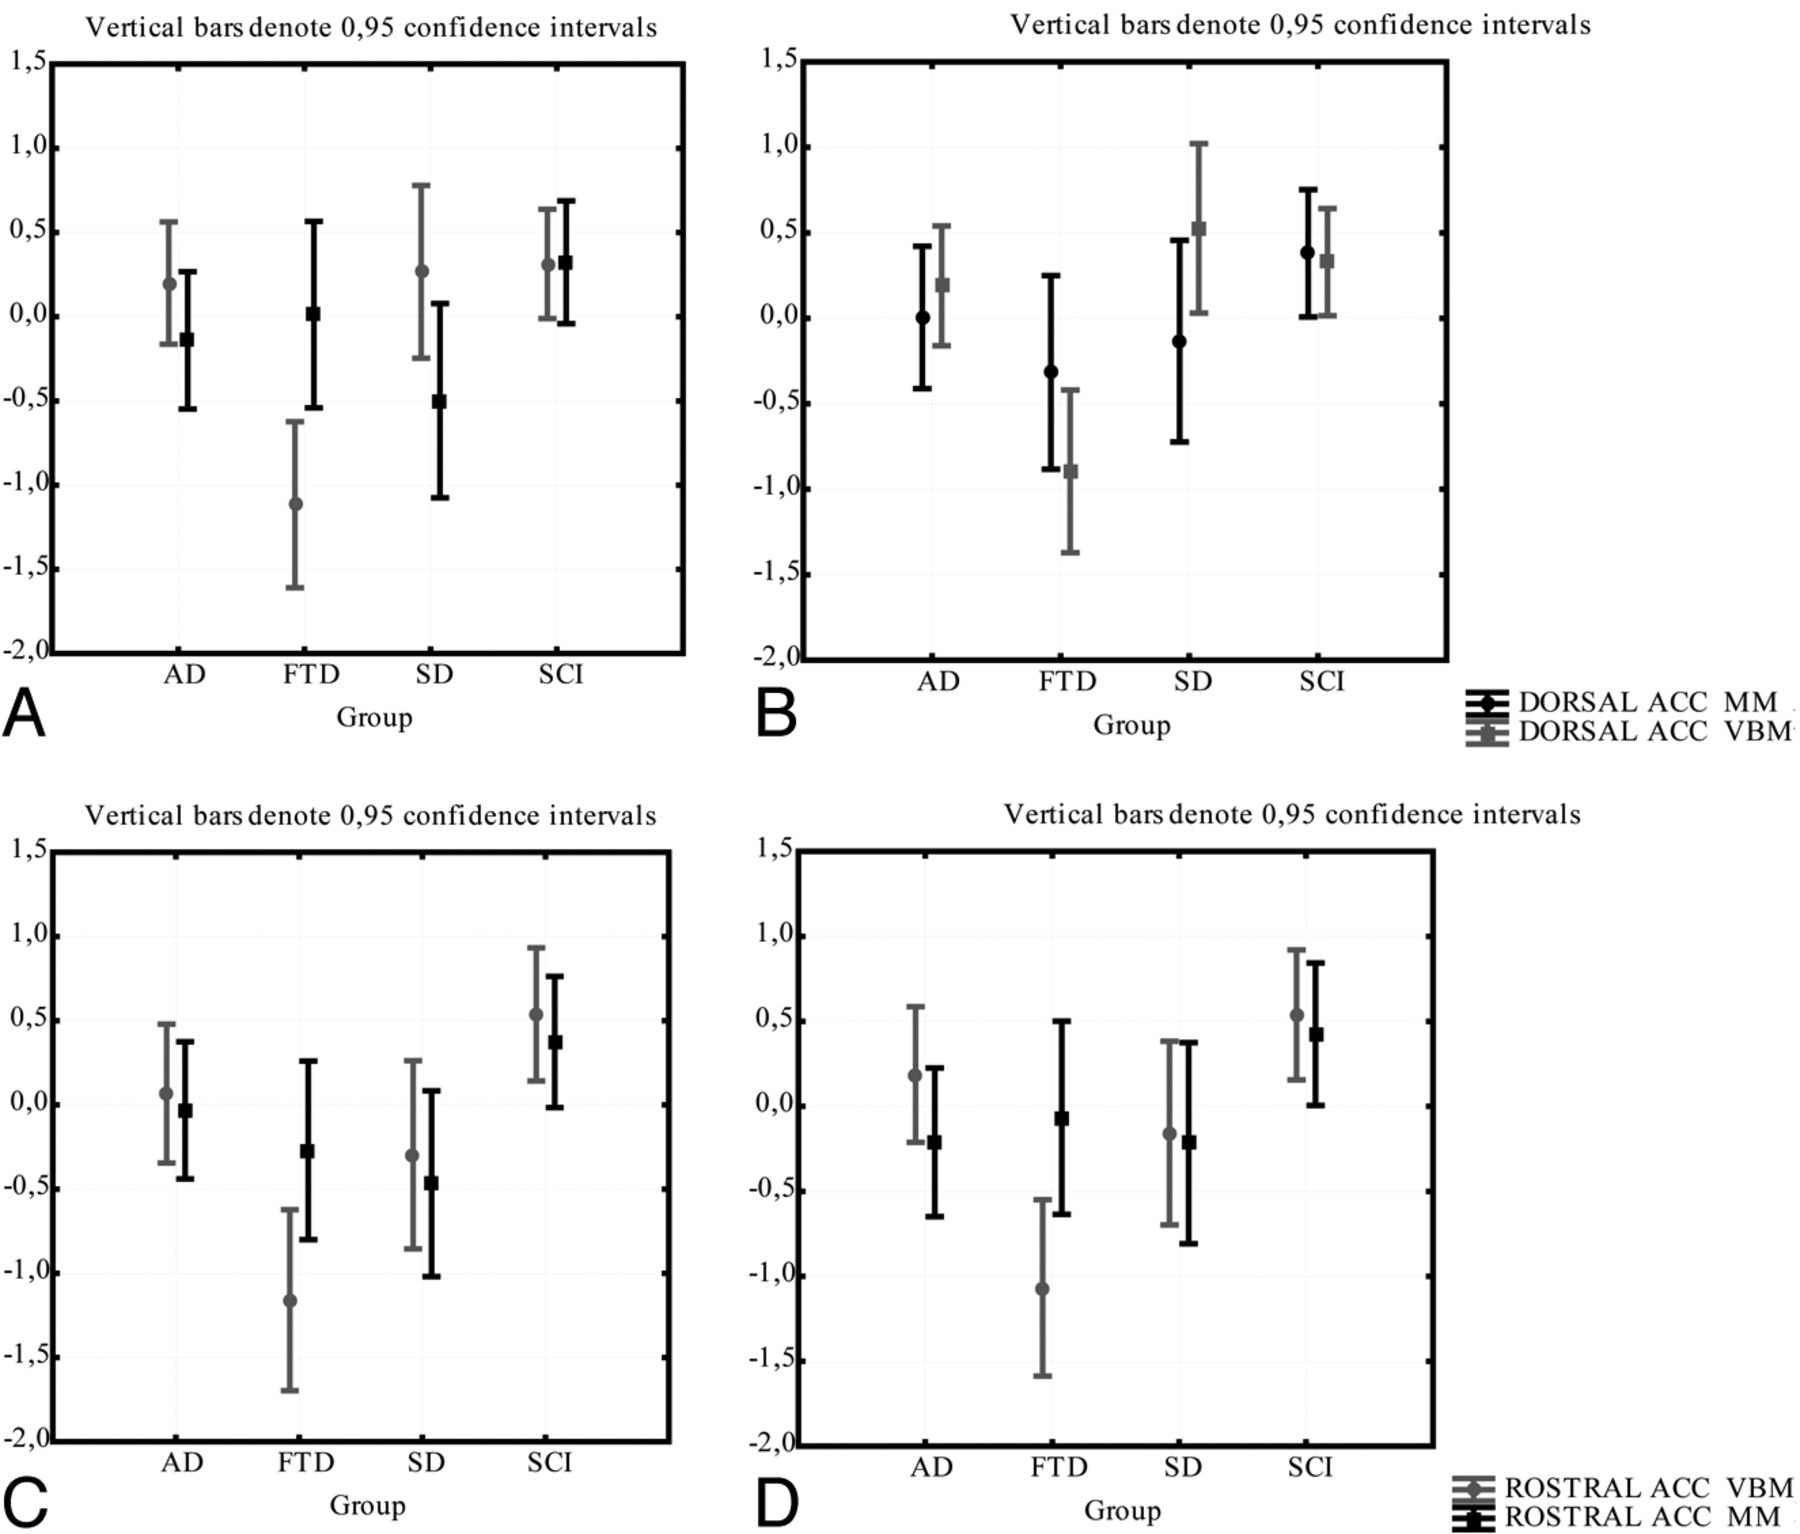
In the 2 subparts of the cingulate gyrus, consistency was very poor. In a repeated ANOVA there was a significant difference between the methods in right dorsal anterior cingulate gyrus in patients with FTD (in which z-scores for gray matter attenuation were significantly smaller than z-scores for normalized volumes) (Fig 9A). While there was no significant difference between the methods in any subgroups in the other anterior parts of the cingulate (Fig 9 B–D), the ICC between the methods was very poor (0.22–0.31; Table 2).

The comparison between the manual and the VBM method for the DACC and RACC. Gray matter intensity (from VBM) and the volume/intracranial volume (from the manual method) are normalized as z-scores for comparison. Comparison of methods in right (A) and left (B) DACC; comparison of methods in right (C) and left (D) RACC.
Discussion
The aim of this study was to compare 2 volumetric methods (VBM and MM) in patients with subtypes of dementia and in subjects with subjective cognitive complaint. We found high correlation between VBM and MM for the dorsolateral prefrontal cortex, orbitofrontal cortex, and the hippocampus, while correlation was poor between the methods when applied to the anterior cingulate. Pronounced differences between the methods were thus found to be specific to the subparts of anterior cingulate gyrus. This could potentially be explained by the gross-morphologic variation of this region.
In Fig 10 , we show the delineation of cingulate sulcus for 4 subjects of the investigated cohort. As can be observed in this figure, there is not only large variability in the size of the gyrus between different brains but also substantial difference between the left and right side of the same brain. This may be particularly problematic because, as noted in the introduction, it has been found that the relationship between the gross-morphologic appearance of sulci and gyri and cytoarchitecture is weak in multimodal cortical regions like the cingulate.15

The anatomic variability of the cingulate sulcus in 4 sample brains from the investigated cohort. Left hemisphere is to the left and the contralateral side of the same brain is shown to the right. See McCormick et al17 for a definition of cingulate sulcus.
A fundamental question is, of course, how 2 so radically different methods such as VBM and MM can be compared. The theoretic assumption of VBM is that the amount of gray matter in the brain may be reduced by a neurodegenerative process. Thus, patients with atrophy will display a reduced amount of regional gray matter attenuation. In the MM, the total volume of a region may be reduced by a neurodegenerative process. However, the total volume is also related to other factors such as the size of the head. In a healthy subject, the volume of the brain should be closely correlated with the volume of the cranium (intracranial volume). Thus, if atrophy of the brain or of a brain region occurs, then the ratio of volume of structure divided by volume of cranium will be smaller. Therefore, it could be said that we are comparing “brain attenuation” (how much brain/brain regions there are in relation to the skull) with gray-matter attenuation (the average attenuation of gray matter in the brain or in a region of the brain).
A limitation of this study is that we cannot directly test the relationship between function or cytoarchitecture and gross morphology. We can, however, compare our findings with results of previous studies. The von Economo neurons of the frontoinsular cortex and the anterior cingulate gyrus have been shown to be particularly vulnerable in patients with FTD.12,39,40 Previous studies have also shown that this region may display significant volume loss in these patients (for a review, see Whitwell and Jack9). While this was not confirmed in our manual calculations, we found significant gray matter loss by VBM in all subparts of this region in patients with FTD.
Another limitation of both the MM and VBM is that neither of the methods can predict the location of a cytoarchitectonically defined cingulate cortex. The MM may, however, add further variance in volumetric data (related to the size of gyri), which thus might create a weaker relationship to the actual size of the cytoarchitectonic-defined area.
The methodologic comparison for the cingulate gyrus may lead to the assumption that manual parcellation of the frontal lobe may be problematic altogether. Great similarities were found, however, in the results of the 2 methods for the dorsolateral prefrontal cortex, the orbitofrontal cortex, and the hippocampus.
One interpretation of this may be that while the variability of sulci may be equally high in the DLPC, orbitofrontal cortex, and anterior cingulate cortex, the relative effect (in percent of increase or decrease of volume) will be related to the total size of the delineated region. Thus, a small region may be more influenced by the variable location of a sulcus than a large region.
The present findings may paradoxically indicate that a careful sulci-based parcellation of an anatomic variable multimodal area may create volumetric data that may be less correlated with the underlying cytoarchitecture than a template based parcellation. In this study, the MM failed to show pathology-related shrinkage in the anterior cingulate gyrus in FTD, while this was apparent in this subtype of dementia in the VBM results.
Conclusions
This study suggests that manual volumetrics on multimodal areas of the frontal cortex may be particularly problematic when the region is small and displays great anatomic variability. In such cases, a template-based approach may be more rewarding, as it does not add further unrelated variance (caused by variation in gyral size) to the volumetric results.
Acknowledgments
This research has made use of the SMILE medical imaging laboratory at Karolinska University Hospital and Karolinska Institute, Stockholm, Sweden. This research was supported by Alzheimer Foundation and Swedish Brain Power.
Footnotes
Disclosures: Olof Lindberg—RELATED: Grant: Stohnes Foundation,* Comments: This was a grant paid to support my research. The foundation had no influence on planning, designing, or interpreting results, as it was not involved in any aspect of the production of this manuscript.
References
- Received December 28, 2011.
- Accepted after revision February 2, 2012.
- © 2012 by American Journal of Neuroradiology
In this issue


Jump to section
Related Articles
Cited By...
- No citing articles found.