
Abstract
BACKGROUND AND PURPOSE: Automatically identifying carotid plaque composition using MR imaging remains a challenging task in vivo. The purpose of our study was to compare the detection and quantification of carotid artery atherosclerotic plaque components based on in vivo MR imaging data using manual and automated segmentation.
MATERIALS AND METHODS: Sixty patients from a multicenter study were split into a training group (20 patients) and a study group (40 patients). Each MR imaging study consisted of 4 high-resolution carotid wall sequences (T1, T2, PDw, TOF). Manual segmentation was performed by delineation of the vessel wall and different plaque components. Automated segmentation was performed in the study group by a supervised classifier trained on images from the training group of patients.
RESULTS: For the detection of plaque components, the agreement between the visual and automated analysis was moderate for calcifications (κ = 0.59, CI 95% [0.36–0.82]) and good for hemorrhage (0.65 [0.42–0.88]) and lipids (0.65 [0.03–1.27]). For quantification of plaque volumes, the intraclass correlation was high for hemorrhage (0.80 [0.54–0.92]) and fibrous tissue (0.80 [0.65–0.89]), good for lipids (0.65 [0.43–0.80]), and poor for calcifications.
CONCLUSIONS: In 40 patients with carotid stenosis, our results indicated that it was possible to automatically detect carotid plaque components with substantial or good agreement with visual identification, and that the volumes obtained manually and automatically were reasonably consistent for hemorrhage and lipids but not for calcium.
ABBREVIATIONS:
- CI
- confidence interval
- HIRISC
- High-Resolution MR Imaging of Atherosclerotic Stenosis of the Carotid Artery
- ICC
- intraclass correlation coefficient
- PDw
- proton attenuation-weighted
- TOF
- time of flight
Accurate information of atherosclerotic plaque morphology and composition is necessary to distinguish stable from unstable plaques that are likely to cause embolic events.1 The vulnerability of an atherosclerotic plaque to rupture is believed to be related to its intrinsic composition, such as the size of the lipid core and presence of intraplaque hemorrhage. In vivo multicontrast high-resolution MR imaging has emerged as a tool capable of identifying and quantifying the main components of the atherosclerotic plaque,2 including hemorrhage, calcifications, lipid core, and fibrous tissue.3,–,5 Most of the current imaging studies of atherosclerotic plaques rely on a human observer's interpretation of MR images with different contrast weightings, producing measurements that have been compared with histology assessment.6 Manual plaque segmentation requires expertise, is time consuming, and produces results that are subject to interobserver variability.7 In contrast, automated classification could yield objective and reproducible assessment of plaque composition.8,9
Promising work in this field has showed that the composition of atherosclerotic carotid plaques can be objectively determined on ex vivo MR imaging, by means of algorithmic classifiers.10 Although ex vivo validation is a critical step in the establishment and validation of algorithms, it cannot be directly extrapolated to in vivo material, given the lower image quality and motion artifacts that are inherent to MR images acquired in a clinical setting. Two pilot studies have shown the feasibility of automated plaque analysis in vivo by comparing the accuracy of the classifiers with that attained by human MR imaging readers, using histology as the standard of reference.9,11 Both studies reported encouraging results that were comparable with, or possibly more accurate than, manual analysis. However, these previous studies were based on single-center MR imaging data and relied on a small sample of selected patients with high-grade symptomatic carotid stenosis scheduled for carotid endarterectomy.
Therefore, the goal of our work was to extend these results to a larger number of patients for whom markers of plaque instability are essential for therapeutic decision, that is, patients with either symptomatic moderate stenosis or asymptomatic high grade stenosis, using MR images acquired in a multicenter setting.
Materials and Methods
Study Population
HIRISC is an ongoing multicenter prospective study assessing the prognostic value of carotid plaque vulnerability, as defined on MR imaging, for the prediction of cerebral vascular events. Patients are eligible for the study if 1) they have symptomatic stenosis (40% to 69%, according to NASCET criteria) or asymptomatic stenosis (60% NASCET or greater) of the internal carotid artery bifurcation; 2) they are not scheduled for endarterectomy within the next 6 months; and 3) they do not have any other major cause of stroke. The study was approved by the local ethics committee and all patients signed an informed consent form. From the HIRISC imaging data base, we selected 65 consecutive patients who fulfilled the following imaging criteria: of the 4 MR images available, 3 had to be excellent, and the remaining 1 at least good on a subjective 4-level image quality scale (poor, average, good, or excellent), rated by 2 independent readers. Five patients were excluded because manual registration of the 4 MR images was not possible because of severe patient motion. The remaining 60 patients were randomly split into a training group of 20 patients and a study group of 40 patients. For each patient, the carotid artery qualifying for the HIRISC study was analyzed. The training group consisted of 10 men and 10 women (mean age ± SD of 72.3 ± 12.4 years), 10 right and 10 left carotid stenoses, 11 symptomatic and 9 asymptomatic stenoses, with an overall mean 48.7 ± 13.2% NASCET degree of stenosis. The study group consisted of 27 men and 13 women (mean age 71.9 ± 10.2 years), 21 right and 19 left carotid stenoses, 25 symptomatic and 15 asymptomatic stenoses, with an overall 44.2 ± 14.8% NASCET degree of stenosis. There was no significant difference between the training group and the study group for any of these parameters (Student t test for quantitative variables, χ2 test for categoric parameters, level of significance P < .05).
MR Imaging Protocol
All patients were imaged on a 1.5-T MR unit using the same 4-channel phased-array carotid surface coil (Machnet BV, Eelde, the Netherlands). Before starting the study, the MR protocol and acquisition parameters were standardized across platforms (Philips, Siemens, GE Healthcare). A fast gradient-echo pulse sequence was used in axial, sagittal, and coronal planes as a localizer. The median sagittal image was used to plan a 2D TOF gradient-echo sequence. Twenty to 30 sections with a thickness of 4 mm were set to cover the neck area using the phased array coil. The z-axis coordinates of the qualifying carotid bifurcation on the 2D TOF images were used to position the following 4 pulse sequences: 3D TOF, T1WI, PDw, and T2WI. The field of view (130 × 130 mm) was identical for all 4 sequences. T1WI, T2WI, and PDw images were obtained with double inversion recovery (ie, black- blood) fast spin-echo sequences with electrocardiographic gating during free breathing using 8 axial sections (3-mm thick, 0.3-mm gap) centered on the qualifying carotid stenosis. PDw and T2WI parameters were as follows: repetition time 2 R-R intervals; effective echo time 16–20 ms for PDw and 50 ms for T2WI; acquisition matrix 256 × 512 (acquired in-plane resolution 508 × 508 μm, interpolated to 254 × 254 μm by zero-filling in k-space); signal intensity averaged 2; fat suppression. T1WI parameters were as follows: repetition time 1 R-R interval; echo time 9–10 ms; acquisition matrix 352 × 256 (acquired in-plane resolution 451 × 508 μm, interpolated to 254 × 254 μm by zero-filling in k-space); signal intensity averaged 3. The 3D TOF sequence used a gradient-echo pulse sequence with repetition time 30 ms; echo time 6.9 ms; flip angle 20°, acquisition matrix 288 × 224, 512 zero-filling (acquired in-plane resolution 451 × 580 μm, interpolated to 254 × 254 μm by zero-filling in k-space); signal intensity averaged 2; 20 sections of 2.2-mm thickness, 1 slab. Total acquisition time was approximately 25 minutes.
Manual Image Review
For each patient, the images from the 4 vessel wall sequences were visualized using QPlaqueMR software (Medis Medical Imaging Systems BV, Leiden, the Netherlands) and manually coregistered. Two readers, blinded to the results of the automated image analysis, examined, in consensus, all MR images of the qualifying carotid artery using a standardized form and published criteria.5,6,12 For each location, the 4 MR images (PDw, T2WI, T1WI, TOF) were reviewed together. First, the thickness of the vessel wall was reviewed. In the case of a thickened vessel wall, the inner and outer boundaries were delineated. Next, the vessel wall was segmented as fibrous tissue or as 1 of the different plaque components, namely, calcifications, hemorrhage, or lipid core. All signal intensities were compared with the adjacent sternocleidomastoid muscle. Calcifications were defined as areas of hypointensity on all 4 sequences. Recent and fresh intraplaque hemorrhages (type 1 and 2, as defined previously)3 were considered together as hyperintensities on T1WI and TOF images. Lipid-rich necrotic core and fibrous components share the same signal intensity on PDw images, that is, signal intensity isointense or slightly hyperintense compared with that of the sternocleidomastoid muscle. PDw and T2WI were compared so as to discriminate between lipids and fibrous component as follows: lipid core was identified as an area in which the signal intensity dropped on T2WI, compared with PDw images, whereas fibrous component corresponded to a relatively high signal intensity area on both sequences.
Calcifications, hemorrhages, and lipid core were considered present if they were observed on at least 1 section. Using the manual drawing features of the QPlaqueMR software, area measurements of vessel, lumen, lipids, hemorrhages, and calcifications were obtained for each location by tracing the boundaries of each component. The fibrous component area was calculated by subtracting lipid core, hemorrhage, and calcium from the plaque area. For each component, volumes per artery were calculated by multiplying the sum of areas from each cross-sectional location by the section thickness plus intersection gap.
Automated Image Analysis
A pattern recognition system, developed using PRTools13 and Matlab (2007b; MathWorks, Natick, Massachusetts), was used to automatically classify the pixels inside the vessel wall. Vessel wall pixels were defined by the manually delineated contours of the lumen and outer wall. First, the vessel wall images were normalized based on the median signal intensity within a 4 × 4-cm region of interest centered at the vessel lumen. This normalization step is required for comparing the different sequences of a single subject as well as for intersubject comparison. Then, for each pixel within the vessel wall, the following features were calculated: normalized signal intensity, zero-, first-, and second-order derivatives at multiple scales from the sequences; distance to the inner and outer wall; and local vessel wall thickness. Based on these features, a linear discriminant classifier was built for classification of each pixel as being calcium, lipid core, hemorrhage, or fibrous tissue. This supervised classifier was trained with the images and manual segmentations from the 20 patients of the training group. During the training phase, the features and their corresponding classes were used to learn statistics describing the data. Subsequently, the trained classifier was used to automatically classify the vessel wall contents of the study group of 40 patients. As in the manual analysis, the presence and volumes of plaque components were determined.
Comparison between Automated and Manual Segmentation
The 2 methods were compared on a per-patient basis. First, the presence and volumes of plaque components in each qualifying artery were determined for the whole dataset. Subsequently, the segmentation results for each patient were assessed by rating whether a plaque component was present or not. Agreement between the automated and manual analysis was assessed for the qualitative segmentation (presence or absence) of each component using the κ statistic for dichotomous data and percentage of agreement (similar to accuracy in binary classification). According to Landis and Koch,14 values of κ between 0.8 and 1 indicate almost perfect agreement; 0.6 to 0.8, substantial agreement; 0.4 to 0.6, moderate agreement; 0.2 to 0.4, fair agreement; 0.0 to 0.2, slight agreement; and −1.0 to 0.0, poor agreement.
Quantitative assessment was performed by measuring the volume for each plaque component per artery by both segmentation methods and calculating the ICC with a 2-way random effect for continuous variables. ICC values over 0.80 were considered excellent. For all agreement parameters, 95% CIs were calculated. Subsequently, scatterplots for plaque volumes in patients were generated to visually compare both methods, and the Pearson correlation coefficient was calculated. A paired Wilcoxon test was used to determine whether the automated and manual analysis method produced different volumes for each plaque component. A P value ≤.05 was considered significant. Bland-Altman analysis15 was also used to assess any size-dependent bias in the measurements between methods, limits of agreement, and proportional errors.
Results
Of the 344 sections available in the study group (mean 8.6 per patient), 137 included a thickened wall with atherosclerotic material, according to the visual analysis. Of the 207 remaining sections, only 2 were positive for lipid core with the automated analysis (1.0 and 0.76 mm3, respectively) and 1 was positive for hemorrhage (2.97 mm3).
Qualitative Analysis
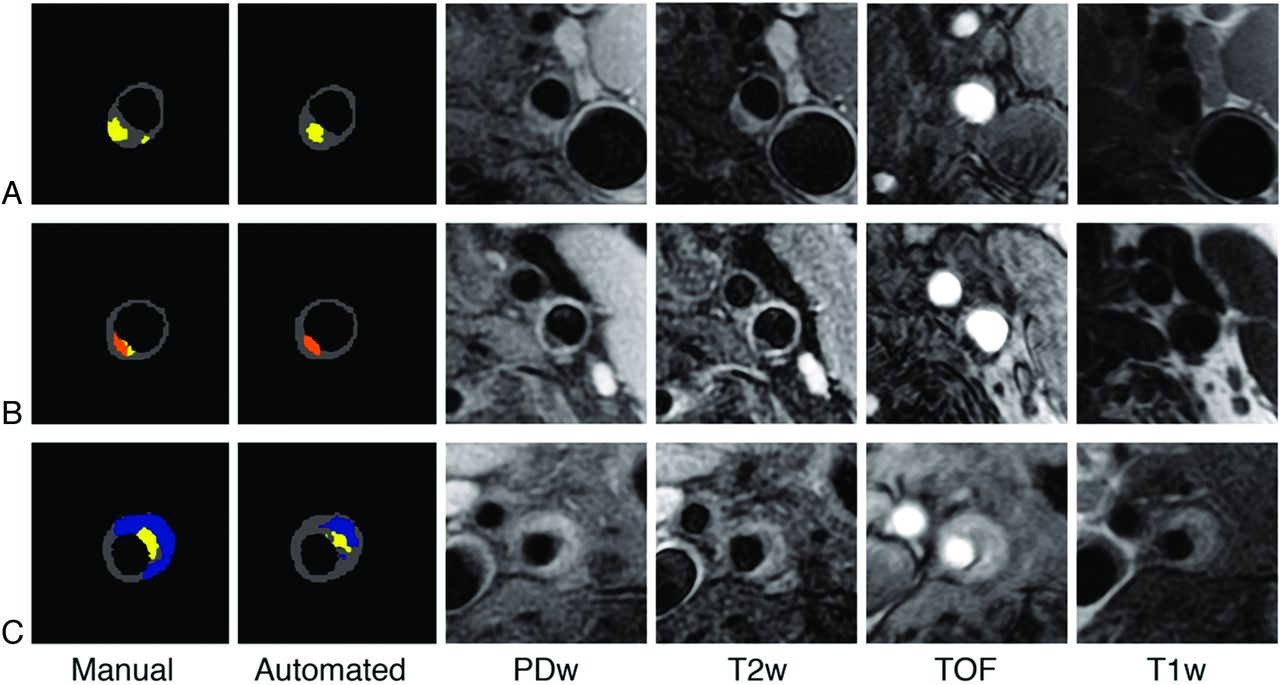
In the training set of 20 patients, calcium was visually present in 10 cases hemorrhage in 7 cases, while lipids and fibrous tissue were observed in all 20 cases. There were no significant differences in the prevalence of visual detection of each component between the training set and the study group (P = .65 for calcium, P = .12 for hemorrhage, P = .31 for lipids). In the 40 patients of the study group (Fig 1), calcium was detected by both methods in 13 patients, hemorrhage in 18 patients, and lipids in all except 2 patients (Table 1). The percentage of agreement for calcium and hemorrhage was 80% or higher. The κ values for calcification and hemorrhage indicated moderate and substantial agreement. For identification of lipids, the agreement was almost perfect (97.5%), but because this component was present in almost all plaques, the κ agreement was only substantial (κ = 0.65 [0.03–1.27]).

Three illustrative examples of manual and automated segmentation. A, Lipid core (yellow) corresponds to an area in which the signal intensity dropped on T2WI compared with PDw images. B, Calcifications (orange) correspond to an area of hypointensity on all 4 sequences. C, Recent hemorrhage (blue) corresponds to an area of hyperintensities on T1WI and TOF images. Note that the automated classifier underestimated the hemorrhage area.
Percentage of agreement and κ statistic of the plaque components per patient (n = 40)
Quantitative Analysis
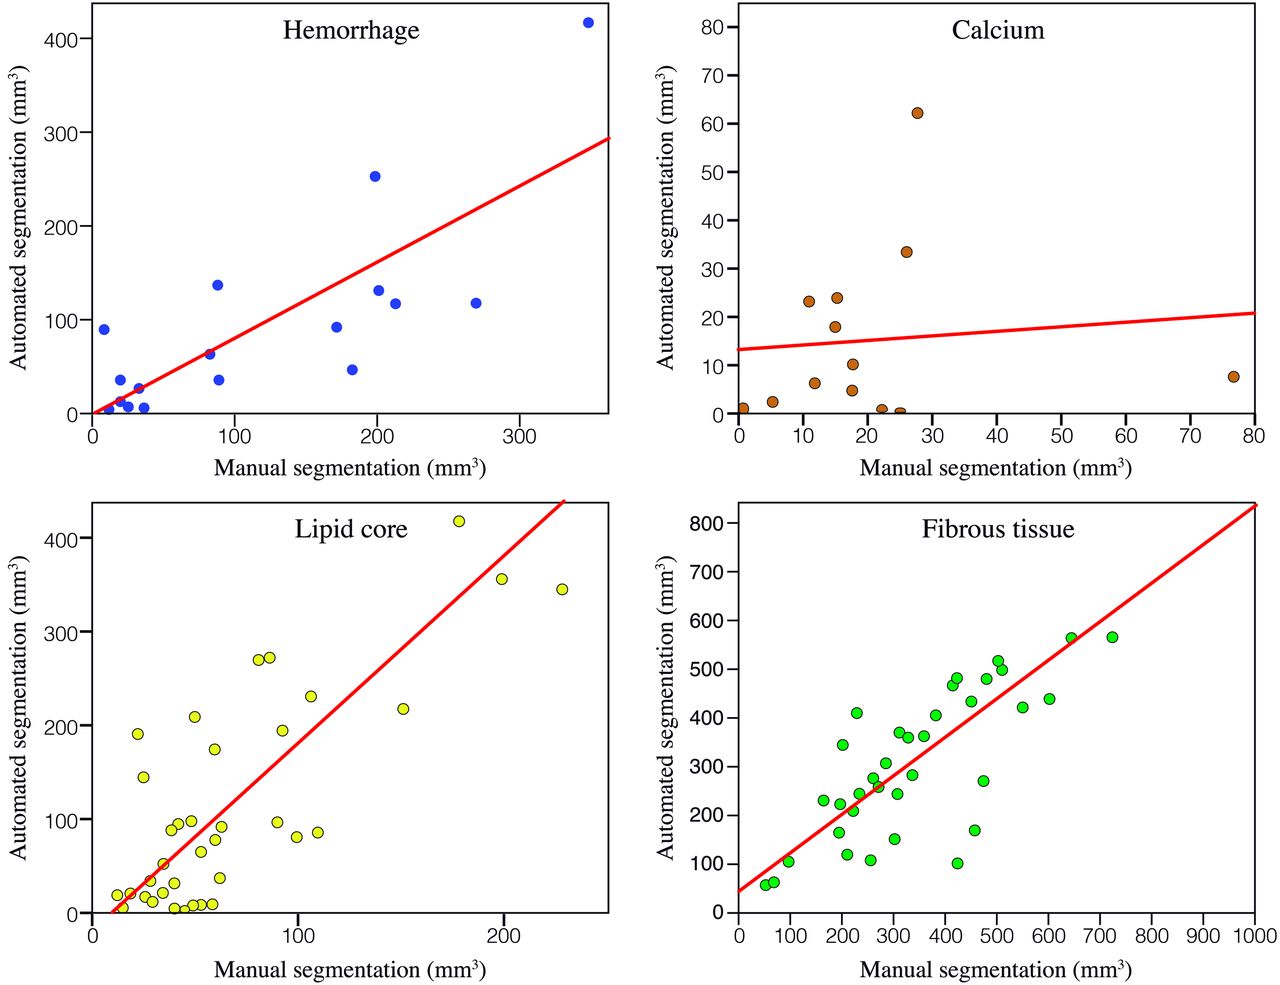
The ICC (95% CI) between volumes obtained by the 2 methods was poor for calcifications (0.10 [−0.45–0.60]), excellent for hemorrhage (0.80 [0.54–0.92]), and good for lipids (0.65 [0.43–0.80]). As shown in Fig 2, the correlation between volumes was stronger for lipids (r = 0.88, P < .01) than for fibrous tissue (r = 0.80, P < .01) and hemorrhage (r = 0.80, P < .01). For calcifications, the linear correlation coefficient was close to zero (r = 0.1, not significant). As shown in Table 2, the automated approach overestimated the volume of lipids (P = .01). For small volumes of lipids, the Bland-Altman plot showed good agreement between the 2 methods (Fig 3). Conversely, for plaques with large volumes of lipids (>100 mm3), the plot indicated a clear overestimation of lipid volumes by automated segmentation compared with manual segmentation. These plaques, in which the automated segmentation overestimated the lipid volumes, were subsequently analyzed visually. They corresponded to carotid arteries curving horizontally after the bifurcation so that the imaging plane was not perpendicular to the arterial wall. This resulted in partial volume effects in the images as well as differences in lumen shape between the MR images, causing low pixel correspondence between the 4 MR images and resulting in classification errors. There were no statistical differences between volumes obtained by the 2 methods for the fibrous component or hemorrhage. For the other plaque components, the Bland-Altman plots did not show any obvious bias according to the size of these components, though differences existed between volumes obtained by the 2 methods.

Graphs showing scatterplots of the volumes measured with the manual and automated methods for each component. Each dot corresponds to 1 patient.
Volume of plaque components

Bland-Altman graphics showing the differences between volumes obtained by manual and automated segmentation plotted against the mean of the 2 measurements. Volumes per patient are expressed in mm3. The dotted lines indicate the average bias and the dashed lines show the 95% CI (mean bias ± 1.96 SD). For each component, a negative bias indicates that the automated segmentation overestimates the volumes. A positive bias indicates that the automated segmentation underestimates the volumes.
Discussion
The purpose of this study was to evaluate the efficacy of automated plaque segmentation for quantifying the main plaque tissue types in carotid arteries on the basis of multicontrast MR imaging. In a population of 40 patients with carotid atherosclerosis and high-resolution MR images acquired in a multicenter setting, our results indicated that 1) it was possible to automatically detect carotid plaque components with substantial or good agreement with visual identification, and 2) the volumes of plaque components obtained manually and automatically were reasonably consistent for hemorrhage and lipids but not for calcium.
Replacing subjective, time-consuming manual segmentation with an automated segmentation alternative has been a long-time goal. Two studies have tested the possibilities of using supervised classifiers in vivo compared with histology9,11 and showed encouraging results. In both studies, the algorithm was trained on a small set of patients and then tested on a group of 12 or 13 patients. Both suggested the benefits of supervised classifier algorithms for the detection and the quantification of plaque components. It was even suggested that this approach might be more accurate than manual review of high-resolution MR images for some of the components. All ex vivo studies and the 2 in vivo studies have focused on patients scheduled for endarterectomy. Our study focused on a different population, composed of patients with moderate symptomatic or severe asymptomatic stenosis and not scheduled for endarterectomy. In this population, the benefit of endarterectomy is still controversial and much is to be expected from markers of plaque instability.16 To extend the findings of previous “pilot” in vivo studies, a larger group of 60 patients was included. Furthermore, these patients were part of a multicenter MR cohort and this should strengthen the generalization of our findings.
Identification of Plaque Components
Agreement (and κ coefficients) between the manual and automated segmentation method for the detection of calcification, hemorrhage, and lipid core was good and within the range of interobserver variability observed in a previous study dealing with visual analysis on a similar population.7 The good results observed for hemorrhage can be explained by the high contrast presented by this component on the 4 MR images and by the fact that recent hemorrhage strongly differs from that of other plaque components, especially on T1WI and TOF sequences. This also explains the high sensitivity of the visual detection of hemorrhage on high-resolution MR images compared with histology reported by others.10,17 Visual detection of lipid components is based on the comparison of 4 MR images, to eliminate calcification and hemorrhage, and subsequently on a signal intensity loss between PDw and T2WI.12 This stepwise analysis accounts for the difficulties encountered in both visual and automated analysis. However, the percentage of agreement between the 2 methods for lipids was almost perfect, and the lower κ value can be explained by the high prevalence of this plaque component.18 Lipid core was detected in almost all the patients by both the automated and manual segmentation methods. Histologic and MR studies have also reported a high prevalence of lipid core, seen in up to two-thirds of plaques.6,7
Identifying calcifications using MR imaging is still a difficult task. It relies on differences in magnetic susceptibility between the mineral components and neighboring soft tissues. 3D gradient-echo TOF sequences are theoretically the most sensitive, but they are more affected by artifacts compared with other types of sequences.7 Moreover, on 3D TOF sequences, calcifications adjacent to the lumen are difficult to separate from other plaque components, such as the fibrous cap, because they share the same signal intensity characteristics.7,19 However, these issues affect both manual and automated methods, which could explain why agreement remained reasonable in line with another group.8 Finally, these difficulties may not in fact hamper the prediction of vascular risk, because the prognostic value of calcifications for embolic risk is still debated.20
Quantification of Plaque Components
Agreement between the automated and manual segmentation methods was high for the quantification of lipid core and hemorrhage and low for calcification, as indicated by the ICC. The same trend appeared when we calculated the Pearson correlation coefficients for the volumes of each component. These correlations lie within the range of previously published values obtained by the only group that distinguished the lipid core from recent hemorrhage.9 Another group chose to define necrotic core as regions of lipids and intraplaque hemorrhage, and consequently only provided global results.11 The correlations also compare favorably with results obtained visually by 2 observers. However, the Bland-Altman analysis showed that there is still a considerable discrepancy between the manual and automated outlining. Hofman et al observed that the human eye underestimated the size of hemorrhage and overestimated the size of lipids.9 This might explain, in part, the discrepancies between our automated and manual segmentations. The Bland-Altman plots additionally showed that the consistency between measurements decreases for plaques with a large lipid core. Large discrepancies were explained by low pixel correspondence between the different sequences, causing errors in the automated classification in patients with a horizontal carotid artery.
Whether calcifications, displayed as a signal intensity loss, should be measured on MR imaging is controversial.21 Even though our measurements may not be very accurate, the error theoretically applies to both segmentation methods. It does not explain the poor agreement observed between measurements obtained by the 2 methods. In line with this, another group reported a low correlation between manual segmentation and various classifiers, as well as a poor correlation with histology.9 This may be related to poor performance of the supervised classifier. Performance of a supervised classifier is highly dependent on the training set. The training set should contain sufficient representative examples of each plaque component. The frequency of calcified plaques and volume of calcifications in the data we used were small compared with the other 2 components, explaining, at least in part, the low performance. Indeed, better results were reported in a study with higher frequency of calcified plaques in the training set.8 The use of the postcontrast T1WI sequence may also improve calcium detection.11
Limitations
Our study has a number of limitations. First, it lacks an ex vivo reference standard to determine absolute accuracy. Even though we found good agreement between the 2 methods, we cannot rule out the possibility that both methods misinterpreted the images. We did, however, use a well-documented manual image review procedure that has been extensively validated against ex vivo references.6,22 Second, like others,9,11 we selected MR examinations with good quality images among a larger imaging data base. The results probably depend on image quality and cannot be extrapolated to all high-resolution MR imaging of human carotid plaques, irrespective of the image quality. Third, the classifier was trained on a limited training set of 20 patients. The results would potentially have been better with a larger training set, including more samples of hemorrhage and calcifications. Fourth, given the low interobserver reproducibility for fibrous cap characterization, previously reported on a similar set of images,7 we chose to exclude automated characterization of the fibrous cap (thick, thin, or ruptured), which is a marker of plaque instability. In our opinion, this goal requires an improvement of the image quality in terms of spatial resolution and contrast. For instance, gadolinium injection could help distinguish between lipid core and fibrous cap.11,22 Fifth, we considered fresh (type 1) and recent (type 2) hemorrhage together, given the low prevalence of type 1 hemorrhage17 and the previously reported moderate agreement between automated and manual segmentations for the identification of these hemorrhage subtypes.8
Finally, the automated method we used represents one of 4 basic steps in carotid plaque analysis: lumen boundary detection, outer wall boundary detection, multicontrast registration, and plaque segmentation. We have addressed the final step, which is the most critical for automation. Automated methods for the remaining steps have previously been reported.23,24
Conclusions
Once automated methods for atherosclerotic plaque segmentation, such as the one presented here, have been fully validated, a considerable gain in processing time can be expected, together with elimination of interobserver variability. Automated analysis could become a clinical tool for the pretherapeutic assessment of atherosclerotic carotid artery stenoses and, further, could be integrated in longitudinal or transversal studies of large populations. By providing quantitative measurements of lipids and hemorrhage, automated methods could improve the reliability of quantitative markers for plaque instability and ease their use as criteria for assessing the efficacy of treatments stabilizing atherosclerotic plaque.
Acknowledgments
We thank Fatiha Boumaza, Isabelle Laurent, Isabelle Chalmette, all radiographers and collaborators of the Unité de Recherche Clinique, Cochin Port-Royal, Paris. We also thank M. Adame for useful discussions.
Appendix
List of Investigators of the HIRISC Study
Paris (Sainte-Anne Hospital, Pôle Raymond Garcin and Unité INSERM UMR S894, Université Paris Descartes): D. Calvet, G. Turc, V. Domigo, C. Lamy, E. Touzé, J.L. Mas (neurologists), O. Naggara, C. Oppenheim, J.F. Meder (radiologists); Nancy: J.C. Lacour, X. Ducrocq (neurologists), E. Schmitt, S. Bracard (radiologists); Paris, (Pitié-Salpêtrière): S. Crozier, Y. Samson (neurologists), F. Bonneville, D. Dormont (radiologists); Poitiers: C. Paquet, G. Godenèche, J.P. Neau (neurologists), P. Vandermarck (radiologist); Lille: H. Hénon, C. Lefebvre, C. Lucas, D. Leys (neurologists), J.Y. Gauvrit, R. Henda, X. Leclerc, J.P. Pruvo (radiologists); Rouen: A. Triquenot-Bagan, E. Guégan-Massardier, B. Mihout (neurologists), F. Douvrin, E. Gérardin, J. Thiébot (radiologists); Compiègne: T. Hussein, R. Roos-Weill (neurologists), J.M. Coulet (radiologist); Montpellier: C. Arquizan (neurologist), A. Bonafé (radiologist), E. Le Bars (engineer).
Footnotes
Disclosures: Rob van der Geest—UNRELATED: Consultancy: Medis Medical Imaging Systems; Royalties: Medis Medical Imaging Systems.* Supported by a grant from the Programme Hospitalier de Recherche Clinique of the French Ministry of Health (No. AOR 02 009), a grant from the Institut de l'Athérothrombose (Sanofi-Aventis & Bristol-Myers-Squibb Pharmaceuticals), and a grant from the Société Française de Neurologie. (*Money paid to institution)
References
- Received September 25, 2011.
- Accepted after revision December 5, 2011.
- © 2012 by American Journal of Neuroradiology


