
Abstract
BACKGROUND AND PURPOSE: Detecting incidence and enlargement of lesions is essential in monitoring the progression of MS. In clinical trials, lesion load is observed by manually segmenting and comparing serial MR images, which is time consuming, costly, and prone to inter- and intraobserver variability. Subtracting images from consecutive time points nulls stable lesions, leaving only new lesion activity. We propose SuBLIME, an automated method for segmenting incident lesion voxels.
MATERIALS AND METHODS: We used logistic regression models incorporating multiple MR imaging sequences and subtraction images from consecutive longitudinal studies to estimate voxel-level probabilities of lesion incidence. We used T1-weighted, T2-weighted, FLAIR, and PD volumes from a total of 110 MR imaging studies from 10 subjects.
RESULTS: To assess the performance of the model, we assigned 5 subjects to a training set and the remaining 5 to a validation set. With SuBLIME, lesion incidence is detected and delineated in the validation set with an AUC of 99% (95% CI [97%, 100%]) at the voxel level.
CONCLUSIONS: This fully automated and computationally fast method allows sensitive and specific detection of lesion incidence that can be applied to large collections of images. Using the explicit form of the statistical model, SuBLIME can easily be adapted to cases when more or fewer imaging sequences are available.
ABBREVIATIONS:
- AUC
- area under ROC curve
- IQR
- interquartile range
- NAWM
- normal appearing white matter
- PD
- proton attenuation
- ROC
- receiver operating characteristic
- SuBLIME
- Subtraction-Based Logistic Inference for Modeling and Estimation
MS is an inflammatory disease of the central nervous system characterized by brain and spinal cord lesions. Although lesions in the gray matter of the brain are common, lesions are more readily recognized in the white matter.1 MR imaging of the brain is used to detect lesions in MS and is essential in monitoring disease progression. In addition to documenting disease effects at one time, MR imaging can be used to assess longitudinal changes.2 MR imaging observation of lesion volume change resulting from the development of new lesions, enlarging lesions, and resolving lesions is an important marker of disease progression and response to therapy.3 Lesion volume change is a common outcome in clinical trials and is computed by comparing manual segmentations of serial MR imaging examinations,4 which is time-consuming, costly, and subject to inter- and intraobserver variability. In addition, quantifying lesion change is challenging because incident and enlarging lesions represent only a small proportion of all lesions, typically on the order of 5–10%.5 Therefore, a method that can automatically and accurately segment lesions to assess change is desirable.
Lladó et al6 provide a comprehensive review of the current methods of lesion change segmentation by dividing them into 2 groups: intensity-based and deformation-based. Intensity-based methods use voxel-level comparisons of intensities to identify lesion change. These methods are further categorized into deterministic, statistical, and temporal analysis methods. Deformation-based methods rely on observing the changes in tissue surrounding lesions due to lesion expansion or contraction.
Deterministic methods are defined as segmentations of subtraction images.6 Images from consecutive studies can be registered, normalized, and then subtracted to isolate areas of lesion change and cancel radiologically stable disease-related measurements. Manually segmented 2D T2-weighted subtraction images identify a higher number of active lesions, with greater inter- and intraobserver agreement5,7 than comparing independently segmented serial images. Subtraction images created from 3D imaging acquisitions have been shown to be less susceptible to artifacts than 2D subtraction images.8 To our knowledge, no manual or automated method for combining information from multiple types of MR imaging subtraction images has been developed.
Current statistical methods detect changes in the brain between 2 MR imaging studies but do not provide fully automated segmentations of lesion change.6 Volumes from 2 time points are registered, and statistical models classify voxels as no signal change, signal increase, signal decrease, and outside of the brain.9 Higher lesion activity detection probabilities have been obtained by extending this method to the use of multisequence imaging data,10 but clusters of highly likely lesion change voxels must be reviewed by an expert to produce lesion change segmentations.
Temporal analysis approaches are based upon voxel level time-series.6 Longitudinal collections of images for a subject are registered, and voxel intensities are analyzed as a function of time. Lesions and other tissue classes of the brain can be segmented from these time-series,11,12 but these methods require more than 2 MR imaging studies for each subject.
In contrast to intensity-based methods, deformation field-based approaches observe the modification of the tissue surrounding lesions.6 Volumes from 2 time points are registered, and structural changes in the brain are determined by the local deformation of voxels.13,14 While these methods have been shown to perform better than intensity-based methods for the segmentation of lesions, they require a region of interest to be manually selected before the analysis.
There is currently no fully automated method that produces segmentations of incident lesions and lesion enlargement using information from only 2 MR imaging studies. We therefore propose SuBLIME, a fully automated and computationally fast method for segmenting voxel-level lesion incidence between 2 MR imaging studies. Using a logistic regression model with various MR imaging sequences from consecutive studies, we estimate the probability of lesion incidence in each voxel. The model utilizes information from the FLAIR, PD, T2-weighted, and T1-weighted volumes, as well as corresponding subtraction images, to produce interpretable results in the form of regression coefficients that can be applied to new pairs of images quickly and easily.
To show how multisequence image information improves lesion incidence and enlargement detection, while also being robust to artifacts, we compare the full SuBLIME model to a nested model fit with only the T2-weighted image. We also compare both models to a population-level threshold of the T2-weighted subtraction image to show that the SuBLIME model framework improves performance.
Materials and Methods
Study Population
A total of 110 MR imaging studies (11 longitudinal studies each of 10 subjects) were analyzed. All participants gave written consent and were scanned as part of an institutional review board–approved natural history protocol. To assess the performance of the model, we randomly assigned 5 subjects (55 studies) to a set for model training and used the remaining 5 subjects (55 studies) for validation of our model. Demographic, diagnosis, and treatment information for the training and validation subjects can be found in Table 1. The mean time between scans in the training set was 130 days and the median was 35 days. The mean time between scans in the validation set was 88 days and the median was 34 days.
Subject demographic, diagnosis, and treatment information
Experimental Methods
We acquired whole-brain 2D FLAIR, PD, T2-weighted, and 3D T1-weighted volumes in a 1.5T MR imaging scanner (Signa Excite HDxt; GE Healthcare, Milwaukee, Wisconsin) using the body coil for transmission. For signal detection, we used a volume head coil for 107 of the studies and an 8-channel receive coil (Invivo, Gainesville, Florida) in the remaining 3 studies. The 2D FLAIR, PD, and T2-weighted volumes were acquired using spin-echo sequences and the 3D T1-weighted volume using a gradient-echo sequence. The PD and T2-weighted volumes were acquired as short and long echoes from the same sequence. We used various scanning parameters for the different studies. The ranges for the flip angle, repetition time, echo time, and inversion time can be found in Table 2.
Study scanning parameters
Image Postprocessing
For initial image processing, we used Medical Image Processing Analysis and Visualization (http://mipav.cit.nih.gov) and Java Image Science Toolkit (http://www.nitrc.org/projects/jist/).15 We interpolated all images for each subject to a voxel size of 1 mm3 and rigidly aligned all of the T1-weighted volume to the Montreal Neurological Institute standard space. We then took the average of the T1-weighted volume for all the studies for each subject and registered the longitudinal collection of the T1-weighted, T2-weighted, FLAIR, and PD images for the subject to this average image. We removed extracerebral voxels using a skull-stripping procedure.16 We automatically segmented the entire brain and the NAWM using the T1-weighted and FLAIR images.17
Criterion Standard Measure
To fit the model and to measure performance, we required a set of data in which the outcome is assessed by using a criterion standard measure. The criterion standard was obtained using manual segmentation by an experienced neuroradiologist, who evaluated consecutive T2-weighted and FLAIR images and the T2-weighted subtraction image. For each study, we segmented 5 representative axial sections of the brain: sections 50 (through the inferior temporal lobes, pons, and cerebellum), 70 (including the midbrain and occipital lobes), 90 (through the internal capsules), 110 (through the centrum semiovale), and 130 (near the vertex). Only voxels with new lesion activity were segmented; voxels containing existing lesions were not segmented. In total, there were 500 segmented sections, with 23 sections containing lesions. There were a total of 55 incident or enlarging lesions, with 26 in the training set and 29 in the validation set. The neuroradiologist only segmented changes between consecutive studies; in our analysis, we also only focus on incidence between consecutive studies.
Normalization
We performed all statistical modeling in the R environment (version 2.12.0; R Foundation for Statistical Computing, Vienna, Austria) with the packages AnalyzeFMRI,18 biglm,19 ff,20 and ROCR.21 We used intensities from the FLAIR, PD, T2-weighted, and T1-weighted volumes to identify new lesions and enlargement of previously existing lesions. We denote the observed intensity of voxel v, for subject i, from MR imaging study conducted at time tj by
 where M indicates the imaging sequence.
Analyzing images across study visits requires that the images be normalized so that voxel intensities have common interpretations. The normalization must allow for comparison of studies within and between subjects. Our aim was to segment incident lesions, which occur predominantly in the white matter; therefore, intensities from each study are expressed as a departure from the subject's NAWM mean in each imaging sequence22:
 where μi,M0(tj) and σi,M0(tj) are the mean and standard deviation of the observed voxel intensities in the NAWM of subject i, from sequence M, conducted at time tj. The NAWM segmentations were developed using the high-resolution T1-weighted and FLAIR images.17 SuBLIME can use any NAWM segmentation approach and is not sensitive to the choice of segmentation algorithm.
Subtraction Images
We calculated subtraction images for each sequence by subtracting normalized images from consecutive MR imaging studies. We denote the subtraction image intensity at voxel v for study tj by
 where i is the subject and M is the imaging sequence. Misregistration, partial volume effects, and low signal-to-noise ratios can cause artifacts and noise in subtraction images2; our approach avoids these pitfalls by carefully integrating population-level normalization with robustly tuned statistical prediction algorithms.
Subtraction-Based Logistic Inference for Modeling and Estimation
SuBLIME uses logistic regression to model the probability that a voxel is part of an incident or enlarging lesion. We model lesion incidence at the voxel level using FLAIR, PD, T2-weighted, and T1-weighted intensities from the current study; the subtraction image intensities for each of these sequences; the time between the consecutive studies; and the interactions between the subtraction image intensities and the time between consecutive studies. The result of our model is a collection of coefficients that can be used to create 3D maps of the probabilities of lesion incidence. A flow chart describing the SuBLIME method can be found in the On-line Appendix.
The first step of this procedure is to isolate candidate voxels that are likely to be part of incident or enlarging lesions. As changes in lesion behavior are evident on T2-weighted subtraction images, we apply the logistic regression model only to voxels that are hyperintense on these images. To avoid isolated voxels that have high T2-weighted subtraction values as a result of noise, we smooth the subtraction image by using a Gaussian kernel with a window size of 5 mm. Then, we include only voxels that have T2-weighted subtraction values larger than 1 standard deviation of the subtraction intensities calculated across the image. We chose the threshold of 1 standard deviation on the T2-weighted subtraction image empirically and found it to be liberal in capturing changes in lesions. Of the 1026 neuroradiologist-segmented lesion voxels in the training set, the voxel selection mask excluded only 45, or 4%. At least 1 voxel from every lesion was included in the candidate voxels. The 45 missing voxels were found in the voxel selection masks for 4 studies from 3 of the subjects in the training set. The missed voxels were evenly distributed among the sections with lesion incidence. On average, for each pair of consecutive studies in the training set, 14,311 (IQR: 9965; 17,638) voxels were included as candidate voxels in the 5 representative sections of the brain. The average number of voxels in the brain from the 5 sections of the subjects in the training set is 59,116 (IQR: 56,269; 61,238). As the voxel selection procedure only excludes 4% of active lesion voxels, it has a negligible impact on sensitivity, but it greatly improves specificity by eliminating more than 75% of the candidate voxels for active lesions. The voxel selection mask is illustrated in Fig 1; Fig 1A shows the radiologist segmentation of an axial section of the brain, and Fig 1B shows the candidate voxels for the same section that will be used in the logistic modeling described here.

Areas with lesion incidence are indicated with red boxes. A, Neuroradiologist manual segmentation of an axial section of the brain. B, Selected voxels for SuBLIME modeling. C, Axial section of the probability map from the full model. D, Axial section of the probability map from the SuBLIME model fit with only the T2-weighted image. E, Binary segmentation of the probability map from the full model with false-positive rate of 0.01 overlaid on the FLAIR image. F, Binary segmentation of the probability map from the full model with false-positive rate of 0.001 overlaid on the FLAIR image.
We then fit a voxel-level logistic regression model for lesion incidence over these candidate voxels, denoting the voxel-level lesion incidence by the random variable W:
 We model the probability that a voxel is part of a lesion incidence using the logistic regression model:

 where Δt is the time in days between consecutive studies. Note, however, that SuBLIME is a general logistic procedure encompassing a large number of logistic regression models. Here we use the specific model (1) because it performs very well in our application. The estimated coefficients from the full model and the nested model with only the T2-weighted image, based on all of the 10 subjects, are given in the On-line Appendix. To account for the correlation in patients over time, we nonparametrically bootstrapped (with replacement) the subjects for the training and validation set to allow for estimation of the confidence intervals for the regression coefficients. An interpretation of the coefficients is also provided in the On-line Appendix.
After we fit the model, we use the estimated coefficients to create maps of the estimated probability of lesion incidence at each voxel. To incorporate spatial information of the neighboring voxels and reduce noise, we smoothed the estimated probabilities from the model using a Gaussian kernel with window size of 3 mm. This kernel size was empirically chosen and found to perform well.
Results
Axial sections from normalized FLAIR, PD, T2-weighted, and T1-weighted volumes from 2 consecutive studies, and the subtraction images of the 2 studies for each sequence for a subject in the validation set, are shown in the On-line Appendix. Lesions are characterized by hyperintensities in FLAIR, PD, and T2-weighted images, and hypointensities in T1-weighted images, though not all lesions appear on T1-weighted images. Lesion incidence is characterized by hyperintensities in FLAIR, PD, and T2-weighted subtraction images and by hypointensities in T1-weighted subtraction images. For the same subject and study, an axial section of the smoothed probability map of lesion incidence from the full SuBLIME model is shown in Fig 1C. Fig 1D shows the same section for a model fit with only the T2 image. Red indicates areas with the higher probability of lesion incidence, and blue indicates areas with lower probabilities of lesion incidence. An axial section of the probability map from the full model for another subject from the validation set is shown in the On-line Appendix. The corresponding axial section of the normalized FLAIR, PD, T2-weighted, and T1-weighted volumes from the 2 consecutive studies and the subtraction images are also shown.
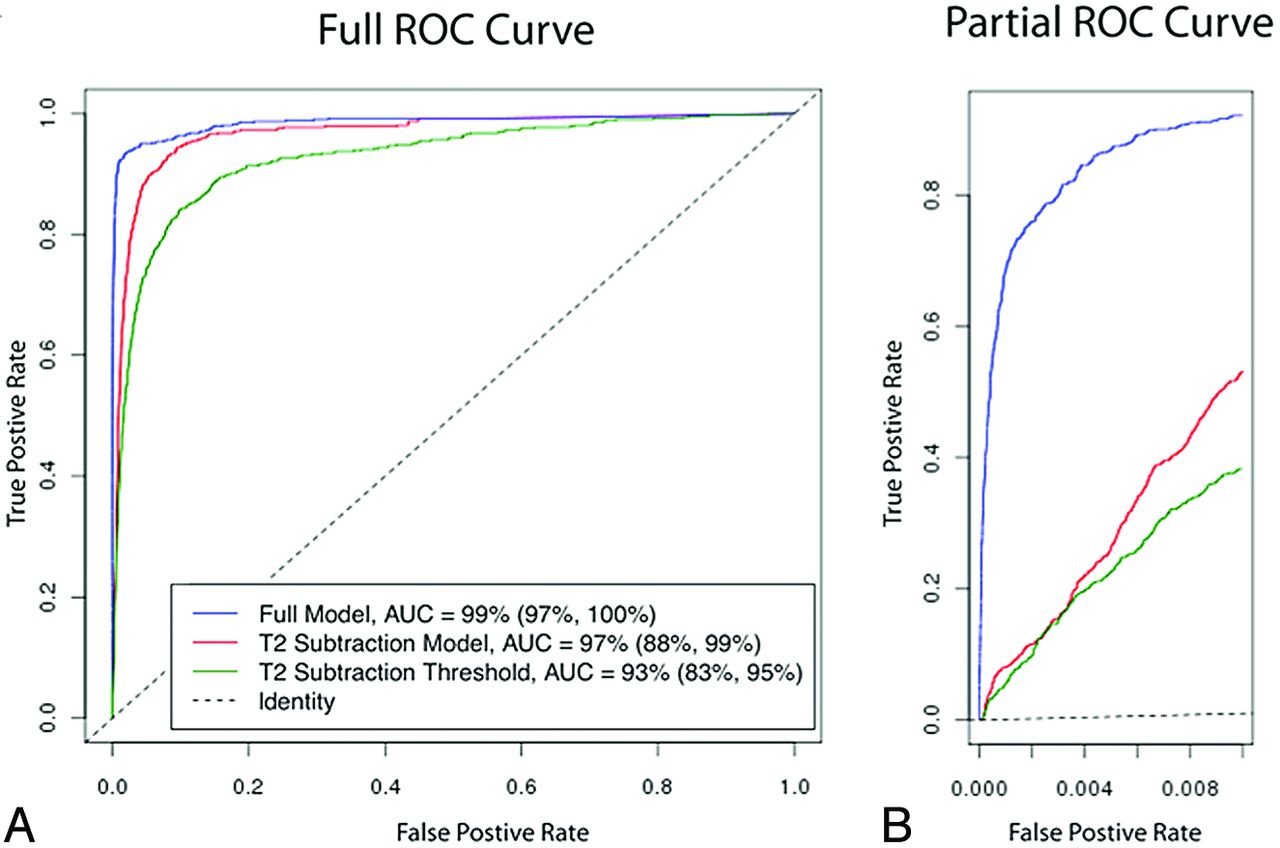
In the Study Population section, we discussed assessing the performance of the model by randomly assigning 5 subjects to the training set and the remaining 5 subjects to a validation set. The voxel-level ROC curves for the subjects in the validation set are shown in Fig 2A. We optimized the voxel selection procedure and fit the model (1) on the training set. We only used studies from the validation set to estimate the voxel-level ROC curve and AUC. The vertical axis of the ROC curve shows the true-positive rate (sensitivity) for a given threshold on the probability map, and the horizontal axis shows the false-positive rate (1 − specificity) for this threshold. These performance measures are known to be susceptible to instability. To account for this instability, as well as the correlation in subjects over time, we nonparametrically bootstrapped (without replacement) the training and validation sets. This procedure allowed the estimation of confidence intervals for the AUC. The blue curve is the ROC curve for the full model with an estimated AUC of 99% (95% CI [97%, 100%]). The red curve is the ROC curve for the model fit with only the T2-weighted image with an estimated AUC of 97% (95% CI [88%, 99%]). The green curve is the ROC curve for the population level threshold of the T2-weighted subtraction image with an estimated AUC of 92% (95% CI [83%, 95%]).

A, ROC curves for the voxel-level detection of incident and enlarging lesions for different thresholds of the probability maps produced from SuBLIME, as well as different thresholds of the T2-weighted subtraction without the model and voxel selection procedure. The red ROC curve is for the full model and has an AUC of 99% (95% CI [97%, 100%]). The blue ROC curve is for the model fit with only the T2-weighted image and has an AUC of 97% (95% CI [88%, 99%]). The green ROC curve is for thresholding the T2-weighted subtraction image without the model and voxel selection procedure and has an AUC of 92% (95% CI [83%, 95%]). B, Partial ROC curves for false-positive rates up to 0.01. The red curve is for the full model and the blue curve is for the model fit with only the T2-weighted image. The green curve is for thresholding the T2-weighted subtraction image without the model and voxel selection procedure.
The AUC calculated over the entire ROC space shown in Fig 2A is not optimal for the evaluation of the performance of an algorithm designed to detect lesion incidence. This full AUC summarizes test performance over regions of the ROC space that are not clinically relevant. The subset of lesions showing change usually consists of a small fraction of all lesions in the brain and an even smaller fraction of the entire brain. The average number of voxels in the entire brain among the validation set is 1,277,736 (IQR: 1,204,162; 1,364,908). For the entire brain, a false-positive rate of 0.01 would correspond to a volume of 12,800 mm3 of healthy brain being falsely identified as lesion, making the resulting prediction maps difficult to interpret and clinically unacceptable. Thus, the performance of SuBLIME should only be evaluated for very small false-positive rates; large false-positive rates are not clinically relevant. Fig 2B shows the partial ROC curve for false-positive rates up to 0.01. The blue curve corresponds to the full model (1), the red curve corresponds to the model fit with only the T2-subtraction image, and the green curve corresponds to the population level threshold of the T2-weighted subtraction image. The full model has a higher true-positive rate for these relevant small false-positive rates, which further emphasizes the importance of using the various imaging sequences in addition to the T2-weighted images. We have also provided the partial ROC curves for the nested SuBLIME models fit with only 3 imaging sequences in the On-line Appendix.
The probability maps can be cut at desired false-positive rates to create binary segmentations of lesion incidence. Table 3 shows the threshold values, specificity, and sensitivity for 4 different false-positive rates in the validation set. To put this into context, we have also provided the volume of lesion incidence that was segmented at each threshold value. The true lesion volume change from the neuroradiologist's manual segmentation was 625 mm3. Fig 1E shows a binary segmentation of a section for a false-positive rate of 0.01, and Fig 1F shows a binary segmentation with a false-positive rate of 0.001. The section with false-positive rate 0.01 contains many false-positive lesions, while the false-positive rate of 0.001 provides a more accurate segmentation of the section. Choosing threshold values is a trade-off between sensitivity and specificity. SuBLIME is flexible, and the appropriate false-positive rate may be selected for a particular application.
Binary segmentations
Discussion
Lesion volume change is frequently an outcome in clinical trials for patients with MS and is traditionally assessed by manually segmenting consecutive MRI. In a clinical trial setting, SuBLIME may be used to replace or assist manual segmentation of incident and enlarging lesions to reduce costs. After training, our fully automatic method does not require human input and avoids the variability introduced by manual segmentation. Training is necessary for each new dataset, but can be fairly limited, as in the example from this paper.
In contrast to many automatic segmentation techniques, SuBLIME is computationally fast. Training the model on 5 sections from 110 images takes less than an hour on a standard workstation. This process is only conducted once after collecting a dataset that combines images from multiple protocols, and the results may be summarized as the 14 coefficients in the model (1). Using this fitted model to generate a probability map of the entire brain from a set of new images takes only seconds using a standard workstation. For this analysis, we trained and validated the model on 5 representative sections of the brain. Confirmatory analyses that train and validate on segmentations of the entire brain are indicated for further understanding of the performance of SuBLIME.
Because SuBLIME is fit voxelwise, it is sensitive to major misregistration within a study and between longitudinal studies for the same subject. However, SuBLIME is robust to minor errors in registration. By simultaneously comparing data from multiple sequences and only considering candidate voxels, SuBLIME distinguishes between artifacts and lesion incidence. We suspect SuBLIME may also be sensitive to the radiologist's manual segmentation. In this analysis, we used a single expert segmentation of the sections. Future studies will compare the SuBLIME segmentations to additional manual segmentations to investigate the influence of interrater variability.
SuBLIME uses a voxel-level model for assessing the outcome. The assumption of independence between voxels is imperfect, as lesions consist of clusters of voxels. In this work, we use smoothing of the T2-weighted subtraction image in candidate voxel selection, followed by a second smoothing of the predicted probabilities of the model to incorporate the spatial nature of the data. Nevertheless, further incorporation of neighboring voxel information is warranted.
For this analysis, we decided to use a group of patients with early relapsing disease because new lesion activity is more common in this group. In the future, we plan to apply SuBLIME to a larger group of patients with a wide spectrum of disease activity and severity. Although developed for the particular application of longitudinal lesion incidence segmentation in MS, SuBLIME can be applied more generally to coregistered serial images to detect other changes and pathologies. We expect that a version of SuBLIME can easily be adapted to monitor other pathologies assessed using MR imaging, such as volumetric changes in patients with vascular disease or tumors. Our techniques may also be useful for monitoring changes in other imaging outcomes, including studies that use combinations of imaging techniques such as PET-CT studies in oncology. Finally, it is likely that the methods can be applied to organs outside the brain, including the lung, liver, and kidneys.
Conclusions
SuBLIME is a fully automated and computationally fast method that allows sensitive and specific detection of lesion incidence and enlargement. Using the explicit form of the statistical model, SuBLIME can easily be adapted to cases when more or fewer imaging sequences are available.
Acknowledgments
The authors thank Henry McFarland, Joan Ohayon, John Ostuni, Roger Stone, the Neuroimmunology Branch clinical group, and the NIH Functional Magnetic Resonance Imaging Facility technologists, who were instrumental in helping to collect and process the study data.
Footnotes
Disclosures: Elizabeth Sweeney—RELATED: Grant: NIH;* UNRELATED: Patent: Johns Hopkins.* Russell Shinohara—RELATED: Grant: NIH, Comments: T32 and R01 support as a research assistant; Fees for Participation in Review Activities Such as Data Monitoring Boards, Statistical Analysis, Endpoint Committees, and the Like: NIH;* Provision of Writing Assistance, Medicines, Equipment, or Administrative Support: NIH;* Other: NIH;* UNRELATED: Employment: NIH,* Comments: see above; Grants/Grants Pending: NIH.* Ciprian Crainiceanu—RELATED: Grant: NIH/NINDS R01NS060910,* Comments: Statistical methods for multilevel multivariate functional studies; UNRELATED: Consultancy: Merck, On-X Technologies, Comments: Merck: statistical methods for the analysis of EEG data; On-X: design of an adaptive clinical trial for mitral valve surgery; none is related to the work done for this paper; Patents (planned, pending, or issued): The work in the paper was submitted for a US patent application* (*Money paid to institution.)
The research was partially supported by the Intramural Research Program of the National Institute of Neurologic Disorders and Stroke. E.M.S., R.T.S., and C.M.C. were supported by grant R01 NS060910-03/NINDS NIH HHS/United States. The content is solely the responsibility of the authors and does not necessarily represent the official views of the funding agencies.
Indicates open access to non-subscribers at www.ajnr.org
References
- Received January 31, 2012.
- Accepted after revision March 26, 2012.
- © 2013 by American Journal of Neuroradiology
In this issue


Jump to section
Related Articles
Cited By...
- Evaluation of the Statistical Detection of Change Algorithm for Screening Patients with MS with New Lesion Activity on Longitudinal Brain MRI
- Evaluation of the Statistical Detection of Change Algorithm for Screening Patients with MS with New Lesion Activity on Longitudinal Brain MRI
- Evaluation of statistical detection of change algorithm for triaging multiple sclerosis patients with new lesion activity on longitudinal brain MRI
- Automatic brain lesion segmentation on standard magnetic resonance images: a scoping review
- Intensity warping for multisite MRI harmonization
- A New Approach to Symmetric Registration of Longitudinal Structural MRI of the Human Brain
- An automated statistical technique for counting distinct multiple sclerosis lesions can recover aspects of lesion history and provide relevant disease information
- Improved Detection of New MS Lesions during Follow-Up Using an Automated MR Coregistration-Fusion Method
- An Automated Statistical Technique for Counting Distinct Multiple Sclerosis Lesions
- Improved Automatic Detection of New T2 Lesions in Multiple Sclerosis Using Deformation Fields