
Abstract
BACKGROUND AND PURPOSE: In patients with acute stroke, the location and extent of intravascular thrombi correlate with clinical and imaging outcomes and have been used to predict the success of intravenous thrombolysis. We hypothesized that 4D-CTA reconstructed from whole-brain CTP more closely outlines intracranial thrombi than conventional single-phase CTA.
MATERIALS AND METHODS: Sixty-seven patients with anterior circulation occlusion were retrospectively analyzed. For 4D-CTA, temporal maximum intensity projections were calculated that combine all 30 spiral scans of the CTP examination through temporal fusion. Thrombus extent was assessed by a semi-quantitative clot burden score (0–10; in which 0 = complete unilateral anterior circulation occlusion and 10 = patent vasculature). In patients with sufficient collateral flow, the length of the filling defect and corresponding hyperdense middle cerebral artery sign on NCCT were measured.
RESULTS: Clot burden on temporal maximum intensity projection (median clot burden score, 7.0; interquartile range, 5.1–8.0) was significantly lower than on single-phase CT angiography (median, 6.0; interquartile range, 4.5–7.0; P < .0001). The length of the hyperdense middle cerebral artery sign (14.30 ± 5.93 mm) showed excellent correlation with the filling defect in the middle cerebral artery on temporal maximum intensity projection (13.40 ± 6.40 mm); this filling defect was larger on single-phase CT angiography (18.08 ± 6.54 mm; P = .043).
CONCLUSIONS: As the result of an increased sensitivity for collateral flow, 4D-CTA temporal maximum intensity projection more closely outlines intracranial thrombi than conventional single-phase CT angiography. Our findings can be helpful when planning acute neurointervention. Further research is necessary to validate our data and assess the use of 4D-CTA in predicting response to different recanalization strategies.
ABBREVIATIONS:
- CBS
- clot burden score
- HMCAS
- hyperdense middle cerebral artery sign
- ICC
- intraclass correlation coefficient
- spCTA
- single-phase CT angiography
- tMIP
- temporal maximum intensity projection
In patients with acute stroke with large-vessel occlusion, the location and extent of intracranial arterial thrombi has been shown to correlate with infarct size and clinical outcome.1⇓–3 The length and location of clot has also been used to predict treatment response, suggesting that more proximal and longer clots may be resistant to intravenous thrombolysis.4,5 Thus, reliable depiction of thrombus burden may provide important prognostic information and affect treatment decisions in the acute phase. Thin-section NCCT has been used for clot depiction. However, it has been shown that NCCT appearance of clot depends on thrombus composition,6⇓–8 suggesting that some (low-attenuation) portions of clot could be less well discernible with this technique. NCCT may also be more challenging when vascular calcifications or a high hematocrit appear as intra-arterial hyperdensities. CTA is widely used for thrombus detection in patients with stroke. However, visibility of thrombus extent on CTA depends on the strength of collateral flow, particularly with current-generation fast acquisition protocols.9 Volumetric CTP examinations obtained as part of a multi-modal stroke CT protocol can be reconstructed to yield time-resolved 4D-CTA.10⇓–12 Compared with standard spCTA, this technique provides a broad temporal coverage from nonenhanced through arterial to venous phases. We hypothesized that 4D-CTA is more sensitive to delayed contrast arrival and allows better approximation of intracranial clot burden than standard arterial-phase spCTA. Because there is no current criterion standard for thrombus imaging, we compared clot burden measured on 4D-CTA and spCTA. In patients with a clearly visible HMCAS, we used its length as a reference to assess the accuracy of filling defects observed on 4D-CTA and spCTA.
Materials and Methods
Study Design
We retrospectively identified patients with acute ischemic stroke from an institutional review board–approved endovascular stroke data base who met the following inclusion criteria: 1) presence of a complete multi-modal CT examination (including NCCT of the head, spCTA of the head and neck, and thin-section 4D-CTA reconstructions from the CTP data set), 2) time of symptom onset <24 hours, 3) acute anterior circulation intracranial vessel occlusion, and 4) attempted endovascular recanalization. Patients with insufficient coverage of the intracranial arteries or severe motion artifacts on 4D-CTA were excluded. For all patients, CTP parameter maps were used to assess salvageable brain tissue and guide treatment decisions, whereas 4D-CTA was reviewed retrospectively.
Image Acquisition
CT images were obtained on a 128-section multi-detector CT scanner (Definition AS+; Siemens, Erlangen, Germany). Scanning order was NCCT of the head, near whole-brain CTP, and, last, craniocervical CTA. Volumetric CTP data were acquired by means of a periodic spiral approach consisting of 30 consecutive spiral scans of the brain10 (96 mm in z-axis, 2-second delay after start of contrast injection, 1.5-second mean temporal resolution, 45-second total scan duration, 80 kV, 200 mAs, rotation time 0.3 seconds, maximum pitch 0.5, collimation 2×64×0.6 mm). A 36-mL bolus of contrast (Imeron 400; Bracco, Konstanz, Germany) was used at a flow rate of 6 mL/s followed by a 30-mL saline chaser at 6 mL/s. For spCTA (120 kV, 120 reference mAs, rotation time 0.3 seconds, pitch 0.6, collimation 2×64×0.6 mm), 65 mL of contrast was injected with a biphasic protocol (45 mL at 6 mL/s, 15 mL at 3 mL/s) and was followed by a 30-mL saline chaser at 3 mL/s. To reduce the total number of images, CTP data were reconstructed with a section width of 1.5 mm every 1 mm (Kernel H20f, 512 Matrix) for 4D-CTA, resulting in 2850 single images. spCTA was acquired with automatic bolus triggering in the aortic arch (100 HU, 2-second delay), and data were reconstructed with a section width of 0.75 mm every 0.4 mm. The effective dose (calculated by multiplying dose-length products with published conversion factors) was 5.3 mSv for the CTP scan, 1.1 mSv for the craniocervical CTA portion (20 cm from vertex), and 2.1 mSv for the remaining more caudal CTA range (15 cm).10 Biplanar DSA was obtained during the endovascular procedure (Axiom Artis dBA; Siemens).
Demographic Data
Demographic and clinical data obtained from medical records included age, sex, time from symptom onset to CT examination, and application of intravenous or intra-arterial recombinant tissue plasminogen activator. NIHSS score at presentation was retrospectively assigned by a stroke neurologist with certification for the scale. In patients with wake-up stroke, time last seen well was used as a substitute. When the time last seen well was not documented, symptom onset was defined as midnight when presenting between midnight and noon and noon when presenting between noon and midnight.
Image Analysis
Four-dimensional CTA data were processed with the use of a commercial software package (Dynamic Angio, Siemens) that includes automatic motion correction and a dedicated noise reduction technique as previously described10 and creates 3D temporal maximum intensity projection data. tMIP images essentially depict the maximum enhancement over the 45-second scan time for every voxel and therefore they fuse contrast opacification from early arterial up to late venous phases of the CTP examination into 1 CT data set (processing time is <80 seconds). This technique has also been referred to as “timing-invariant CTA.”13 In addition to axial thin-section source images, maximum intensity projections in axial and coronal planes were reconstructed for both spCTA and tMIP (10-mm section thickness, 3-mm increment). Two readers (12 years and 2 years of experience in acute stroke imaging) blinded to clinical information assessed tMIP and spCTA in randomized order according to a previously validated, semi-quantitative clot burden score.1 CBS (0–10) is calculated as a sum of all visible patent vascular segments including the proximal and distal M1 segments of the middle cerebral artery (2 points each); supraclinoid ICA (2 points); and M2 branches, A1 anterior cerebral artery segment, and infraclinoid ICA (1 point each).1 A CBS of 0 thus means complete unilateral anterior circulation intracranial occlusion. Biplanar DSA images obtained at the beginning of the endovascular procedure were evaluated for early partial or complete recanalization of the occluded vessel in direct comparison to spCTA.
Thrombus length was measured in patients with M1 occlusion and an unequivocal HMCAS. Because thin-section NCCT was not routinely obtained, the presence of HMCAS was assessed by 2 raters in consensus on nonenhanced thin-section (1.5-mm) images reconstructed from the early phase of the CTP examination. For this purpose, the temporal average of 1–5 spiral scans before the arrival of the contrast bolus was calculated to reduce noise compared with the raw 1.5-mm CTP sections. To qualify as unequivocal HMCAS, the attenuation in a region of interest within the affected middle cerebral artery had to be at least 20% higher than on the unaffected side. HMCAS length was assessed by manually adjusting a semi-automatic, curved, 3D vessel analysis tool (InSpace, Siemens) to fit the intravascular hyperattenuation and measuring its length along the axis of the resulting curved vessel skeleton. On 4D-CTA and spCTA, the length of the filling defect within the middle cerebral artery was measured by connecting straight lines in axial or coronal planes at the discretion of the rater if at least 1 of the raters was able to define a proximal and distal clot end.
Statistical Analysis
Standard descriptive statistics are reported for baseline variables, means are reported ±standard deviation. Inter-rater reliability was assessed by the single-measures intraclass correlation coefficient for absolute agreement. Median CBSs for the 2 raters were calculated for spCTA and tMIP and then compared with the Wilcoxon test. Spearman rank correlation and the Mann-Whitney test for independent samples were used to correlate CBS with clinical variables. The paired t test, Pearson correlation, and Bland-Altman analyses were used to assess mean clot length and filling defect measurements. P < .05 was considered statistically significant. All statistical analyses were performed with the use of Medcalc 12 (MedCalc Software, Mariakerke, Belgium).
Results
Demographic and Clinical Data
Among 149 consecutive patients with acute stroke (January 2009 to February 2012) in our university hospital endovascular stroke treatment data base, thin-section 4D-CTA was available in 71 patients with anterior circulation vessel occlusion. After excluding patients with insufficient coverage of the basal intracranial arteries for CBS evaluation (n = 2) and severe motion artifacts (n = 2), 67 patients entered the final analysis. Mean age was 70 ± 14 years; 36 patients (54%) were women. Median NIHSS score on presentation was 17 (range, 4–26). Mean time between symptom onset and CT was 150 minutes (30–624 minutes). Mean time between CT and DSA was 88 minutes (31–179 minutes). The most proximal vessel occlusion was classified as common carotid artery (n = 1), cervical carotid artery (n = 11), terminal internal carotid artery (n = 10), as well as the M1 (n = 42) and M2 (n = 3) segments of the middle cerebral artery. Intravenous bridging thrombolysis was used in 55 patients (82%). Six of these patients (11%) showed early partial or complete recanalization on the initial DSA series.
Clot Burden
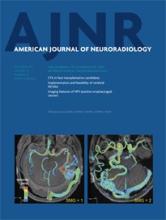
Median CBS on tMIP (7.0; range, 2.5–9.0; interquartile range, 5.1–8.0) was significantly higher than on spCTA (6.0; range, 1.0–9.0; interquartile range, 4.5–7.0; P < .0001; Fig 1). When looking at individual cases, median CBS was identical between tMIP and spCTA in 22 cases (33%). The largest difference in CBS was 4 points (higher on tMIP) and the lowest −1 point (lower on tMIP). In 23 patients (34%), median tMIP CBS was ≥1 point higher than spCTA; in 9 patients (13%), it was ≥2 points higher. Conversely, spCTA CBS was ≥1 point higher than tMIP in only 2 cases (3%). The distal thrombus end could be identified by both raters in 30 patients on spCTA (45%) versus 48 patients (72%) on tMIP. Inter-rater reliability between the 2 raters was substantial for both spCTA (ICC: 0.74, 95% CI: 0.61–0.83) and tMIP (ICC: 0.74, 95% CI: 0.60–0.84).

Assessment of clot burden. A, Coronal spCTA maximum intensity projection in a patient with left-sided middle cerebral artery occlusion shows lack of opacification of the entire M1 segment (4 points) as well as M2 segments (1 point each), resulting in a CBS of 4. B, The corresponding tMIP reveals delayed filling of the very distal M1 as wells as M2 segments (arrow). Raters defined only the proximal M1 as occluded and assigned a CBS of 8.
CBS scores on spCTA tended to decrease with increasing presenting NIHSS score without reaching significance (ρ = −0.197; P = .109); this was less apparent for tMIP (ρ = −0.135; P = .2771). The presence of early recanalization after intravenous thrombolysis did not significantly correlate with CBS (P = 1.0 for spCTA; P = .40 for tMIP). Mean time from CT to DSA was similar for patients with and without early recanalization (78 versus 90 minutes, P = .365).
Thrombus Length
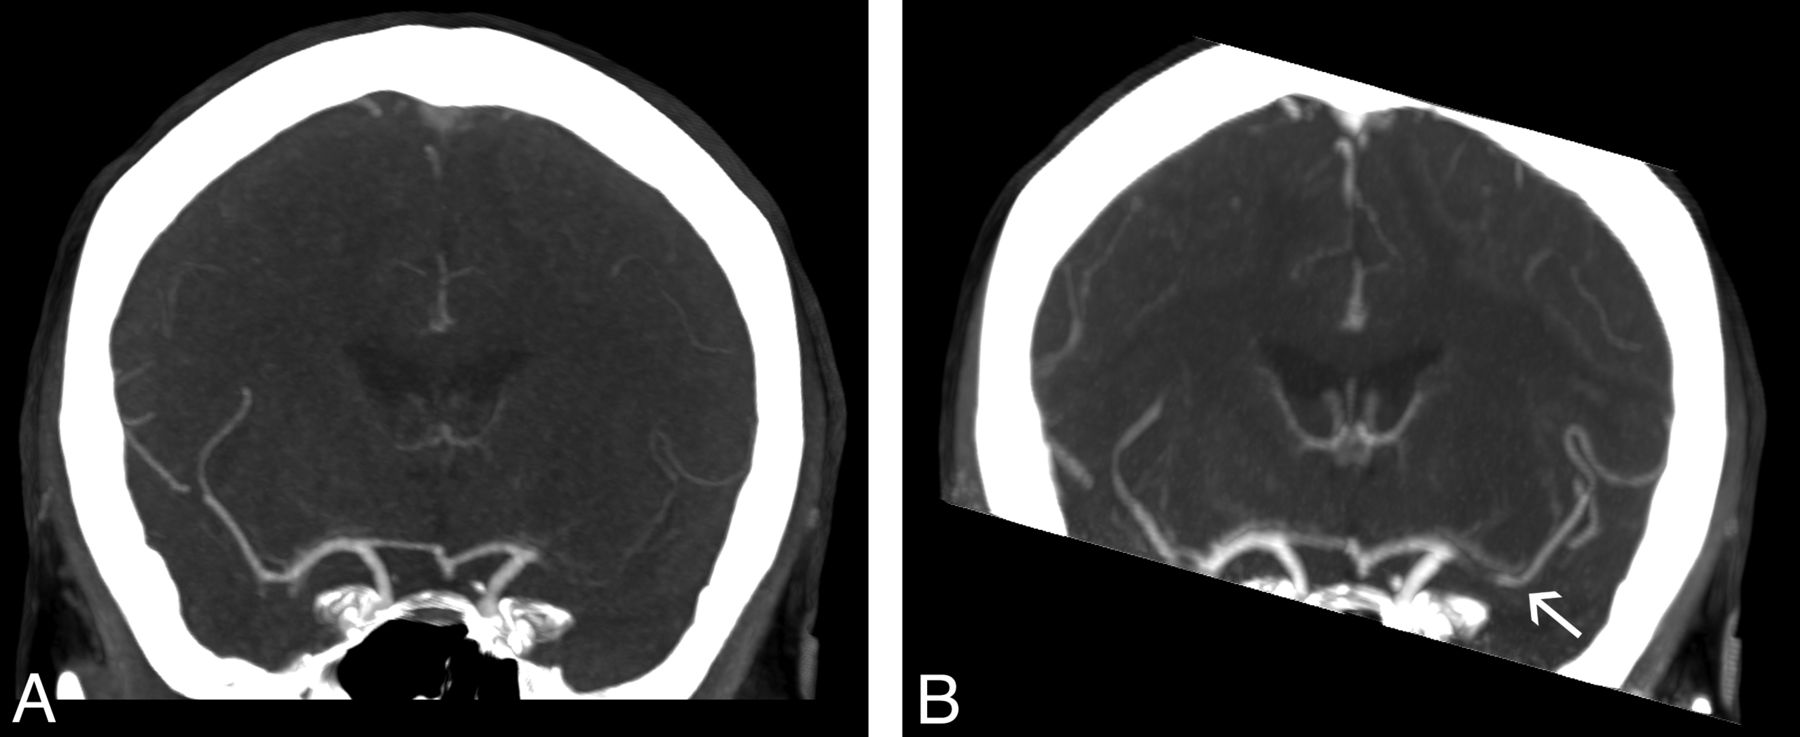
Among 42 patients with M1 occlusion, 31 had sufficient collateral flow for length analysis of the filling defect according to at least 1 rater. Mean length of the filling defect was significantly lower on tMIP (12.50 ± 5.81 mm) than on spCTA (14.44 ± 6.65 mm; P = .036). Among all M1 occlusions, 14 (33%) had an unequivocal HMCAS on thin-sectioned nonenhanced CTP reconstructions. Filling defects were measurable in 13 of these on tMIP versus 10 on spCTA. Mean HMCAS length for these 10 patients was 14.30 ± 5.93 mm. The mean corresponding filling defect on tMIP (13.40 ± 6.40 mm) was significantly shorter than on spCTA (18.08 ± 6.54 mm; P = .043). Length of the filling defect on tMIP showed excellent correlation with the length of the HMCAS (n = 13; r = 0.94; 95% CI: 0.83–0.98; R2 = 0.88; P < .0001; Fig 2). There was no significant correlation for spCTA (n = 10; r = 0.52; 95% CI: −0.17–0.86; R2 = 0.27; P = .127). Bland-Altman plots showed increased accuracy of tMIP for predicting HMCAS length (Fig 3).

Filling defects and hyperattenuated clot. A, Axial spCTA maximum intensity projection shows a right-sided middle cerebral artery occlusion (arrow). B, On the corresponding tMIP, the occluding thrombus is well visualized as a filling defect. C, Axial thin-section image from the nonenhanced phase of the CTP scan shows an HMCAS matching this filling defect.

Measuring clot length. Bland-Altman plots illustrate the comparative precision of filling defects on spCTA (A) and on tMIP (B) in predicting the length of the HMCAS.
Discussion
Assessing Clot Burden and Thrombus Length
The present study shows that tMIP reconstructions from 4D-CTA more closely outline intracranial clot burden than conventional arterial-phase spCTA. Although the appearance of clot burden can be identical on spCTA and tMIP, the latter revealed significant additional information on clot extent in approximately one-third of our population. The distal thrombus end was identified more often on tMIP than on spCTA (both raters identified it in 72% versus 45% of cases). Because tMIP can be reconstructed from volumetric CTP examinations without additional contrast or radiation exposure, the presented approach can be easily integrated into existing CT stroke imaging protocols.
Importantly, it is conceivable that thrombi could also be more closely approximated by adjusting the speed and triggering delay of spCTA to reveal delayed collateral flow. However, intracranial bolus passage is difficult to predict, and delaying the scan too much may dramatically reduce arterial contrast. Adjustment of spCTA timing thus does not seem justified on the basis of our present results, especially considering that tMIP can be obtained simply by adding another reconstruction, without otherwise altering the multi-modal CT protocol.
The overall observed difference in CBS between tMIP and spCTA was rather small (1 point difference of the median), in part because of patients with identical CBS on tMIP and spCTA (n = 22). When a difference was present, a commonly observed pattern was that tMIP showed patency of M2 branches not seen on spCTA. The difference in CBS is best explained by the increased sensitivity of tMIP for delayed collateral flow reaching the vasculature distal to the occlusion site. Indeed, in the initial description of the CBS it was pointed out that the score depends on delayed collateral flow.1 The authors conclude that this may actually be a strength of the score, because decreased collateral flow (which in turn will decrease the CBS on spCTA) has been associated with larger infarcts and poorer outcome. The tMIP technique may thus weaken the prognostic power of the CBS because temporal fusion makes strong, early collateral flow virtually indistinguishable from delayed, weaker collaterals, leading to identical CBS despite different physiologic implications. Interestingly, we observed a (nonsignificant) trend toward a higher presenting NIHSS with lower CBS on spCTA; this correlation was less apparent on tMIP. Thus, we deem it possible that diminished collateral flow (leading to lower CBS scores on spCTA but not necessarily on tMIP) is accompanied by more severe clinical deficits on presentation.
To validate both spCTA and tMIP against a reference, we assessed clot length in patients with M1 occlusion who also had an unequivocal HMCAS and sufficient collateral flow according to at least 1 rater. Our results show an excellent correlation between the length of the filling defect on tMIP and the length of the HMCAS, confirming that tMIP may adequately outline middle cerebral artery thrombi. Correlation of HMCAS with spCTA was not significant, probably because of inaccuracy in estimating the filling defect on spCTA, depending on collateral flow. Previous investigators have shown a strong correlation of the HMCAS and the spCTA filling defect, but they specifically selected patients with sufficient collateral flow and a filling defect matching the HMCAS,14 which may explain this discrepancy. In 2 patients with long (>20 mm) clots, the tMIP filling defect was measured >5 mm shorter than the HMCAS, which we tend to attribute to the slightly different measurement techniques used (curved analysis for HMCAS, orthogonal lines for filling defects).
Thin-section NCCT has previously been used elegantly to assess clot length (measured as HMCAS length) and predict response to intravenous thrombolysis.5 Compared with tMIP, this represents a technically less demanding approach to determine middle cerebral artery clot length. However, the technique may be affected by clot composition, because erythrocyte-rich thrombi have been shown to display higher attenuation values than platelet-rich thrombi.6,8 Furthermore, the presence of vascular calcifications or a high hematocrit may mimic the HMCAS and thus decrease specificity.14 Thus, tMIP could be helpful in quantifying thrombus length when an HMCAS is not unequivocally seen or when the longitudinal extent of the HMCAS is uncertain. In addition, it is conceivable that an erythrocyte-rich, high-attenuation, and hence well-visible thrombus may be accompanied by appositional, platelet-rich, low-attenuation thrombi, which would lead to discrepancies between the HMCAS and CTA imaging. This could hypothetically account for some of the presently observed differences between tMIP and HMCAS; however, this did not affect overall correlation of tMIP and HMCAS in our comparably small sample size. Particularly in patients with weak collateral flow, any arterial segment not opacified on tMIP could theoretically harbor thrombi or stagnant blood, potentially in different stages of the clotting process. Correlation with thin-section NCCT could then reveal which parts correspond to high-attenuation thrombus. For these reasons, we propose that CT angiographic techniques may in some cases offer complementary information on clot physiology compared with the assessment of the HMCAS. The value of tMIP, then, lies in the ability to depict the complete extent of vessels perfused within the acquisition time.
One of our study's limitations is that thin-section NCCT was not routinely obtained. Instead, we used temporal average thin-section reconstructions from the early, nonenhanced phase of the CTP examination to assess the HMCAS, which may have affected sensitivity and comparability of our results. We observed an unequivocal HMCAS in 33% of patients with M1 occlusion, which is low compared with recently reported sensitivity and specificity values of the HMCAS on thin-section NCCT.15 Four-dimensional CTA was reconstructed with a higher section width and increment than spCTA (1.5/1.0 mm versus 0.75/0.4 mm), which was chosen as a compromise between a manageable number of images and acceptable image quality. Other limitations include the presence of more venous enhancement on tMIP than on spCTA, which may in some cases make evaluation of the arterial tree more difficult. However, this was not a limiting factor for arterial analysis in our patients. Slight venous contamination was also invariably present on spCTA images because of residual contrast material from the immediately preceding CTP examination. We also cannot exclude that additional vessel segments would become visible on tMIP if the acquisition time of the CTP examination would be increased beyond the presently used 45 seconds. Finally, the retrospective design of our study carries the risk of selection bias, particularly because we only assessed patients undergoing endovascular treatment. However, this allowed us to assess early recanalization on conventional angiography after bridging thrombolysis. We did not observe a clear relation between early recanalization and clot burden, which we tend to attribute to the low sample size of early recanalizers (n = 6). This low early recanalization rate (11%) emphasizes previous reports on this matter.4 It is important to note that recanalization was assessed relatively early in our study: Thrombolysis was initiated as soon as possible after interpretation of NCCT; the mean 88 minutes between CT and DSA can therefore be used to approximate the maximum duration between thrombolysis and assessment of early recanalization. This may have contributed to the relatively low recanalization rate observed. Assessing tMIP and other 4D-CTA reconstructions in predicting response to standard intravenous therapy seems desirable; however, this would require a different patient collective to compare outcomes after intravenous therapy only.
Clinical Implications
Accurate information on the extent of thrombus is important for adequate treatment planning. Previous studies have consistently shown that larger, more proximal clots often do not respond to intravenous thrombolysis and are associated with worse clinical outcome.1⇓⇓⇓–5 As a result, more aggressive endovascular recanalization procedures are often considered in these patients. With an increasing number of available neurovascular medical and device-assisted treatment options, precise definition of the target lesion, that is, the occluding thrombus, is desirable. Animal model evidence has shown that longer clots (>10 mm) are associated with decreased procedural success and increased rates of complications such as distal embolization during mechanical thrombectomy.16 Evaluation of the patency of M2 branches may also be particularly helpful when mechanical thrombectomy is considered, further emphasizing the need for precise thrombus delineation from the interventionalist's perspective. With the recent halting of the Interventional Management of Stroke III trial, it is becoming increasingly clear that adequate selection of patients likely to benefit from a specific type of endovascular therapy is crucial in establishing evidence of clinical efficacy. Besides clinical variables and imaging strategies directed at defining salvageable brain tissue, clot characteristics such as length,5 location,17,18 composition,6⇓–8 and degree of luminal occlusion19⇓–21 should be considered as potential predictors of the clinical efficacy of different available medical and endovascular treatment modalities.
Conclusions
Because of an increased sensitivity for delayed collateral flow, 4D-CTA tMIP improves the definition of clot extent compared with standard spCTA, more frequently and more closely outlining thrombi occluding intracranial arteries. Precise assessment of clot burden may help in making treatment decisions, especially when endovascular therapy is considered. Clot characteristics such as size, composition, and location should be further assessed as potential predictors of the efficacy of available medical and endovascular stroke treatment modalities.
ACKNOWLEDGMENTS
We thank Hans-Joachim Helms from our university's department of medical statistics for reviewing the statistical analyses.
Footnotes
Disclosures: Andreas Frölich—RELATED: Grant: Research grant with Siemens Healthcare;* Consulting Fee or Honorarium: Speaker's honoraria from Siemens Healthcare; Support for Travel to Meetings for the Study or Other Purposes: Travel support from Siemens Healthcare. Ernst Klotz—UNRELATED: Employment: Full-time employee of Siemens Healthcare, Germany. Michael Knauth—RELATED: Support for Travel to Meetings for the Study or Other Purposes: Speaker's Bureau for Siemens Medical (not study-related); UNRELATED: Payment for Lectures (including service on speakers bureaus): Siemens Medical, Arcandis, Penumbra, Codman. Peter Schramm—RELATED: Support for Travel to Meetings for the Study or Other Purposes: Siemens AG (travel support); UNRELATED: Payment for Lectures (including service on speakers bureaus): Siemens AG (speakers honoraria) (*money paid to institution).
Paper previously presented in part at: Annual Meeting of the American Society of Neuroradiology, April 23, 2012; New York, New York.
This work was supported by intradepartmental funding. The department has a research agreement with Siemens AG, Forchheim, Germany.
Indicates open access to non-subscribers at www.ajnr.org
REFERENCES
- Received December 4, 2012.
- Accepted after revision January 17, 2013.
- © 2013 by American Journal of Neuroradiology


Jump to section
Related Articles
Cited By...
- Thrombus radiomics in patients with anterior circulation acute ischemic stroke undergoing endovascular treatment
- RAPID CT Perfusion-Based Relative CBF Identifies Good Collateral Status Better Than Hypoperfusion Intensity Ratio, CBV-Index, and Time-to-Maximum in Anterior Circulation Stroke
- Clot Burden Score and Collateral Status and Their Impact on Functional Outcome in Acute Ischemic Stroke
- Thrombus Permeability on Dynamic CTA Predicts Good Outcome after Reperfusion Therapy
- Slow Collateral Flow Is Associated with Thrombus Extension in Patients with Acute Large-Artery Occlusion
- Associations Between Collateral Status and Thrombus Characteristics and Their Impact in Anterior Circulation Stroke
- Association of clot burden score with radiographic and clinical outcomes following Solitaire stent retriever thrombectomy: analysis of the SWIFT PRIME trial
- Absent Filling of Ipsilateral Superficial Middle Cerebral Vein Is Associated With Poor Outcome After Reperfusion Therapy
- Evaluation of Collaterals and Clot Burden Using Time-Resolved C-Arm Conebeam CT Angiography in the Angiography Suite: A Feasibility Study
- Clot Burden Score on Baseline Computerized Tomographic Angiography and Intra-Arterial Treatment Effect in Acute Ischemic Stroke
- Radiation Dose Reduction in 4D Cerebral CT Angiography by Individualized Estimation of Cerebral Circulation Time
- Comparison of four different collateral scores in acute ischemic stroke by CT angiography
- Permeable Thrombi Are Associated With Higher Intravenous Recombinant Tissue-Type Plasminogen Activator Treatment Success in Patients With Acute Ischemic Stroke
- Prediction of Stent-Retriever Thrombectomy Outcomes by Dynamic Multidetector CT Angiography in Patients with Acute Carotid T or MCA Occlusions
- Thrombus Permeability Is Associated With Improved Functional Outcome and Recanalization in Patients With Ischemic Stroke
- Time-Resolved C-Arm Computed Tomographic Angiography Derived From Computed Tomographic Perfusion Acquisition: New Capability for One-Stop-Shop Acute Ischemic Stroke Treatment in the Angiosuite
- Dynamic Angiography and Perfusion Imaging Using Flat Detector CT in the Angiography Suite: A Pilot Study in Patients with Acute Middle Cerebral Artery Occlusions
- Optimal MRI Sequence for Identifying Occlusion Location in Acute Stroke: Which Value of Time-Resolved Contrast-Enhanced MRA?
- 4D-CTA in Neurovascular Disease: A Review
- Carotid I's, L's and T's: collaterals shape the outcome of intracranial carotid occlusion in acute ischemic stroke
- Relative Filling Time Delay Based on CT Perfusion Source Imaging: A Simple Method to Predict Outcome in Acute Ischemic Stroke
- Length of Occlusion Predicts Recanalization and Outcome After Intravenous Thrombolysis in Middle Cerebral Artery Stroke