
Article Figures & Data
Figures
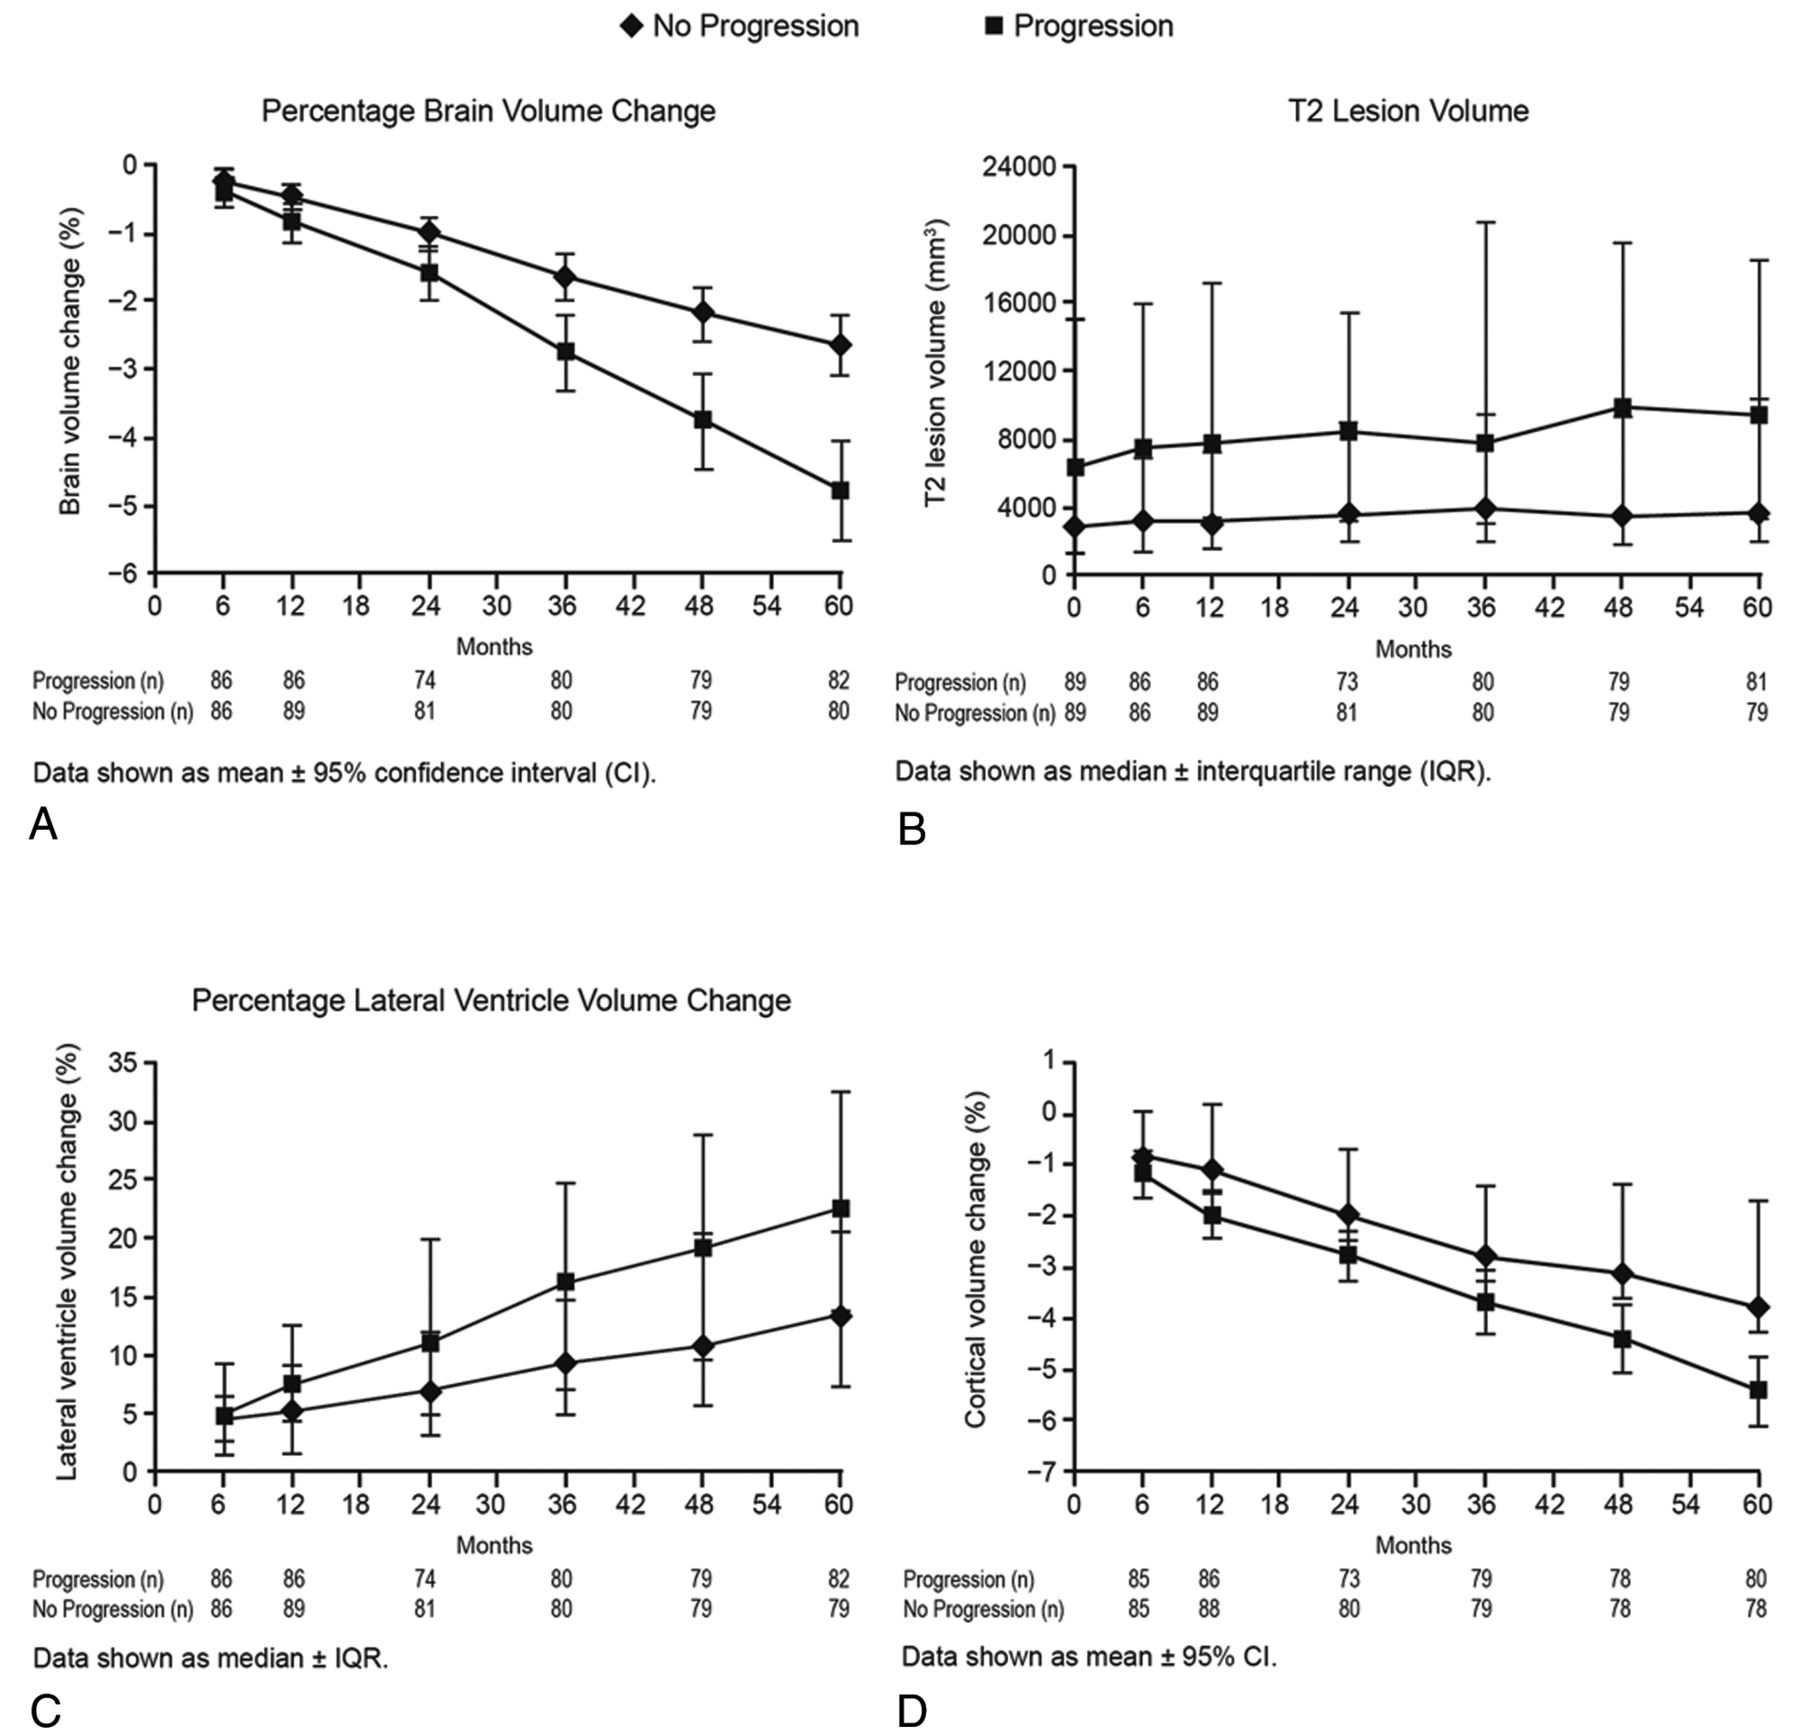
- Fig 1.
Temporal changes in global and tissue-specific MR imaging measures by disability-progression status at different time points of the study are shown as mean ± 95% confidence intervals and median ± interquartile range, as appropriate. A, Percentage change in whole-brain volume. B, T2-lesion volume. C, Percentage change in lateral ventricular volume. D, Percentage change in cortical volume.
- Fig 2.
Changes in global and tissue-specific MR imaging measures (fitted values–intercept model) by disability-progression status with time. Percentage change in whole-brain volume: interaction P < .001 (A); and T2-lesion volume: interaction P = not significant (B). C, Percentage change in lateral ventricular volume: interaction P < .001. D, Percentage change in cortical volume: interaction P < .001.
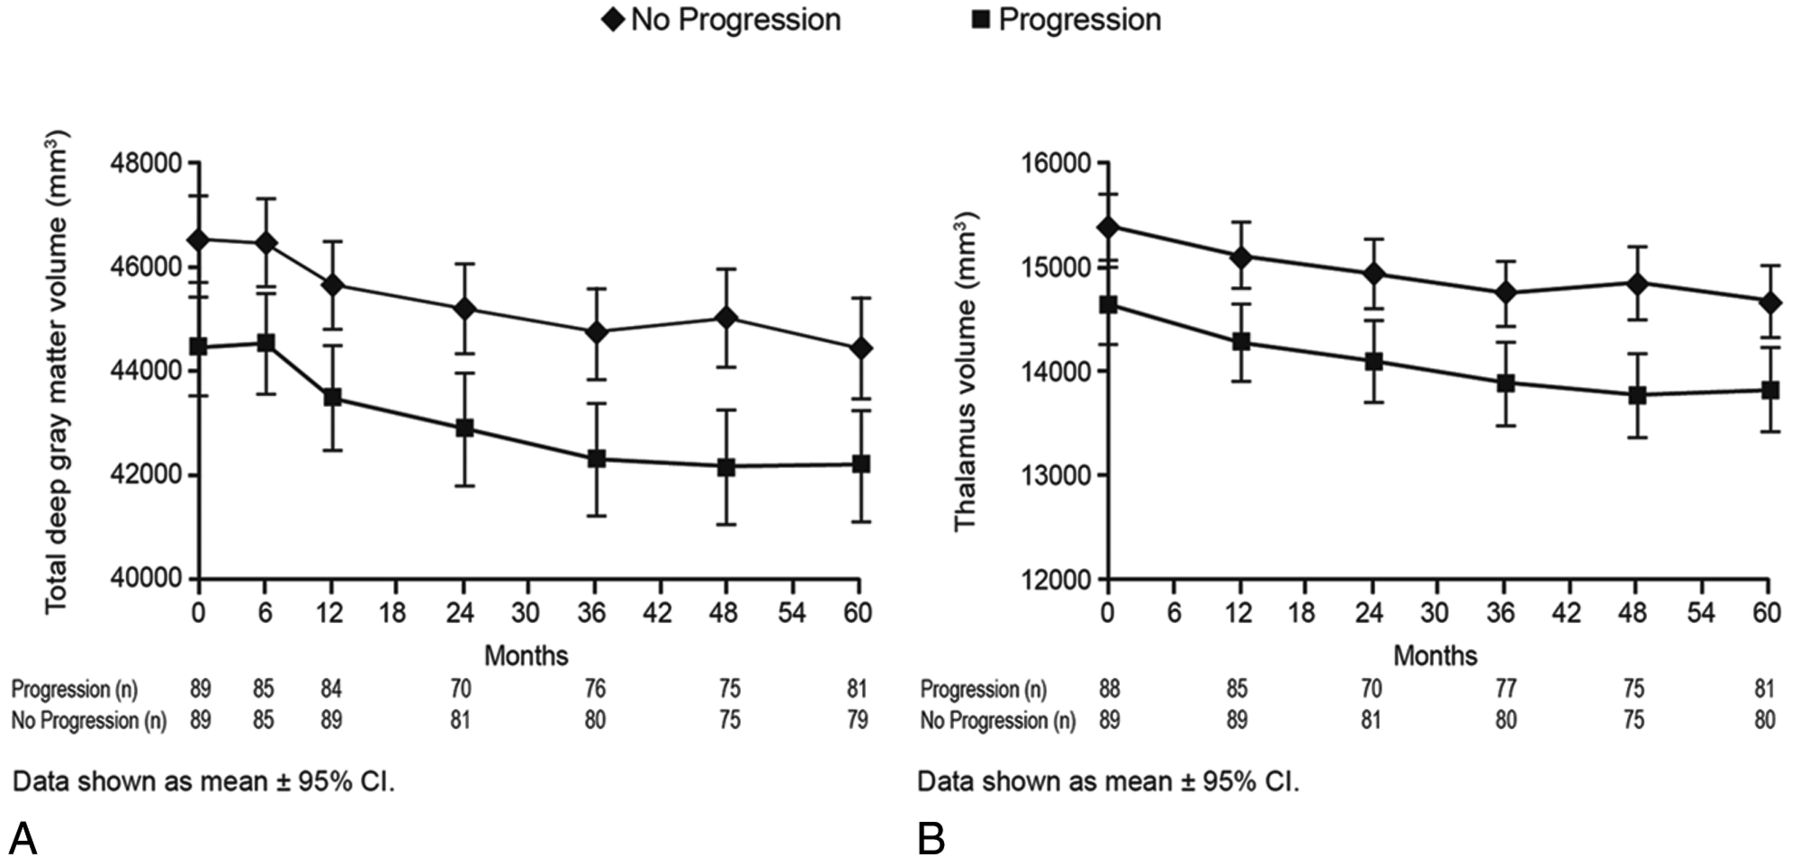
- Fig 3.
Temporal changes in deep gray matter MR imaging measures by disability-progression status at different time points of the study are shown as mean ± 95% confidence intervals and median ± interquartile range, as appropriate. Total deep gray matter volume (A) and thalamus volume (B).
- Fig 4.
Changes in deep gray matter MR imaging measures (fitted values–intercept model) by disability-progression status with time. Total deep gray matter volume: interaction P = .0095 (A); and thalamus volume: P = .0006 (B).


Tables
- Table 1:
Baseline demographics and clinical characteristics for all patients, split by progression status at 5 yearsa
Sustained Disease Progression (n = 90) Stable Disease (n = 90) P Value Female (No.) (%) 68 (75.6) 73 (81.1) .4 Age (yr) (mean) (SD) (median) 31.9 (7.9) 31.5 29.5 (7.8) 28.5 .04 Disease duration (yr) (mean) (SD) (median) 6.0 (5.8) 4.0 4.0 (4.3) 3.0 .01 EDSS (mean) (SD) 2.0 (1.0) 1.8 (0.8) .2 Median (range) 2.0 (0–3.5) 2.0 (0–3.5) Treatment assignment (No.) (%) IFN-β 1a monotherapy 25 (27.8%) 34 (37.8%) .3 IFN-β 1a + AZA 32 (35.6%) 26 (28.9%) IFN-β 1a + AZA + Steroids 33 (36.7%) 30 (33.3%) Treatment switchb Did not switch 34 (38%) 62 (69%) <.0001 Switched 56 (62%) 26 (29%) Note:—IFN-β indicates interferon-β; AZA, azathioprine.
↵a The difference of the means between the groups was calculated using the Student t test, Pearson χ2 test, or Mann-Whitney rank sum test, as appropriate.
↵b Treatment switch was defined on the basis of a derived yes/no variable as to whether patients changed treatment status during the 5-year follow-up.
- Table 2:
Baseline MRI characteristics for all patients, split by progression status at 5 yearsa
Sustained Disease Progression (n = 90) (mean) (SD) (median) Stable Disease (n = 90) (mean) (SD) (median) P Value T2-LV 11.2 (12.9) 6.3 4.7 (5.5) 2.8 <.0001 NWBV 1488.8 (84.4) 1485.6 1524.4 (74.1) 1520.6 .003 NGMV 797.9 (53.1) 800.2 815.5 (50) 822.7 .02 NWMV 690.9 (49.9) 689.5 708.9 (37.4) 704.5 .007 NLVV 42.6 (15.1) 39.7 40 (11.8) 38.9 .3 NCV 623.6 (43.3) 627 639.7 (41.3) 643.6 .01 Total NSDGMV 44.5 (4.5) 44.5 46.6 (3.9) 46.4 .002 NSDGMV structures Caudate nucleus 6.4 (0.8) 6.4 6.8 (0.8) 6.8 .0009 Putamen 9.4 (1.1) 9.3 9.8 (1) 9.9 .015 Globus pallidus 3.4 (0.4) 3.4 3.5 (0.4) 3.5 .05 Thalamus 14.6 (1.8) 14.6 15.4 (1.5) 15.2 .002 Hippocampus 7.2 (0.8) 7.2 7.5 (0.8) 7.6 .015 Nucleus accumbens 0.9 (0.2) 0.9 1 (0.2) 1 .018 Amygdala 2.6 (0.4) 2.6 2.6 (0.3) 2.6 .14 Note:—LV indicates lesion volume; NWBV, normalized whole-brain volume; NGMV, normalized gray matter volume; NWMV, normalized white matter volume; NLVV, normalized lateral ventricle volume; NCV, normalized cortical volume; NSDGMV, normalized subcortical deep gray matter volume.
↵a The difference of the means between the groups was calculated using Student t test. The MRI volumes are presented in milliliters.
- Table 3:
Evolution of whole-brain and tissue-specific MRI measures during 5 years, split by progression status at 5 yearsa
Sustained Disease Progression (mean) (SD) (median) Stable Disease (mean) (SD) (median) P Value T2-LV (No. patients) 80 78 Absolute change 2.8 (6.3) 1.6 2.3 (3.8) 1.0 % Change 53.9 (66.7) 36.3 79.1 (156.4) 40.5 .4 Whole-brain (No. patients) 82 80 % Change −4.8 (3.4) −3.9 −2.6 (2) −2.2 <.0001 Gray matter (No. patients) 82 79 % Change −5.3 (3.1) −4.5 −3.8 (2.3) −4.1 .003 White matter (No. patients) 82 79 % Change −0.9 (3.4) −0.5 0.4 (3.1) 0.8 .06 Lateral ventricle volume, (No. patients) 82 79 % Change 26.7 (24.8) 22.6 14.9 (11.3) 13.4 .02 Cortical volume (No. patients) 80 78 % Change −5.4 (3.1) −4.9 −3.8 (2.2) −4 .001 Note:—T2-LV indicates T2-lesion volume.
↵a The difference between the groups was calculated using regression analysis adjusting for age, disease duration, and change of treatment status during the 5-year follow-up. The absolute volume changes are presented in milliliters. Variables with skewed distributions (% change in T2-LV and % change in LV) were transformed using Box-Cox transformations. The changes between baseline and follow-up scans for whole-brain, gray matter, white matter, lateral ventricle, and cortical volume were calculated using the direct-measurement technique; hence, no absolute but only percentage volume changes are available.
- Table 4:
Evolution of tissue-specific subcortical deep gray matter structures during 5 years, split by progression status at 5 yearsa
Sustained Disease Progression (mean) (SD) (median) Stable Disease (mean) (SD) (median) P Value Total SDGMV (No. patients) 81 78 Absolute change −2.5 (1.6) −2.5 −2 (1.1) −1.9 % Change −5.7 (3.8) −5.3 −4.4 (2.5) −4 .03 SDGMV structures Caudate nucleus (No. patients) 80 79 Absolute change −0.4 (0.4) −0.3 −0.3 (0.3) −0.3 % Change −5.9 (7) −5.1 −4.5 (4.6) −4.5 .3 Putamen (No. patients) 80 79 Absolute change −0.5 (0.4) −0.5 −0.4 (0.4) − 0.5 % Change −5.8 (4.2) −5.7 −4.3 (3.7) −4.5 .02 Globus pallidus (No. patients) 80 79 Absolute change −0.06 (0.02) −0.07 −0.02 (0.02) −0.02 % Change −1.8 (5.1) −2.1 −0.5 (4.5) −0.7 .99 Thalamus (No. patients) 80 79 Absolute change −0.9 (0.6) −0.8 −0.7 (0.5) −0.6 % Change −6.2 (4.4) −5.5 −4.5 (3.2) −3.9 .01 Hippocampus (No. patients) 80 79 Absolute change −0.4 (0.4) −0.4 −0.4 (0.4) −0.4 % Change −5.5 (5.5) −5.7 −5.6 (5.6) −4.8 .9 Nucleus accumbens (No. patients) 80 79 Absolute change −0.08 (0.1) −0.08 −0.09 (0.1) −0.1 % Change −7.6 (14.8) −9.1 −8.7 (11.8) −10 .1 Amygdala (No. patients) 80 79 Absolute change −0.1 (0.2) −0.2 −0.1 (0.3) −0.2 % Change −5.1 (8.3) −6.2 −4.6 (9.7) −5.8 .95 Note:—SDGMV indicates subcortical deep gray matter volume.
↵a The difference between the groups was calculated using regression analysis adjusting for age, disease duration, and change of treatment status during the 5-year follow-up. The absolute volume changes are presented in milliliters. Variables with skewed distributions (% change in globus pallidus and % change in amygdala) were transformed using Box-Cox transformations.


Jump to section
Related Articles
Cited By...
- Thalamic atrophy measured by artificial intelligence in a multicentre clinical routine real-world study is associated with disability progression
- Functional impairment of the Lateral Geniculate Nucleus in Multiple Sclerosis
- Innate Immune Cell-Related Pathology in the Thalamus Signals a Risk for Disability Progression in Multiple Sclerosis
- Damage of the lateral geniculate nucleus in MS: Assessing the missing node of the visual pathway
- A Serial 10-Year Follow-Up Study of Atrophied Brain Lesion Volume and Disability Progression in Patients with Relapsing-Remitting MS
- Fingolimod effect on gray matter, thalamus, and white matter in patients with multiple sclerosis
- MRI evaluation of thalamic volume differentiates MS from common mimics
- Longitudinal Mixed-Effect Model Analysis of the Association between Global and Tissue-Specific Brain Atrophy and Lesion Accumulation in Patients with Clinically Isolated Syndrome
- Evaluating the Effects of White Matter Multiple Sclerosis Lesions on the Volume Estimation of 6 Brain Tissue Segmentation Methods
- Correlation between brain volume loss and clinical and MRI outcomes in multiple sclerosis
- Brain atrophy and disability progression in multiple sclerosis patients: a 10-year follow-up study
- Subcortical Deep Gray Matter Pathology in Patients with Multiple Sclerosis Is Associated with White Matter Lesion Burden and Atrophy but Not with Cortical Atrophy: A Diffusion Tensor MRI Study