
Abstract
BACKGROUND AND PURPOSE: In mesial temporal lobe epilepsy, MR imaging quantification of hippocampal volume and T2 signal can improve the sensitivity for detecting hippocampal sclerosis. However, the current contributions of these analyses for the diagnosis of hippocampal sclerosis in 3T MRI are not clear. Our aim was to compare visual analysis, volumetry, and signal quantification of the hippocampus for detecting hippocampal sclerosis in 3T MRI.
MATERIALS AND METHODS: Two hundred three patients with mesial temporal lobe epilepsy defined by clinical and electroencephalogram criteria had 3T MRI visually analyzed by imaging epilepsy experts. As a second step, we performed automatic quantification of hippocampal volumes with FreeSurfer and T2 relaxometry with an in-house software. MRI of 79 healthy controls was used for comparison.
RESULTS: Visual analysis classified 125 patients (62%) as having signs of hippocampal sclerosis and 78 (38%) as having normal MRI findings. Automatic volumetry detected atrophy in 119 (95%) patients with visually detected hippocampal sclerosis and in 10 (13%) with visually normal MR imaging findings. Relaxometry analysis detected hyperintense T2 signal in 103 (82%) patients with visually detected hippocampal sclerosis and in 15 (19%) with visually normal MR imaging findings. Considered together, volumetry plus relaxometry detected signs of hippocampal sclerosis in all except 1 (99%) patient with visually detected hippocampal sclerosis and in 22 (28%) with visually normal MR imaging findings.
CONCLUSIONS: In 3T MRI visually inspected by experts, quantification of hippocampal volume and signal can increase the detection of hippocampal sclerosis in 28% of patients with mesial temporal lobe epilepsy.
ABBREVIATIONS:
- EEG
- electroencephalography
- HS
- hippocampal sclerosis
- MTLE
- mesial temporal lobe epilepsy
Mesial temporal lobe epilepsy (MTLE) is the most common form of epilepsy in adults.1 Although hippocampal sclerosis (HS) is the main pathologic substrate in patients with MTLE, there are several other causes and some patients may have normal MR imaging findings and no specific histopathologic changes detected postoperatively.1,2 HS can be reliably detected on MRI,2 and quantitative analysis of hippocampal formation improves the sensitivity for detecting this pathology.3,4 With advances in the MR imaging field in the past decades, the current contributions of these postprocessing MR imaging tools for the detection of hippocampal pathology, especially in tertiary epilepsy centers, are not clear.
The histopathology of HS is characterized by loss of specific neurons and synaptic reorganization of surviving cells,5 and in MR images, this is observed as volume reduction and signal hyperintensity in T2 images.6,7 Quantification of hippocampal volume has advantages over visual analysis for the detection of subtle and bilateral hippocampal abnormalities.2,8 Equally, the quantification of hippocampal T2 signal, especially with relaxometry, can improve the MR imaging diagnosis of HS.9,10 Both volume and hippocampal signal quantification measurements have good correlation with histopathologic findings of HS.4
Currently, these techniques are considered reliable and reproducible for the detection of hippocampal pathology.11 However, hippocampal volumetry by manual segmentation is time-consuming and depends on the expertise of the examiner. These 2 features have limited its use in clinical practice. Recently automatic analyses have been shown to be promising; however, there are few studies comparing their efficacy with the visual analyses of high-quality MR imaging by experts in the field.12,13
Although it is clear that in studies with 1.5T MR imaging, volumetry and relaxometry have significantly higher sensitivity than the qualitative analysis of MR imaging,8,9 today most epilepsy centers work with 3T MRI and specific epilepsy protocols, which make the determination of MR imaging signs of HS by visual analysis easier and more accurate.14 It has been reported that there is no difference in the hippocampal volume measures of 1.5 and 3T15,16 and that quantitative measures in 3T MRI can demonstrate ultrastructural details of HS pathology not detectable with lower field scanners.17 Once the sensitivity to visually detect signs of HS at 3T is higher,14 the question that remains is whether the use of hippocampal measurements in these higher field MRIs still adds information to the clinical practice.
In this study, we aimed to evaluate whether the quantification of hippocampal volume and T2 signal in MRI acquired at 3T has a higher sensitivity in detecting MR imaging signs of HS than the visual analysis of these images by epilepsy imaging experts. Our hypothesis was that though the scanners with higher field and specific epilepsy protocols have improved the visual detection of MR imaging signs of HS, the use of techniques to measure the abnormal hippocampal volume and T2 signal can still further improve the detection of HS in patients with otherwise normal MRI findings.
Materials and Methods
Patients
This was a prospective study of patients followed at the Epilepsy Clinic of University of Campinas with a clinical and electroencephalographic diagnosis of MTLE according to International League Against Epilepsy criteria,18 who consecutively underwent 3T MRI between August 2009 and April 2012. An informed consent form approved by the Ethics Committee of Universidade Estadual de Campinas was signed by all patients before acquisition of MR imaging. Patients with symptomatic MTLE due to lesions other that HS (tumor, vascular malformations, gliosis, focal cortical dysplasia) were excluded.
MR Imaging Epilepsy Protocol and Visual Analysis
All patients underwent an MR imaging epilepsy protocol with a 3T Intera Achieva scanner (Philips Healthcare, Best, the Netherlands), which included the following:
Coronal images perpendicular to the long axis of the hippocampus, defined at the sagittal image: 1) T2WI multiecho (3-mm-thick, no gap, voxel size = 0.89 × 1 × 3 mm, TR = 3300 ms, TE = 30/60/90/120/150 ms, matrix = 200 × 180, FOV = 180 × 180, TSE factor = 5; EPI factor = 5, flip angle = 90°); 2) T1WI inversion recovery (3-mm-thick, no gap, voxel size = 0.75 × 0.75 × 3 mm, TR = 3550 ms, TE = 15 ms, TI = 400 ms, matrix = 240 × 229, FOV = 180 × 180, TSE factor = 7), 3) FLAIR (fat-suppressed = spectral-attenuated inversion recovery, fat-suppressed power = 1, four-mm-thick, section gap = 1 mm, voxel size = 0.89 × 1.1 × 2.4 mm, TR = 12,000 ms, TE = 140 ms, TI = 2850 ms, matrix = 180 × 440, FOV = 200 × 200).
Axial images parallel to the long axis of the hippocampus: FLAIR (fat-suppressed = spectral-attenuated inversion recovery, fat-suppressed power = 1, four-mm-thick, section gap = 1 mm, voxel size = 0.89 × 1.1 × 2.4 mm, TR = 12,000 ms, TE = 140 ms, TI= 2850 ms, matrix = 224 × 160, FOV = 200 × 200).
T1WI volume: isotropic voxels of 1 mm, acquired in the sagittal plane (1-mm-thick, no gap, flip angle = 8°, TR = 7.0 ms, TE = 3.2 ms, matrix = 240 × 240, FOV = 240 × 240).
T2WI volume: isotropic voxels of 1.5 mm, acquired in the sagittal plane (no gap, TR = 1800 ms, TE = 340 ms, matrix = 140 × 140, FOV = 230 × 230, TSE factor = 120; flip angle = 90°; geometry-corrected).
MR imaging sequences were corrected for gradient nonlinearity during the reconstruction step in the scanner.
As a first step, MRI was visually analyzed by 2 epilepsy imaging experts (A.C.C. and F.C.) and the images were classified as having normal findings or signs of HS. Classic signs of HS were as follows: reduction of volume and abnormal shape observed on T1 images and increased signal observed in T2 and FLAIR images. Images were carefully examined by the investigators in light of the clinical and electroencephalography (EEG) data of each patient because this routine of MR imaging evaluation for the investigation of focal epilepsies is used in most epilepsy centers. Special attention was given to rule out subtle signs of focal cortical dysplasia, such as sulcal morphology abnormalities, focal increase of cortical thickness, FLAIR focal signal hyperintensities, or small transmantle signs.
Hippocampal Volumetry
As the second step, quantification of hippocampal volume and signal was performed. A group of 79 healthy controls (with similar age and sex distribution) was used for comparison (60% female; median age, 42 years; range, 21–70 years). Automatic volumetric analysis was performed with FreeSurfer software (Version 5.1.0; http://surfer.nmr.mgh.harvard.edu) by using T1WI volume. Hippocampal volumes were corrected for individual brain (supratentorial) volumes, and corrected hippocampal volumes smaller than 2 SDs (absolute value and/or asymmetry index, defined by the ratio of the smaller over the larger hippocampus of each individual) from the mean of controls were considered as having atrophy.
Hippocampal Signal Quantification
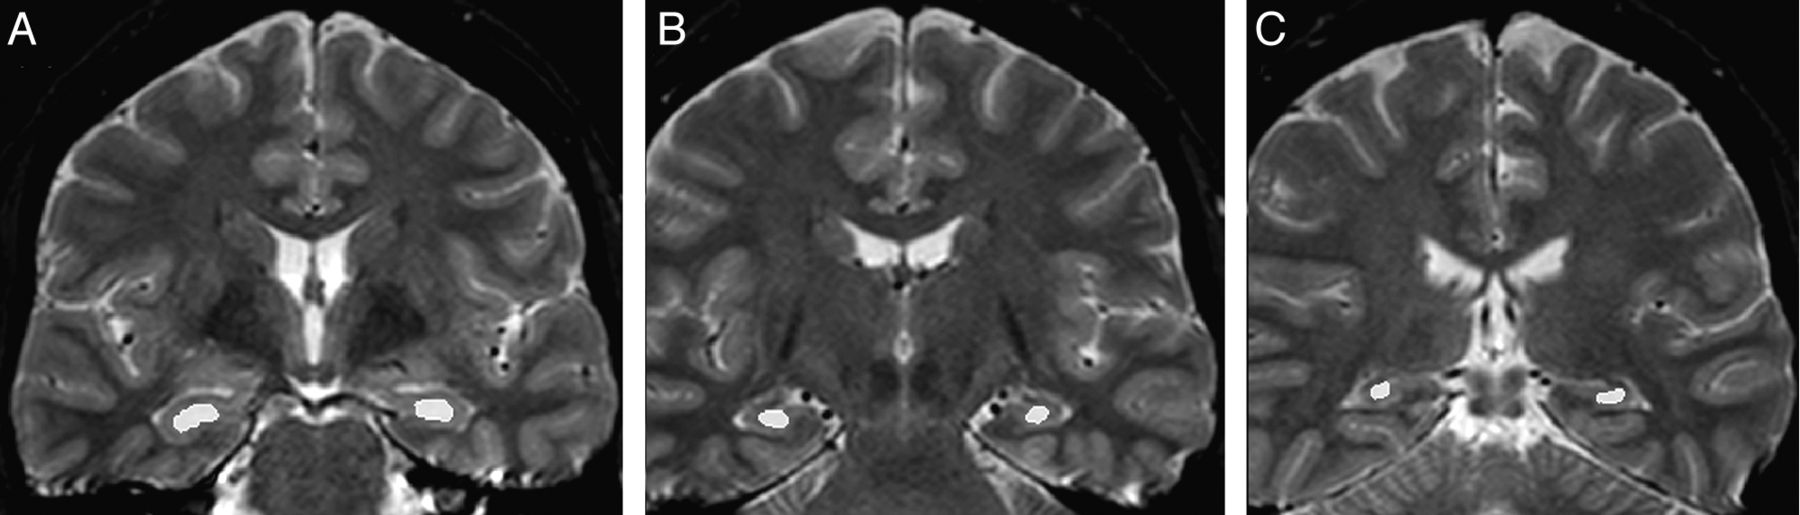
For signal quantification, we used relaxometry analysis of T2 multiecho images (3-mm sections, TR = 3300, TE = 30/60/90/120/150 ms, matrix = 200 × 176, FOV = 1802 × 180) with Aftervoxel, a medical image visualization tool written by Felipe Bergo (http://www.liv.ic.unicamp.br/∼bergo/aftervoxel). For this analysis, a region of interest was manually defined in 3 different MR imaging sections, including the hippocampus of each individual (1 in the head, 1 in the body, and 1 in the tail of the hippocampus) by an investigator blinded to the results of the MR imaging visual evaluation (B.K.). To make the ROI placement more consistent among patients, we defined the section of the hippocampus head as the first in which it was possible to see the temporal horn of the lateral ventricle and therefore to appropriately separate the hippocampal formation from the amygdala. The body of the hippocampus was defined in the fourth coronal section after the region of interest of the hippocampus head, and the tail was defined in the third coronal section after the hippocampus body, in which it was also possible to visualize the quadrigeminal plate. The ROIs were manually drawn to include the larger area of the hippocampus in that section but also to carefully avoid contamination of the hippocampal signal with CSF signal (Fig 1). The mean T2 signal from the 3 sections of each hippocampus was used as the final measurement. Hippocampal signal values higher than 2 SDs from the mean of the control group composed of the same individuals in the volumetry analysis (absolute value and/or asymmetry index, defined by the ratio of higher and lower hippocampal signals of each individual) were considered hyperintense signal.

T2 relaxometry in Aftervoxel software. Example of regions of interest manually defined in the head (A), body (B), and tail (C) of the hippocampus of a patient with MTLE.
Results
Two hundred seventeen patients fulfilled the inclusion criteria. However, after detailed MR imaging visual analysis, 14 patients were thought to have subtle signs of focal cortical dysplasia and were excluded. The final group was then composed of 203 patients (129 female, 74 male; median age, 46 years; range, 17–74 years). There was no difference in sex or age distribution between patients and controls (Sex, χ2, P = .527; age, t test, P = .072). According to ictal and interictal scalp EEG, 184 patients had unilateral temporal epileptic focus (117 left MTLE and 67 right MTLE) and 19 had bitemporal epileptic focus.
In this group, 176 (87%) patients had drug-resistant seizures, while 27 (13%) had been free of seizures for at least 2 years.
MR Imaging Visual Analysis
MR imaging visual analysis detected 125 (62%) patients with signs of HS (62 left, 54 right, 6 bilateral with left-sided predominance, 3 bilateral with right-sided predominance). For the remaining 78 (38%) patients, MRI had normal findings by visual analyses. Although the qualitative analysis detected signs of hippocampal sclerosis in 62% of patients, one cannot say in how many it failed to detect HS because the remaining 38% of patients may or may not have had HS in their histology, even though they all had MTLE.
Concordance of MR Imaging Visual Analysis and the EEG Epileptic Focus
From the 125 patients with MTLE with HS signs detected by visual analysis, 117 had unilateral epileptic focus (defined by ictal and interictal EEG); in 88% (103/117), the side of signs with HS was concordant with the epileptic focus, and it was contralateral in 7.5% (9/117). In the remaining 4% (5/117), the MR imaging signs of HS were bilateral and symmetric.
MR Imaging Quantification Analysis
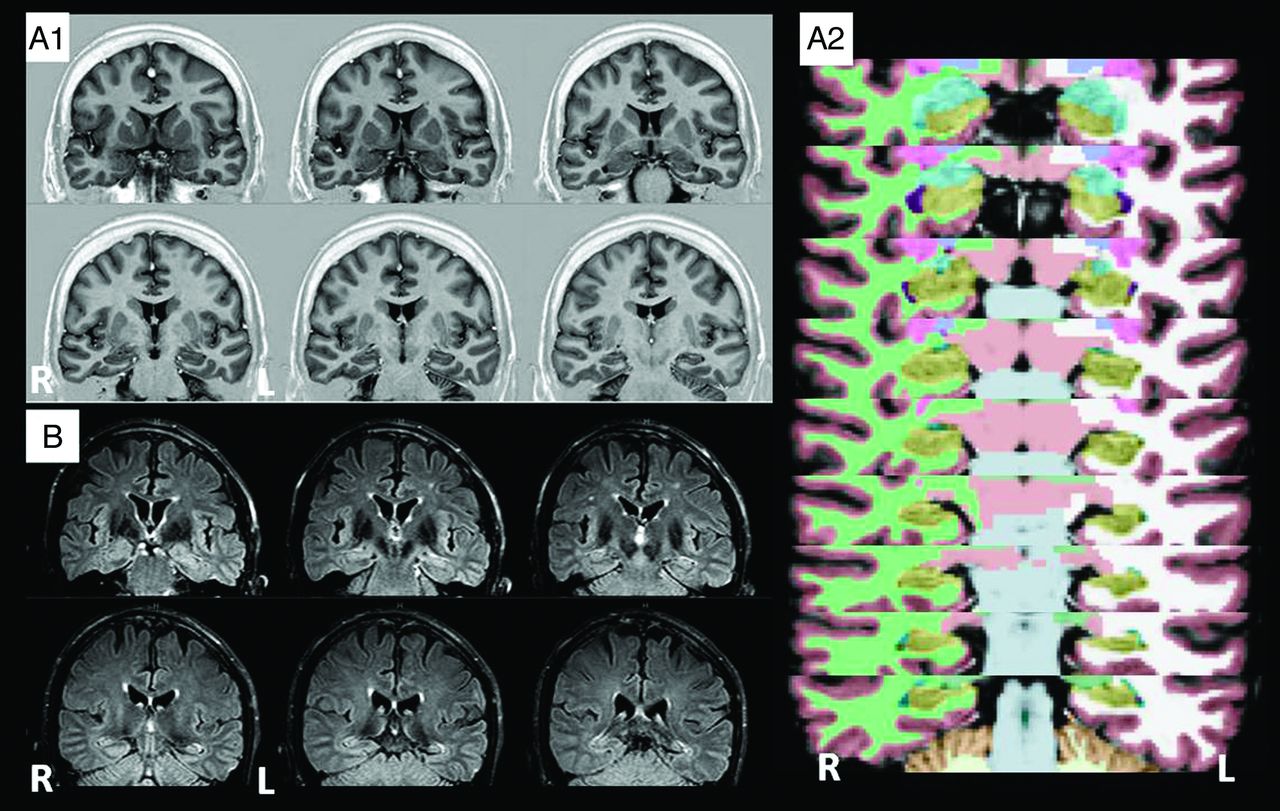
Automatic volumetry analysis detected hippocampal atrophy in 119 (95%) patients with visual signs of HS and in 10 (13%) patients with visually normal MR imaging findings. Relaxometry detected hyperintense T2 signal in 103 (82%) patients with visual signs of HS and in 15 (19%) patients with visually normal MR imaging findings (Fig 2). Considered together, volumetry plus relaxometry detected signs of HS in all except 1 (124; 99%) patient with visual signs of HS and in 22 (28%) patients with visually normal MR imaging findings (Table). Therefore, the use of combined hippocampal volumetry and T2 relaxometry increased the sensitivity to detect MR imaging signs of HS in 28% compared with visual analysis.

MR imaging signs of HS detected by quantification analysis. Examples of 2 patients with normal MR imaging findings by visual analysis and HS signs detected by quantification techniques. A, A 67-year-old male patient, with MTLE and left EEG seizure focus. His seizures started at 5 years of age and were characterized by an aura described as jamais vu followed by a hipometer complex partial seizure. MR imaging volumetry detected significant left reduced hippocampal volume. A1, T1WI in which both hippocampi were considered normal by visual analysis. A2, FreeSurfer volumetry images in which the hippocampi are shown in yellow. Corrected volume of the left hippocampus: 3.50 cm3 (z score = −2.20 SDs). B, A 28-year-old male patient with MTLE and left seizure focus. His seizures started at 11 years of age and were characterized by an aura described as fear and an epigastric sensation followed by loss of consciousness and manual automatisms. MR imaging T2 relaxometry detected significant left increased hippocampal signal. Left hippocampus T2 signal: 111.40 (z score = 3.52 SDs).
3T MRI signs of HS detected by visual or quantification analysisa
Volumetry detected bilateral hippocampal atrophy in 9 patients (8 with visual signs of HS and 1 with visually normal MR imaging findings). Relaxometry detected bilateral hippocampal hyperintense signal in 22 patients (20 with visual signs of HS and 2 with visually normal MR imaging findings). In patients who had bilateral hippocampal abnormalities detected by the quantifications methods, there was marked asymmetry.
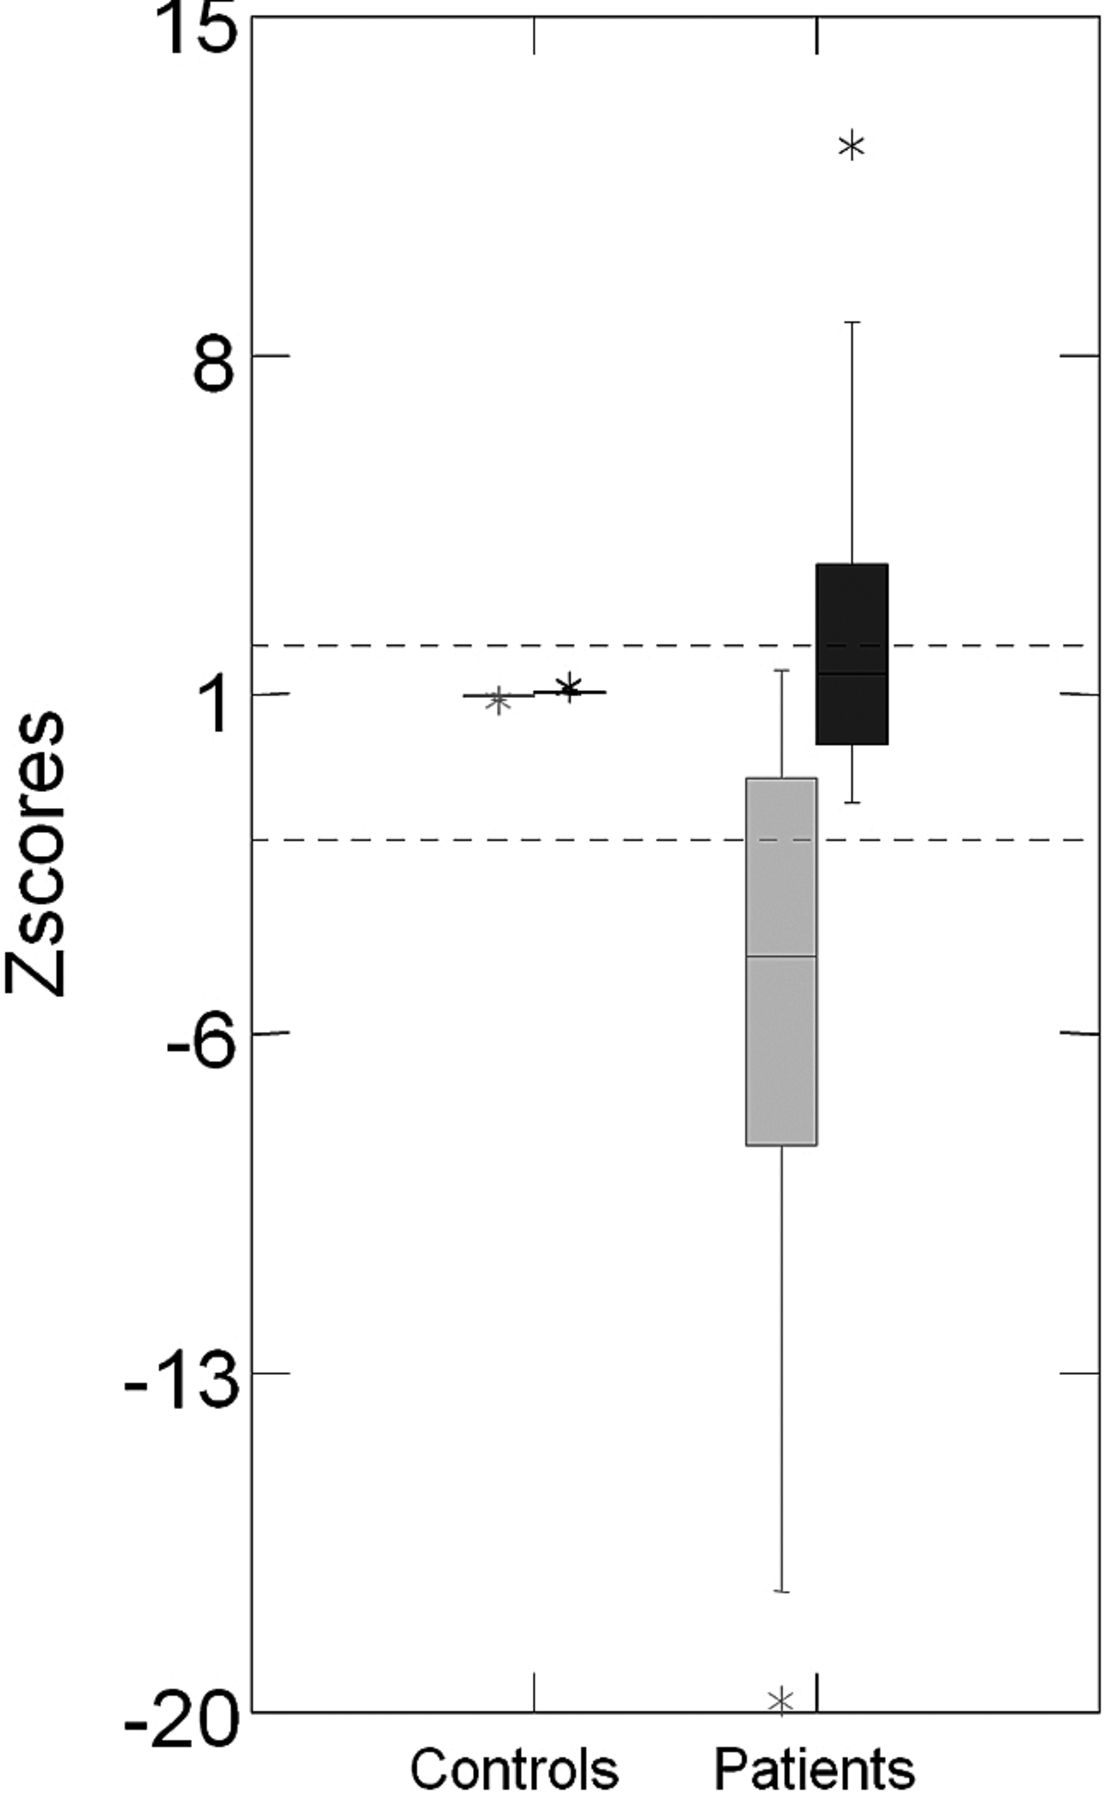
The laterality of the hippocampal abnormality detected by both absolute values and the asymmetry index in volumetry and T2 relaxometry analysis was concordant in all cases. The asymmetry index had a higher sensitivity to detect the hippocampal volume reduction (76% [98 patients] had significant hippocampal volume reduction detected by the absolute volume and 98% [126 patients] were detected by asymmetry index) and a lower sensitivity to detect T2 hyperintense signal (92% [109 patients] with significant hippocampal T2 hyperintense signal detected by the absolute volume and 70% [82 patients] detected by asymmetry index). The distribution of the hippocampal asymmetry index for volumetry and T2 relaxometry in patients and controls is shown in Fig 3.

Z score distribution of the hippocampal asymmetry index for volumetry and T2 relaxometry analyses. On the left side is the boxplot graphic of z scores of the volumetry asymmetry index (gray) and T2 relaxometry asymmetry index (black) of controls. On the right side is the boxplot graphic of z scores of the volumetry asymmetry index (gray) and T2 relaxometry asymmetry index (black) of patients with MTLE.
Figure 4 demonstrates the z score distribution of hippocampal volumes and T2 signal in controls (right and left hippocampus) and patients (hippocampi ipsi- and contralateral to the epileptic focus).

Z score distribution of hippocampal volumes and T2 signal in patients with MTLE and controls. A, Boxplot graphic shows z scores of hippocampal volumetry for controls and patients with MTLE. On the left side of the graphic are shown the hippocampal volumes of controls (white circles = right hippocampi; mean volume, 4.28 ± 0.35 cm3; black triangles = left hippocampi; mean volume, 4.21 ± 0.32 cm3). On the right side of the graphic are shown the hippocampal volumes of patients (white circles = hippocampi ipsilateral to the epileptic focus; mean volume, 3.78 ± 0.51 cm3; black triangles = hippocampi contralateral to the epileptic focus; mean volume, 4.28 3± 0.56 cm). B, Boxplot graphic shows z scores of hippocampal T2 relaxometry for controls and patients with MTLE. On the left side of the graphic is the hippocampal T2 signal of controls (white circles = right hippocampi; mean signal, 96.77 ± 4.05; black triangles = left hippocampi; mean signal, 96.98 ± 4.10). On the right side of the graphic is the hippocampal T2 signal of patients (white circles = hippocampi ipsilateral to the epileptic focus; mean signal, 105.49 ± 7.88; black triangles = hippocampi contralateral to the epileptic focus; mean signal, 99.10 ± 5.01).
Concordance of MR Imaging Visual and Quantification Analysis
The side of the HS detected by MR imaging visual and volumetry analysis was concordant in all except 1 case (118/119, 99%). The patient with discordant volumetry and MR imaging visual analysis had a subtle hippocampal atrophy and clear hyperintense T2 signal on the left hippocampus by visual analysis, which was concordant with the T2 relaxometry.
The side of the abnormal hippocampal signal detected by relaxometry was concordant with the visual analysis in 96% (99/103). In the remaining 4 patients, 2 had bilateral asymmetric hippocampal abnormalities on visual analyses and the relaxometry lateralized to the side with less hippocampal atrophy by both visual and automatic volumetry, and the other 2 patients had unilateral hippocampal atrophy (concordant by visual and automatic volumetry) and the relaxometry lateralized to the side contralateral to the atrophy and hyperintense T2 signal defined by visual analysis.
Concordance of MR Imaging Quantification Analysis and the EEG Epileptic Focus
From the 129 patients with MTLE with hippocampal atrophy detected by volumetry, 120 had unilateral epileptic focus (defined by ictal and interictal EEG) and in 95% (114/120) the side of epileptic focus was correctly lateralized by volumetry. From the 118 patients with MTLE with hippocampal T2 signal hyperintensity detected by relaxometry, 106 had unilateral epileptic focus and in 94% (100/106) the side of epileptic focus was correctly lateralized by volumetry.
There was no significant difference in the frequency of concordance of signs of HS or hippocampal atrophy detected by visual analysis with the side of the epileptic focus (88% of concordance by visual analyses and 95% of concordance by volumetry analysis, χ2, P = .054) and no difference in the frequency of concordance of visual signs of HS or hippocampal hyperintense signal detected by relaxometry with the side of the epileptic focus (88% of concordance by visual analyses and 94% of concordance by relaxometry analysis, χ2, P = .099). The small additional gain of the quantification analyses was secondary to better discrimination of the bilateral hippocampal abnormalities.
Concordance of Histopathology and MR Imaging Visual and Quantification Analyses
Nineteen patients (10%) underwent surgical treatment (anterior temporal lobectomy or selective amygdalohippocampectomy) due to refractory seizures. Of those, all except 1 individual had confirmed histopathology of HS. In patients with a histopathology of HS, visual analysis and volumetry detected abnormal hippocampi in all cases and relaxometry detected hyperintense signal in 15/18 (83%) patients. The patient with a normal hippocampus on histology had no signs of HS detected by either visual or quantitative methods.
Discussion
The detection of MR imaging signs of HS can help to define seizure etiology and to indicate surgical treatment for patients with drug-resistant MTLE. We demonstrated here that even in 3T MRI analyzed in tertiary centers by epilepsy experts, hippocampal volume and signal quantification can significantly improve the detection of signs of HS in patients with otherwise normal MRI findings by using an epilepsy protocol.
MR imaging has significantly improved the detection of pathologies related to epilepsy.19 It is safe, noninvasive, and widely available in epilepsy centers. However, a variable but significant number of patients with focal epilepsies have normal MRI findings and unknown seizure etiology.20⇓⇓⇓–24
From the beginning of MR imaging use in epilepsy, special attention has been given to HS because it is the main pathologic feature associated with the most common epilepsy in adults.1 Hippocampal volume and signal have been used for research purposes but also in epilepsy clinics to help in the evaluation of drug-resistant focal epilepsies. Quantification of hippocampal volume and signal in MRI cannot only detect signs of HS but can consistently help to lateralize the seizure focus in patients with MTLE who are surgical candidates.8 For these individuals, the prognosis of surgical resection of the temporal lobe ipsilateral to HS detected by MRI is excellent.21 Today, most of the tertiary epilepsy centers have 3T MRI available and visual signs of HS have been more easily detected.14 In this context, the contribution of MR imaging quantification methods to detect HS in 3T MRI has not been previously evaluated. Here we demonstrated that with 3T MRI, adequate epilepsy protocols, and expert visual evaluation, quantification analysis can still improve the detection of subtle signs of HS in 28% of patients.
The detection of more subtle MR imaging abnormalities in patients with focal epilepsies depends on both the quality of MR imaging acquisition protocol and the experience of the examiner in reading MRIs of patients with epilepsy. A previous study 20 showed that “nonexperts” reported 61% of standard MR imaging as having normal findings or as showing no focal abnormality, while epilepsy “expert” examiner reassessments of the same standard MRIs classified 28% of these scans as technically inadequate and considered only 22% of these standard MR imaging scans as having normal findings. More important, by using a dedicated epilepsy MR imaging protocol, the same group of “experts” described focal MR imaging abnormalities in 91% of the same group of patients (they did not include hippocampal volumetry or T2 relaxometry).20 Also, in this context, MRIs are always evaluated in the light of clinical, neuropsychological, and EEG data. In this article, we reproduced this optimal visual evaluation of MRI in patients with MTLE: Two epileptologists with expertise in MR imaging evaluation of patients with focal epilepsies reviewed the images of all patients (acquired with an extensive epilepsy protocol) in the context of clinical and EEG data. Even in this most favorable circumstance, quantification of hippocampal volume and signal significantly increased the detection of signs of HS.
In our series, only 1 patient with visual signs of HS had normal volumetry and signal quantification. In this patient, by visual analysis, we observed normal hippocampal volume and a localized hyperintense signal in the body of the hippocampus, contralateral to the epileptic focus determined by EEG. This pattern of subtle and localized hippocampal abnormality (restricted to the hippocampal body) is not commonly seen. We believe that this discordance could be overcome if more sections of the coronal MR imaging sequence were added to the relaxometry analysis. However, this addition would add time to the procedure and would probably result in limited improvement in the detection rate (<1%).
The increase of patients with detectable MR imaging abnormalities compatible with the site of the seizure-onset origin is significantly important for drug-resistant focal epilepsies. With quantitative analysis of 1.5T MRI, a group of patients with MTLE remains with no detectable structural abnormalities even when HS is confirmed after surgical removal of the mesial temporal structures.22 For patients with drug-resistant MTLE and normal MR imaging findings, invasive procedures, which have high cost and morbidity, are often necessary to evaluate the potential target for surgical intervention,23 and yet for these individuals, the rate of seizure freedom is lower than that for those with MRI signs of HS.24,25 Histopathology of HS is only found in a limited number of patients with MTLE with normal MR imaging findings undergoing surgery, but those with positive hippocampal pathology are the ones with better surgical outcomes.24,26 It is necessary to improve noninvasive techniques that could more efficiently select the individuals with MTLE with subtle HS to better select surgical patients and improve outcomes. In this context, we believe that the use of hippocampal quantification measures in 3T MRI, as we showed in this article, can help in the recognition of these individuals with hippocampal sclerosis not detected by visual analysis who could benefit from surgical procedures for control of drug-resistant seizures. The complete benefit of the use of hippocampal quantification measurements in 3T MRI in the presurgical evaluation of patients with drug-resistant MTLE could be assessed with follow-up and surgical outcome data of these patients.
In this study, we were not able to satisfactorily determine the specificity of the quantification procedures in the detection of HS. To achieve this goal, a correlation of these findings with the criterion standard, histopathology, would be necessary. We were only able to evaluate the histopathologic findings in 10% (19 patients) of our group. In the sample of our patients undergoing surgery, the specificity of hippocampal volumetry and T2 signal quantification was 100% (all patients with abnormal hippocampal volume or T2 signal had confirmed histopathology of HS, and the only patient with a normal hippocampus by these quantification techniques had normal histopathology). However, this specificity is biased because all patients who underwent surgery in our group had similar findings in both visual and quantification analysis, and the visual analysis was used in the selection of the patients for the surgical procedure. However, a good correlation of volume and signal abnormalities detected by quantification analysis and histopathology of HS has been previously demonstrated.27 Also, in our group of patients, the laterality of abnormal hippocampal volume and signal was highly concordant with the laterality of the epileptic focus defined by EEG recordings.
Currently, most studies of hippocampal volumetry apply manual hippocampal delimitation, and whether manual28 or automatic analysis has higher sensitivity and specificity is still debatable.12,13 Despite this controversy, in the clinical context, the quantification of hippocampal abnormalities must be as fast and practical as possible. In this article, we used automated volumetry and a simple manual signal quantification in which it is necessary only to define a small region of interest in 3 sections of the T2 scan of each patient, without the need to define precisely the borders of the hippocampus. We think that this optimized hippocampal quantification protocol can be easily applied to all patients with drug-resistant focal epilepsies as a parallel and additional analysis for the routine evaluation of MRI in specialized epilepsy centers. Although FreeSurfer software is not approved for clinical use by the US Food and Drug Administration, as far as we know, there is at least 1 software approved for automated volumetric analyses of brain MRI.27 However, this has only been evaluated for the detection of hippocampal abnormalities on 1.5T scanners.13
In 1.5T MRI, a good correlation of volume and signal abnormalities detected by quantification analysis and histopathology of HS has been demonstrated.29 More recently, histologic studies have proposed that different patterns of neuronal loss in the hippocampus might be associated with different seizure outcome after surgical removal of the temporal lobe.30 Also, it has been shown that quantitative measures in 3T MRI can demonstrate ultrastructural details of HS pathology not detectable with lower field scanners.17,31 These in vivo quantitative measurements of this detailed HS pathology on 3T MR imaging scanners might contribute, in the future, to the better selection of patients with drug-resistant MTLE who will benefit from surgical procedures.
Conclusions
In MRI performed with a 3T scanner and visually inspected by imaging experts, quantification of hippocampal volume and T2 signal can increase the detection of signs of HS in approximately 28% of patients with MTLE. Today, these MR imaging quantification methods are easily available and not very time-consuming, and they could be used as routine diagnostic tools for patients with drug-resistant focal epilepsies and visually normal MRI findings after further validation for clinical use.
Footnotes
Disclosures: Ana C. Coan—RELATED: Grant: Fundação de Amparo à Pesquisa do Estado de São Paulo (FAPESP) (São Paulo Research Foundation), Comments: PhD scholarship, UNRELATED: Payment for Lectures (including service on Speakers Bureaus): Novartis. Bruno Kubota—RELATED: Grant: FAPESP, Comments: scientific scholarship. Felipe P.G. Bergo—RELATED: Grant: FAPESP, Comments: Postdoctoral scholarship funding from a government agency. Postdoctoral project includes the subject of this study but is not limited to it, UNRELATED: Grants/Grants Pending: FAPESP. Fernando Cendes—RELATED: Grants: FAPESP and Conselho Nacional de Desenvolvimento Científico e Tecnológico, Brazil,* Comments: FAPESP grants 2005/56578-four and 2009/54552–9. *Money paid to the institution.
Ana C. Coan was responsible for the study concept and design, patient selection and recruitment, MRI visual analysis, interpretation of the data, and manuscript writing. Bruno Kubota contributed the relaxometry analysis; Felipe Bergo, volumetry analysis; Brunno M. Campos, patient recruitment and volumetry analysis; Fernando Cendes, study concept and design, review of patient selection, MRI visual analysis, interpretation of the data, manuscript writing, and reviewing.
This study was funded by São Paulo Research Foundation, grants 2005/56578-4 and 2009/54552-9. Dr Cendes received support from Conselho Nacional de Desenvolvimento Científico e Tecnológico, Brazil.
Indicates open access to non-subscribers at www.ajnr.org
REFERENCES
- Received January 28, 2013.
- Accepted after revision April 10, 2013.
- © 2014 by American Journal of Neuroradiology


Jump to section
Related Articles
Cited By...
- Subcortical Gray Matter Volume Abnormalities in Temporal Lobe Epilepsy with Hippocampal Atrophy
- Brain imaging in epilepsy
- Voxel-Based Morphometry--from Hype to Hope. A Study on Hippocampal Atrophy in Mesial Temporal Lobe Epilepsy
- Default Mode Network in Temporal Lobe epilepsy: interactions with memory performance
- The Effect of Electroencephalography Leads on Image Quality in Cerebral Perfusion SPECT and 18F-FDG PET/CT
- Epilepsy and Magnetic Resonance Imaging
- Mesial Temporal Sclerosis: Accuracy of NeuroQuant versus Neuroradiologist