
Abstract
BACKGROUND AND PURPOSE: Pulsed arterial spin-labeling is a noninvasive MR imaging perfusion method performed with the use of water in the arterial blood as an endogenous contrast agent. The purpose of this study was to determine the inversion time with the largest difference in normalized intratumoral signal intensity between high-grade and low-grade astrocytomas.
MATERIALS AND METHODS: Thirty-three patients with gliomas, histologically classified as low-grade (n = 7) or high-grade astrocytomas (n = 26) according to the World Health Organization brain tumor classification, were included. A 3T MR scanner was used to perform pulsed arterial spin-labeling measurements at 8 different inversion times (370 ms, 614 ms, 864 ms, 1114 ms, 1364 ms, 1614 ms, 1864 ms, and 2114 ms). Normalized intratumoral signal intensity was calculated, which was defined by the signal intensity ratio of the tumor and the contralateral normal brain tissue for all fixed inversion times. A 3-way mixed ANOVA was used to reveal potential differences in the normalized vascular intratumoral signal intensity between high-grade and low-grade astrocytomas.
RESULTS: The difference in normalized vascular intratumoral signal intensity between high-grade and low-grade astrocytomas obtained the most statistically significant results at 370 ms (P = .003, other P values ranged from .012–.955).
CONCLUSIONS: The inversion time by which to differentiate high-grade and low-grade astrocytomas by use of normalized vascular intratumoral signal intensity was 370 ms in our study. The normalized vascular intratumoral signal intensity values at this inversion time mainly reflect the labeled intra-arterial blood bolus and therefore could be referred to as normalized vascular intratumoral signal intensity. Our data indicate that the use of normalized vascular intratumoral signal intensity values allows differentiation between low-grade and high-grade astrocytomas and thus may serve as a new, noninvasive marker for astrocytoma grading.
ABBREVIATIONS:
- ASL
- arterial spin-labeling
- nITS
- normalized intratumoral signal intensity
- nVITS
- normalized vascular intratumoral signal intensity
- PASL
- pulsed arterial spin-labeling
- PICORE
- proximal inversion with a control for off-resonance effects
- ROC
- receiver operating characteristic
- WHO
- World Health Organization
Gliomas are the most frequently occurring primary brain tumors in adults. More than three-quarters of all glial tumors show astrocytic features.1,2 Grading of astrocytic tumors is important to establish optimal therapy planning and to determine the prognosis.3 According to the World Health Organization (WHO) classification, diffuse astrocytic gliomas are divided into 3 categories, on the basis of the grade of malignancy: diffuse astrocytomas (WHO grade II); anaplastic astrocytomas (WHO grade III); and glioblastomas (WHO grade IV). This histopathologic categorization relies on histologic features, including cell attenuation, nuclear atypia, mitotic activity, necrosis, and neovascularization.4 Diffuse astrocytomas are considered low-grade gliomas, whereas anaplastic astrocytomas and glioblastomas are considered high-grade gliomas.
The differentiation of high-grade versus low-grade astrocytic neoplasms by use of conventional MR imaging with gadolinium-based contrast medium is still the reference standard in the routine clinical setting. However, this technique alone can sometimes be difficult because contrast media enhancement reflects the disruption of the blood-brain barrier rather than an assessment of tumor vascularity. Therefore, advanced MR techniques, such as MR perfusion, have also come to play an increasingly important role in glial brain tumor diagnosis. The reference standard for the evaluation of tumor perfusion is dynamic susceptibility contrast perfusion imaging.5,6 This technique is able to assess, among other values, CBV and CBF simultaneously. Previous studies have shown that optimization of this technique, by use of preload dosing or baseline subtraction techniques, could maximize CBV accuracy.7
One of the disadvantages of the dynamic susceptibility contrast imaging technique is that it relies on the intravenous application of contrast media. This is primarily a challenge for people with allergic reactions to contrast media.
Arterial spin-labeling (ASL) is an MR imaging technique that allows for a quantitative determination of tissue blood flow values without the need for the administration of contrast agents, thus offering a noninvasive MR imaging perfusion sequence for the generation of cerebral perfusion maps. This method takes advantage of the fact that water protons of the arterial blood in the feeding vasculature of the brain are magnetically labeled and used as an endogenous tracer. After a certain inversion time, the labeled blood arrives at the image plane in which the image is acquired. Conventional ASL techniques are characterized by a moderate spatial and temporal resolution; however, the increased clinical availability of high-field MR scanners has helped to increase the SNR. ASL benefits from higher field strengths because of the increased perfusion-weighted signal caused by higher SNR and the prolonged T1-relaxation times at higher field strengths, allowing for longer inflow and imaging times.8 Thus, this technique can be easily included in routine diagnostic MR imaging. ASL perfusion measurements have been shown to have a high test-retest reliability.9 In addition, ASL data were characterized as a reliable alternative to invasive measurement techniques, such as dynamic susceptibility MR imaging perfusion10⇓⇓⇓–14 and positron-emission tomography.15 There are also some weaknesses of this perfusion technique. First, pulsed arterial spin-labeling (PASL) sequences usually involve long acquisition times. For extended multimodal tumor MR imaging protocols, the acquisition time of each sequence should be as short as possible, in terms of patient care. Another important shortcoming for ASL perfusion is the dependency of the perfusion signal on the inversion time. Previous studies reported that tumor-brain blood flow ratios determined by arterial spin-labeling were markedly greater than those obtained with dynamic susceptibility-weighted contrast-enhanced MR imaging.11 This is probably caused by the underestimation of perfusion in brain regions with long arterial transit times, for example, white matter. The use of higher inversion times would overcome these limitations; however, this would conversely lead to a decrease in the SNR caused by the rapid decay of the ASL perfusion signal over time.
Typically, an ASL measurement is conducted at a single inversion time, on the basis of the T1 decay of blood, which is approximately 1200 ms at 1.5T and 1600 ms at 3T.16,17 With the use of this single inversion time, recent studies have indicated that the increase in tumor perfusion correlates with the tumor grade in gliomas.11,18 However, the selected inversion times of those studies were related to normal rather than tumorous brain tissue.
In the present study, a multiple–inversion time PASL approach was used to track the labeled bolus dynamically over time. The purpose of this study was to determine the inversion time with the largest differences in normalized intratumoral signal intensity between high-grade and low-grade astrocytomas, offering a totally noninvasive and fast tool for glioma grading.
Materials and Methods
Patient Population
Thirty-three patients (14 women, 19 men; mean age = 54 years; standard deviation = 16.5 years; range = 20–84 years) with new-onset astrocytomas were consecutively included into this prospective study, from September 2009 to January 2012. The local institutional ethics review board approved the study. Written informed consent was obtained from all patients after the nature, scope, and possible consequences of the examination had been explained to them. The study was performed in accordance with the guidelines of the Declaration of Helsinki, including current revisions. All patients had a prior conventional MR imaging examination in which a glial tumor was suspected. Because of the known different perfusion pattern of oligodendrogliomas,19 all astrocytic neoplasms with histologic oligodendroglial features were excluded.
Data Acquisition
All MR imaging examinations were performed on a whole-body 3T Trio system (Siemens, Erlangen, Germany), with actively shielded imaging gradients, in conjunction with an 8-channel head coil.
Patients were scanned in the supine position, without the administration of any kind of sedative. Patients were asked to avoid any movements, especially head movements, during the whole scan time, and padding was arranged around the subject's head to minimize movements.
All patients underwent a standard conventional MR examination for tumor detection, localization, and expansion, including an axial T2-weighted turbo-inversion recovery-magnitude sequence (TE = 100 ms; TR = 9220 ms; number of sections = 36; section thickness = 4 mm; field of view = 230 × 176 mm; flip angle = 150°), a coronal T2-weighted turbo spin-echo sequence (TE = 94 ms; TR = 2750 ms; number of sections = 56; section thickness = 2 mm; field of view = 180 × 180 mm; flip angle = 120°), and an axial T1-weighted sequence (TE = 379 ms; TR = 1800 ms; number of sections = 192; section thickness = 1 mm; field of view = 220 × 200 mm; flip angle = 12°) before and after intravenous contrast media application (0.1 mmol/kg body weight of a gadolinium-based contrast agent).
In addition to the routine preoperative examination, all patients underwent scanning with pulsed quantitative imaging of perfusion with a single subtraction with thin-section TI1 periodic saturation or Q2TIPS ASL sequences. The ASL tagging scheme was a proximal inversion with a control for off-resonance effects (PICORE) technique, a modification of the echo-planar imaging and signal targeting with alternating radiofrequency technique. With the use of PICORE, the acquisition of the tag image is identical to that in echo-planar imaging and signal targeting with alternating radio-frequency technique, but, during the acquisition of the control image, a nonselective off-resonance inversion pulse is applied, which has the same frequency offset relative to the imaging section as in the tag image. For a detailed description of the PICORE technique, see Wong et al.20
The imaging parameters used to perform the multisection PICORE technique were as follows: TE = 11 ms; TR = 2750 ms; field of view = 192 × 100 mm; number of sections = 14; section thickness = 6 mm; section gap = 1.5 mm; flip angle = 90°; number of measurement repetitions = 25. PASL images were acquired at 8 different inversion times (370 ms, 614 ms, 864 ms, 1114 ms, 1364 ms, 1614 ms, 1864 ms, and 2114 ms). For all 8 measurements, the imaging parameters were identical. No vessel suppression techniques were used to receive vascular intratumoral signals at low inversion times. One PASL sequence had an acquisition time of 1 minute, 19 seconds, which resulted in an imaging time of 10 minutes, 32 seconds, for all 8 ASL inversion times listed. The overall acquisition time for the anatomic and the ASL sequences used in this study was approximately 30 minutes. For all patients, the acquisition of ASL data was performed before the application of contrast media because of the known T1 shortening effect of gadolinium-based contrast agents, which results in a reduction of the SNR.16
The perfusion imaging section covered from the base of the skull (first section) to the vertex (last section) and was aligned parallel to the corpus callosum in the sagittal plane and to the midline structures in the axial and coronal planes.
Data Analysis
Postprocessing was performed on an off-line workstation (Leonardo Workplace, Siemens) by use of a z-transformation. Tumor ROIs (mean, 670 mm2; range, 150–2489 mm2) were manually drawn by an experienced neuroradiologist, blinded to the tumor histopathology. To approximate the whole tumor volume, multiple ROIs were drawn for each subject. Turbo inversion recovery magnitude or T1 postcontrast images were selected, which reflected the maximum spatial tumor extension, including nonenhancing and contrast-enhancing tumor components, on the basis of Response Assessment in Neuro-Oncology criteria.21 ROIs were drawn in such a way so as to spare areas with extended necrosis. The mean signal intensity value of each ROI on every tumor section was used to calculate the average mean signal intensity for the whole tumor (tumor ROI). These images were then assigned to co-registered PASL images for all 8 inversion times. In addition, an ROI of equal size was positioned exactly in the contralateral healthy hemisphere (in most cases containing white matter, gray matter, and vascular structures) to calculate the average mean signal intensity of the size-matched contralateral normal brain tissue (normal ROI). This normalization was applied to exclude signal from “normal” vascular and parenchymal structures. Normalized intratumoral signal intensity (nITS) was defined by the mean signal intensity value ratio of tumor ROI and normal ROI (nITS = signal intensity [tumor ROI]/signal intensity [normal ROI]) for each inversion time. The nITS value does not allow evaluation of absolute CBF values but assesses the ratio of intratumoral signal intensity to the signal intensity in the contralateral hemisphere. No multicentric or multifocal tumors were included in this study.
Visualization of selected characteristic sections of patients and corresponding times was performed in Matlab (version 7.8.347, R2009a; MathWorks, Natick, Massachusetts).
Statistical Analysis
Statistical analyses were performed by use of SPSS, version 17.0.2 software package (IBM, Armonk, New York). Testing for time-related differences (different inversion times: 370 ms, 614 ms, 864 ms, 1114 ms, 1364 ms, 1614 ms, 1864 ms, 2114 ms) for nITS for all 3 glioma categories was performed by use of a 3-way, mixed-model ANOVA, treating time and side as within-subject factors and glioma categories as between-subject factors. The within-subject factor side indicates size-matched healthy brain tissue (normal ROI) and tumor ROI. In addition, 1-way ANOVAs and post hoc tests according to Games-Howell were used to compare the intratumoral signal intensity differences and nITS values between glioma types for each inversion time separately. The sensitivity and specificity of nITS values for the discrimination of high-grade and low-grade gliomas were calculated for all inversion times by use of an optimal cutoff value determined by receiver operator characteristic (ROC) analysis. The area-under-the-ROC curve values for nITS values were calculated for all inversion times. To avoid the complications of age-related normal white matter signal differences, an intraindividual normalization by use of the contralateral normal brain tissue was performed by use of a t test. A value of P < .05 was considered to indicate significant results.
Histopathologic Assessment
Histopathologic diagnosis was evaluated by a panel of experienced neuropathologists (J.A.H. and colleagues), by use of a multiheaded microscope, on routinely processed formalin-fixed and paraffin-embedded tumor tissue with conventional H&E staining and Ki67 immunostaining. Tumor typing and grading were performed according to the criteria of the 4th edition of the World Health Organization Classification of Tumors of the Central Nervous System.4
Tissue for histopathologic assessment had been obtained at stereotactic biopsy (n = 11) or surgical resection (n = 22). Stereotactic biopsies were intraoperatively guided (Neuronavigation Stealth Station; Medtronic, Minneapolis, Minnesota) and targeted toward the most malignant portion of the tumor, on the basis of imaging findings. The histologic assessment according to the current WHO criteria revealed 7 diffuse astrocytomas (WHO grade II), 7 anaplastic astrocytomas (WHO grade III), and 19 glioblastomas (WHO grade IV).
Results
Table 1 provides an overview of patient characteristics and distribution of tumor types. Detailed information about the number of patients, sex, age, tumor type, and the extent of resection are shown in the On-line Table. Table 2 provides descriptive values of nITS for all tumor types at the inversion time of 370 ms.
Patient characteristics
Descriptive values, including the mean of nITS values, standard deviation, standard error, and confidence interval for all tumor types at 370 ms
Examples of ASL maps at 3 different inversion times, the corresponding T2-weighted turbo inversion recovery magnitude images, and T1-weighted postcontrast images for a glioblastoma, a diffuse astrocytoma, and an anaplastic astrocytoma are shown in Figs 1, 2, and 3, respectively.

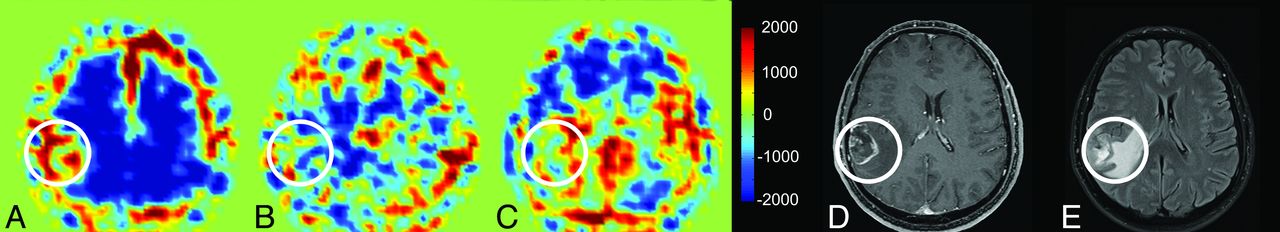
A 55-year-old man with histologically proven glioblastoma (WHO grade IV), right parieto-temporal (highlighted with a white circle). Axial PASL map at an inversion time of 370 ms (A), at 1114 ms (B), at 2114 ms (C), the contrast-enhanced T1-weighted image (D), and the T2-weighted turbo inversion recovery magnitude image (E). The increased signal intensity on the PASL maps of the glioblastoma is apparent at 370 ms. Images A–C were visualized and preprocessed in Matlab (version 7.8.347, R2009a).

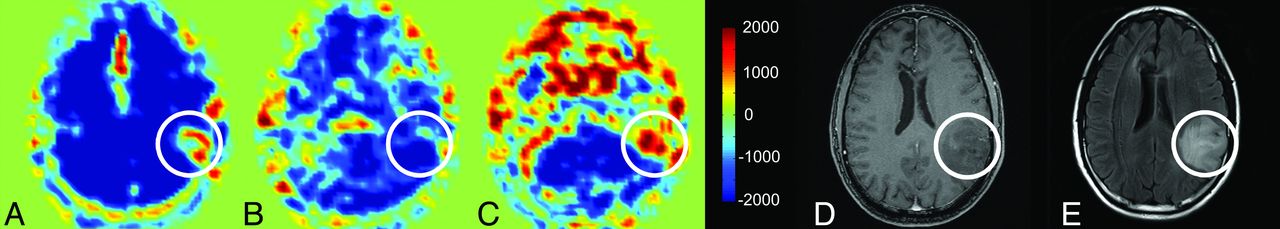
A 37-year-old man with histologically proven diffuse astrocytoma (WHO grade II), left parieto-temporal (highlighted with a white circle). Axial PASL CBF parameter map at an inversion time of 370 ms (A), at 1114 ms (B), at 2114 ms (C), the contrast-enhanced T1-weighted image (D), and the T2-weighted turbo inversion recovery magnitude image (E). On the PASL maps, no difference in signal intensity in the region of the tumor can be detected at each different inversion time. Images A–C were visualized and preprocessed in Matlab (version 7.8.347, R2009a).

A 42-year-old man with histologically proven anaplastic astrocytoma (WHO III), left parietal (highlighted with a white circle). Axial PASL map at an inversion time of 370 ms (A), at 1114 ms (B), at 2114 ms (C), the contrast-enhanced T1-weighted image (D), and the T2-weighted turbo inversion recovery magnitude image (E). Although on contrast-enhanced T1-weighted images no tumoral contrast enhancement can be detected, the PASL maps show increased signal intensity that could be most accurately detected at 370 ms, indicating a high-grade astrocytic neoplasm. Images A–C were visualized and preprocessed in Matlab (version 7.8.347, R2009a).
Statistical analysis revealed significant differences in the measured signal intensities between the ipsilateral and contralateral sides for all inversion times and all 3 tumor types (P < .001). An additional test for analyzing 3-way interaction of tumor type, inversion time, and side revealed a similar trend for all 3 tumor types toward higher signal intensities with higher inversion time (P = .09). Additional testing for the largest difference in nITS values between tumor types by use of a Welch test revealed the most statistically significant results for 370 ms (P = .003) (Fig 4). To avoid the complications of age-related normal-appearing white matter signal differences, an intraindividual normalization by use of the contralateral normal brain tissue was performed. Furthermore, no significant age differences, and therefore, no differences in normal-appearing white matter signal intensities, were found between low-grade and high-grade gliomas at any of the inversion times by use of a t test.

Comparison of nITS values for different astrocytoma types at 8 different inversion times (370 ms, P = .003; 614 ms, P = .012; 864 ms, P = .129; 1114 ms, P = .519; 1364 ms, P = .955; 1614 ms, P = .746; 1864 ms, P = .848; 2114 ms, P = .162) with corresponding error bars.
Fig 5 provides a time-series of PASL maps at all measured inversion times (columns) for 5 patients (rows A–E). The CE-T1–weighted images provide information about the tumor localization. The PASL maps at an inversion time of 370 ms show the highest contrast between high-grade gliomas and contralateral normal brain tissue signal compared with all other measured inversion times.

Contrast-enhanced T1-weighted images and time-series of PASL perfusion maps at all measured inversion times (370 ms, 614 ms, 864 ms, 1114 ms, 1364 ms, 1614 ms, 1864 ms, 2114 ms) of 5 patients (A–E) with high-grade gliomas.
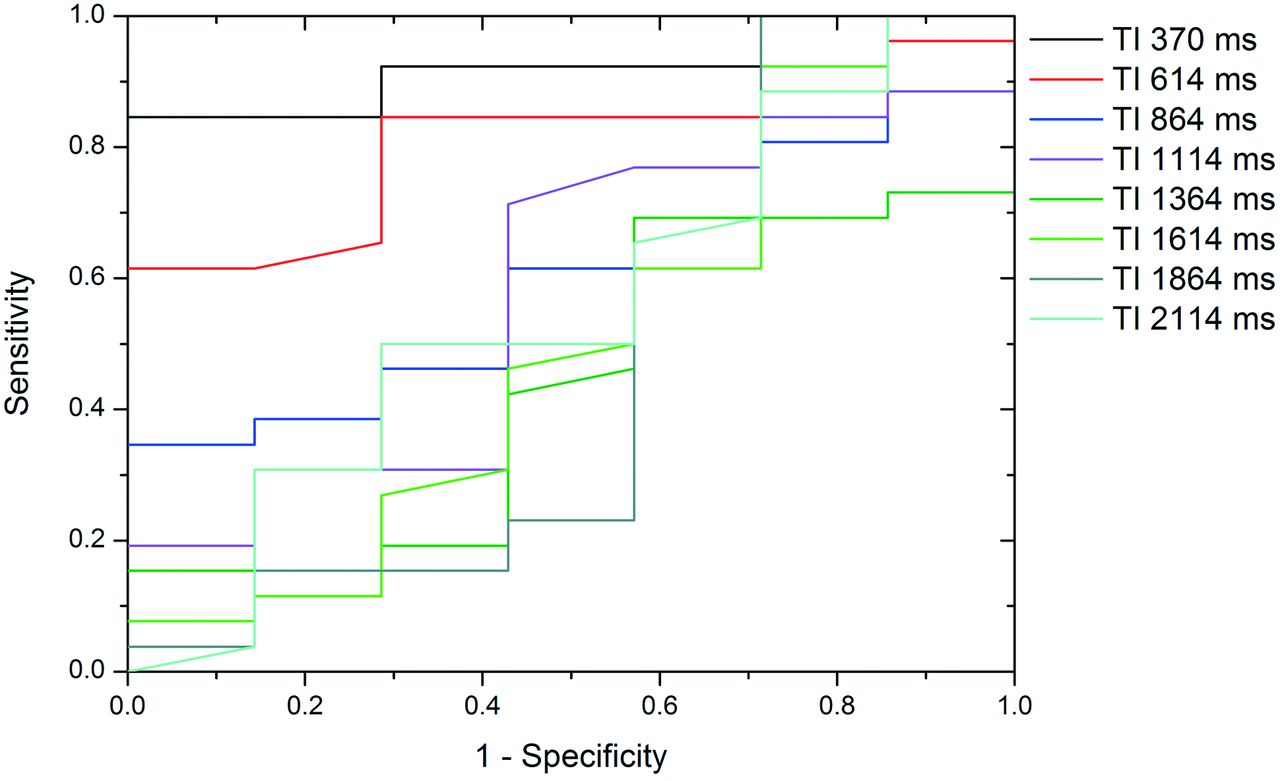
To provide information about the sensitivity and specificity of the nITS values in the differentiation of low-grade and high-grade gliomas, an ROC analysis for all inversion times was calculated. Fig 6 shows the ROC curves for nITS values at different inversion times. The area-under-the-ROC curve values for the nITS values at different inversion times were 0.912 (370 ms), 0.805 (614 ms), 0.632 (864 ms), 0.580 (1114 ms), 0.437 (1364 ms), 0.500 (1614 ms), 0.464 (1864 ms), and 0.555 (2114 ms). The optimal cutoff for nITS values at an inversion time of 370 ms was 1.48, with 85% sensitivity and 100% specificity. A nITS value of ≥1.48 suggested high-grade, whereas an nITS of <1.48 suggested low-grade glioma.

ROC curves of nITS values for the differentiation of low-grade and high-grade gliomas for all inversion times.
Discussion
In this study, 370 ms was determined to be the inversion time that showed the largest difference in normalized intratumoral signal intensity between high-grade and low-grade astrocytomas in a routine clinical setting. The use of multiple inversion times allows tracking of the labeled bolus dynamically over time, providing additional information about tumor physiology. Previous PASL studies, by use of multiple inversion times, focused primarily on healthy subjects or on patients with arterial occlusive disease and have shown that the choice of inversion time is essential.22,23 MacIntosh et al23 recently (2010) showed that the mean arterial transit time in healthy volunteers is approximately 641–935 ms, depending on the brain region. If the delay between labeling and imaging is very short, the labeled spins are located primarily within the vessel. At a very late inversion time, the magnetization of the labeled bolus disappears as the result of longitudinal relaxation. We used PASL imaging at 8 different inversion times in the range of 370–2114 ms, with a gap of approximately 250 ms, along the lines of already published data,22,23 to determine which inversion time showed the largest difference in normalized intratumoral signal intensity between high-grade and low-grade gliomas.
Previous ASL studies, focused on tumor perfusion, have already demonstrated that PASL perfusion measurements can improve the diagnostic accuracy of glioma by use of a single inversion time of 1200 ms,18,24 which resulted in a sensitivity of 82.9% and a specificity of 96.2%.19 We did not focus on absolute tumor perfusion but rather investigated the largest signal difference between tumorous brain tissue and contralateral normal brain tissue by evaluating the nITS values at different inversion times. However, the sensitivity and specificity in this study were 85% and 100%, respectively, by use of nITS values at an inversion time of 370 ms. Our method, therefore, is comparable to previously published PASL techniques for the differentiation of high-grade and low-grade gliomas.
The results of this study point out that the inversion time before expected cerebral perfusion shows the most significant difference, as well as the highest sensitivity and specificity of nITS values, between high-grade and low-grade gliomas. The nITS value does not allow evaluation of the absolute value of CBF but reflects the signal ratio between tumor and normal tissue. Our results demonstrate that high-grade gliomas show significantly higher nITS values than low-grade gliomas at low inversion times (Fig 4).
Previous studies have reported that at very low inversion times, the labeled blood is assumed to be intravascular. Recently, Liu et al25 assessed the labeled spin localization at multiple postlabeling delay times by use of T2 of the arterial spin-labeling signal as a marker. Because of the T2 of arterial blood (approximately 152 ms) and the tissue T2 (approximately 90 ms), they proposed that especially at very low inversion times (below the average range of arterial transit time), the labeled spins are primarily located in arterial vessels. They inferred that a postlabeling delay time of 2 seconds is sufficient to allow the spins to completely enter the tissue space for gray matter, and even longer inversion times are needed for white matter.25 Therefore, we suggest that the most significant intratumoral signal intensity in our study depicts tumor circulation but not tumor perfusion and should be more precisely called “normalized vascular intratumoral signal intensity” (nVITS). On the basis of the significance of neovascularization as the driving force of brain tumor growth, high-grade astrocytomas are supposed to show higher vessel densities than low-grade astrocytomas. Thus, glioblastomas (P = .023) and anaplastic astrocytomas (P = .004) showed significantly higher nVITS compared with low-grade astrocytomas, as revealed by post hoc comparisons. Although tumoral neoangiogenesis increases the vascular intratumoral signal as the result of higher tumoral vessel attenuation, it cannot be excluded that some of the vascular intratumoral signal refers to an early arrival of the spins, because of variability in the size of tumor vessels. However, rather than by use of relative tumor blood flow, this study indicates that it is feasible to use nVITS values for astrocytoma subtyping.
The main advantage of the use of the nVITS for noninvasive astrocytoma subtyping is that the acquisition time of the PASL sequence at the inversion time of 370 ms is 1 minute, 20 seconds. Compared with other ASL acquisition times in recently published data, which ranged from 3 minutes, 26 seconds, to 5 minutes, 52 seconds, this results in an acceleration factor of approximately 3.5.13,18 This acceleration was achieved as the result of the reduction of measurement repetitions to 25 rather than the formerly suggested 50 repetitions.11,12 This was accomplished by the signal intensification of intravascular blood flow compared with perfusion blood flow. The reduction of the measurement repetitions results in a reduced SNR, which is assumed to be the reason for the missing nITS differences between the different grades of astrocytoma at 1200 ms reported in the literature.11,18,26 However, because of the extended multimodal tumor MR imaging protocol, the acquisition time of each sequence should be as short as possible, in terms of patient care, to obtain as much usable information about the tumor characteristics as possible. Another advantage is that the calculation of nVITS values requires no further manual postprocessing of the data and is immediately available after the examination, in contrast to other MR imaging and CT perfusion techniques. Therefore, nVITS provides a truly noninvasive method by which to depict tumor vascularization and also offers a beneficial, fast, and easily applicable tool for integration into routine MR imaging diagnostics.
The differentiation of high-grade and low-grade astrocytomas by use of conventional MR imaging with gadolinium-based contrast medium alone can sometimes be misleading; published data demonstrated that 32% of histologically proven high-grade gliomas do not show a pathologic contrast enhancement.27 However, one of the most important clinical questions in astrocytoma diagnosis is the detection of malignant transformation of low-grade gliomas into anaplastic astrocytomas as soon as possible to adapt treatment strategies. More recently, published data have shown that the additional use of MR spectroscopy and MR perfusion significantly improve the predictive values and sensitivity of glioma grading.28
Because the growth and state of malignancy of an astrocytoma depends, among other factors, on angiogenesis, nVITS values are thought to be an especially fast and noninvasive measure that supports the detection of malignant transformation, particularly because contrast enhancement reflects the disruption of the blood-brain barrier rather than the assessment of tumor vascularity.
Furthermore, the nVITS values of tumors may facilitate the assessment of tumoral response to antiangiogenic therapy. Previous investigations demonstrated an expeditious decrease in tumorous tissue contrast enhancement after the initiation of treatment with antiangiogenic agents, especially in cases of vascular endothelial growth factor–targeted therapy, such as bevacizumab.29,30 This effect is thought to result partly from the normalization of abnormally permeable tumor vessels rather than from real antitumor effects and is also referred to as pseudoresponse. The advantage of obtaining the nVITS values of tumors could consist in depicting tumor circulation, which is thought to display the effects of antiangiogenic therapy more accurately than the contrast enhancement of tumors.
A potential limitation of ASL is that arterial occlusion could lead to a delay of the labeled arterial blood.22 This prolonged arterial transit time would result in an underestimation of tumorous vascular blood flow values, which would consequently lead to an underestimation of tumor malignancy. To minimize this potential bias, profound arterial occlusion should be excluded before the MR examination by use of non–contrast-dependent techniques, such as time-of-flight angiography. However, detection of a marginal reduction of vascular blood flow, which could also interfere with ASL data at such low inversion times, remains challenging.
Another limitation of this study is the limited number of patients with low-grade astrocytoma. This was a result of the lower local and overall incidence of low-grade astrocytoma compared with high-grade astrocytoma.1,2
Future investigation is needed to characterize the distribution function of the vascular bolus more precisely. Therefore, inversion times <370 ms must be investigated.
Because of the multiple PASL measurements (8 different inversion times), an acceleration of PASL acquisition time was essential, in terms of patient care, which resulted in a reduced SNR and an increased susceptibility to artifacts, which is another limitation of this study. Nevertheless, the PASL sequence used in this study proved to be able to differentiate between different glioma grades. Further investigation about SNR improvement is necessary but was beyond the scope of this investigation.
Conclusions
The data from our study confirm that nVITS, obtained at an inversion time of 370 ms, is a feasible value in the clinical setting for the differentiation of low-grade and high-grade astrocytic neoplasms. The use of normalized vascular intratumoral signal intensity facilitates a noninvasive, rapid radiologic characterization of astrocytomas. This value should be considered as a first step for the use of lower inversion times in PASL imaging to obtain further information about tumor vascularization. Future investigation will be needed to focus on sequence optimization and more detailed correlation of MR findings and histopathologic data (eg, vascular patterns and densities).
Acknowledgments
The authors wish to thank Siemens Health Care (Erlangen, Germany) for providing the pulsed arterial spin-labeling sequence.
Footnotes
Disclosures: Matthias Preusser—UNRELATED: Grants/Grants Pending: Roche,* GSK* (*money paid to institution).
REFERENCES
- Received January 31, 2013.
- Accepted after revision May 12, 2013.
- © 2014 by American Journal of Neuroradiology


Jump to section
Related Articles
Cited By...
- Clinical utility of arterial spin labeling for preoperative grading of glioma
- 3D Pseudocontinuous Arterial Spin-Labeling MR Imaging in the Preoperative Evaluation of Gliomas
- Improving the Grading Accuracy of Astrocytic Neoplasms Noninvasively by Combining Timing Information with Cerebral Blood Flow: A Multi-TI Arterial Spin-Labeling MR Imaging Study
- Radiological staging in pregnant patients with cancer