
Abstract
BACKGROUND AND PURPOSE: Qualitative radiologic MR imaging review affords limited differentiation among types of pediatric posterior fossa brain tumors and cannot detect histologic or molecular subtypes, which could help to stratify treatment. This study aimed to improve current posterior fossa discrimination of histologic tumor type by using support vector machine classifiers on quantitative MR imaging features.
MATERIALS AND METHODS: This retrospective study included preoperative MRI in 40 children with posterior fossa tumors (17 medulloblastomas, 16 pilocytic astrocytomas, and 7 ependymomas). Shape, histogram, and textural features were computed from contrast-enhanced T2WI and T1WI and diffusivity (ADC) maps. Combinations of features were used to train tumor-type-specific classifiers for medulloblastoma, pilocytic astrocytoma, and ependymoma types in separation and as a joint posterior fossa classifier. A tumor-subtype classifier was also produced for classic medulloblastoma. The performance of different classifiers was assessed and compared by using randomly selected subsets of training and test data.
RESULTS: ADC histogram features (25th and 75th percentiles and skewness) yielded the best classification of tumor type (on average >95.8% of medulloblastomas, >96.9% of pilocytic astrocytomas, and >94.3% of ependymomas by using 8 training samples). The resulting joint posterior fossa classifier correctly assigned >91.4% of the posterior fossa tumors. For subtype classification, 89.4% of classic medulloblastomas were correctly classified on the basis of ADC texture features extracted from the Gray-Level Co-Occurence Matrix.
CONCLUSIONS: Support vector machine–based classifiers using ADC histogram features yielded very good discrimination among pediatric posterior fossa tumor types, and ADC textural features show promise for further subtype discrimination. These findings suggest an added diagnostic value of quantitative feature analysis of diffusion MR imaging in pediatric neuro-oncology.
ABBREVIATIONS:
- EP
- ependymoma
- Gd
- gadolinium
- max
- maximum
- MB
- medulloblastoma
- PA
- pilocytic astrocytoma
- SVM
- support vector machine
- TA
- texture analysis
Diffusion MR imaging discriminates different types of adult brain tumors.1⇓–3 In the pediatric literature, the diffusion restriction has also been suggested to differentiate primitive neuroectodermal tumor/medulloblastoma (MB) and other supra- and infratentorial tumors.4 Several studies demonstrated that pilocytic astrocytomas (PAs) are characterized by significantly higher average ADC values than ependymomas (EPs) and medulloblastomas, but no clear difference was shown between EPs and MBs (Table 1).3,5⇓–7 However, by using the 75th percentile from the ADC histogram, instead of an average ADC, a promising discrimination of 90% was achieved,7 suggesting that individual tumor components allow better classification or grading than averaged metrics. This concept is well in line with the known heterogeneity of underlying tumor biology and the current practice of histologic diagnosis based on the most characteristic tumor parts.
Average tumor ADC values in pediatric posterior fossa tumors (×10−3mm2/s)
Texture analysis (TA) is another powerful approach to characterize and quantify the tumor matrix. TA features provide information about spatial patterns in the distribution of image intensities and have been successfully used to discriminate tumor types8⇓⇓–11 and types of tissue for segmentation12,13 and to predict prognosis.14 Most important, texture features offer the potential to discriminate distinct genetic tumor subtypes15⇓–17 by using combinations of T1WI, gadolinium (Gd)-enhanced T1WI, T2WI or FLAIR, and diffusion imaging in adult oligodendroglial tumors.
Significant advances are being made in characterizing molecular genetic tumor subtypes that predict differential survival and treatment responsiveness, which are particularly promising for future treatment stratification in medulloblastomas.18⇓–20 There is a great interest in developing novel imaging tools to noninvasively predict tumor types and subtypes that may offer added value for first-line surgical treatment planning before histologic and molecular diagnosis is available and in follow-up decision-making when repeat biopsies are impractical. Most approaches to date demand a significant increase in acquisition time (eg, MR spectroscopy) and may be expensive and not widely available (eg, 18F-PET). Dedicated advanced image processing may, instead, offer improved brain tumor classification without the time penalty based on the current standard brain tumor MR imaging protocol, which includes Gd-enhanced T1, T2, and diffusion MR imaging.
The purpose of our study was to investigate the value of quantitative analysis of standard clinical MR imaging to discriminate the main types of pediatric posterior fossa tumors (PA, MB, and EP) and subtypes (eg, to discriminate classic MB from other posterior fossa tumors). We compared the performance of individual or combined features derived from shape, texture, and histogram from anatomic T1WI and T2WI and diffusion map images. Multiple features were combined to train support vector machines (SVMs), a widely used supervised learning approach that has been previously suggested for tumor segmentation.21,22 In SVM classifiers, features are represented as n-dimensional vectors and combined to create a model of a particular class by using true and false training examples.
Materials and Methods
Patients
Before this study, informed consent was obtained from all participating patients or their guardians to allow data collection and analysis for research by the UK Child Cancer and Leukemia Group Functional Imaging Group data base, a UK National Health Service Research Ethics Committee–approved study. Forty patients with posterior fossa tumors (17 MBs, 16 PAs, and 7 EPs; Table 2) were included. Inclusion criteria were confirmed histologic diagnosis along with a World Health Organization grading/subtype when applicable and a preoperative clinical MR imaging (without previous therapy), including diffusion imaging (Table 3).
Demographics
No. of cases used in the analysis per MR imaging sequence
MR Imaging
Because we only included preoperative MR imaging, acquisition was undertaken by using standard pediatric neuro-oncologic protocols on several scanner platforms: 1.5T Signa (GE Healthcare, Milwaukee, Wisconsin); and 1.5T Intera or 3T Achieva (Philips Healthcare, Best, the Netherlands). For this analysis, Gd-enhanced spin-echo T1WI (TR = 598–647 ms, TE = 12–14 ms, and 0.4–0.5 × 0.4–0.5 × 4.0–5.0 mm3 voxel size), fast spin-echo T2WI (TR = 3000 ms, TE = 14–85 ms, and 0.4–0.5 × 0.4–0.5 × 4.0–5.0 mm3 voxel size), and diffusion data were used. Diffusion data were obtained with different sequences, ranging from 3-direction diffusion-weighted imaging to 15-direction diffusion tensor imaging, by using B0 = 0 s/mm2 and either bmax = 1000 s/mm2 or bmax = 800 s/mm2, TR = 4883–5800 ms, TE = 59–89 ms, and 1.9–2.0 × 1.9–2.0 × 3.0–4.0 mm3 voxel size. Missing data or exclusion due to motion artifacts reduced the total number of cases per imaging sequence (Table 3). ADC maps were generated by using the FMRIB Software Library toolbox (http://www.fmrib.ox.ac.uk/fsl/). Two sample cases can be seen in Fig 1.

T1WI+Gd (left), T2WI (middle), and ADC map (right) of an anaplastic (top) and classic MB. The overlaid region of interest (inside the green outline) is used to derive shape features and to calculate histogram and texture features for each image sequence.
Normalization
T2WI and ADC maps were registered, by using the FMRIB Linear Registration Tool (FLIRT), to the contrast-enhanced T1WI data (in general, T1WI was acquired with a voxel size of 0.5 × 0.5 × 4.0 mm3; in 9 cases in which the dimensions were slightly different, these were interpolated to a grid with 0.5 × 0.5 × 4.0 mm3 voxel size by using cubic interpolation). To minimize heterogeneity in image intensity caused by the use of different scanners and acquisition sequences, we intensity normalized the data to the mean value of normal-appearing white matter from 2 small ROIs drawn bilaterally above the ventricles.
Tumor Segmentation
Whole-tumor ROIs were manually drawn by 2 clinical research fellows with radiology training and 4 years (M.M.) and 1 year (A.A.) of experience in neuroimaging research by using NeuROI (http://www.nottingham.ac.uk/research/groups/clinicalneurology/neuroi.aspx). Tumor ROIs were defined on the T1WI+Gd images as areas of abnormal enhancement by using the coregistered precontrast T2WI to identify and exclude peripheral blood vessels adjacent to enhancing tumor and to include low-contrast tumor or necrotic tissue, excluding perilesional edema.
Shape, Histogram, and Texture Analysis
Shape, histogram, and texture features (Table 4) were extracted for each technique and patient by using in-house software developed in Matlab R2010a (MathWorks, Natick, Massachusetts). For shape features, values were computed on each section, and the mean value was used to characterize the whole tumor. Histogram-derived metrics and texture features were calculated from quantized data, by using 80 bins for the range (0.5–4.5 ×10⁻³mm2/s) (bin width = 0.05 × 10⁻³mm2/s). Histogram-derived metrics were calculated from whole-tumor ROIs. Texture features were calculated from Gray-Level Co-Occurrence Matrices, as per Haralick.23 As per the shape measures, mean whole-tumor values were calculated across tumor sections. For each case, several co-occurrence matrices were calculated, corresponding to different distances (0.5, 1.0, 1.5, 2.0, and 2.5 mm). For each distance, co-occurrence matrices for several directions (0°, 45°, 90°) were computed.
Shape, histogram, and texture parameters used in analysis
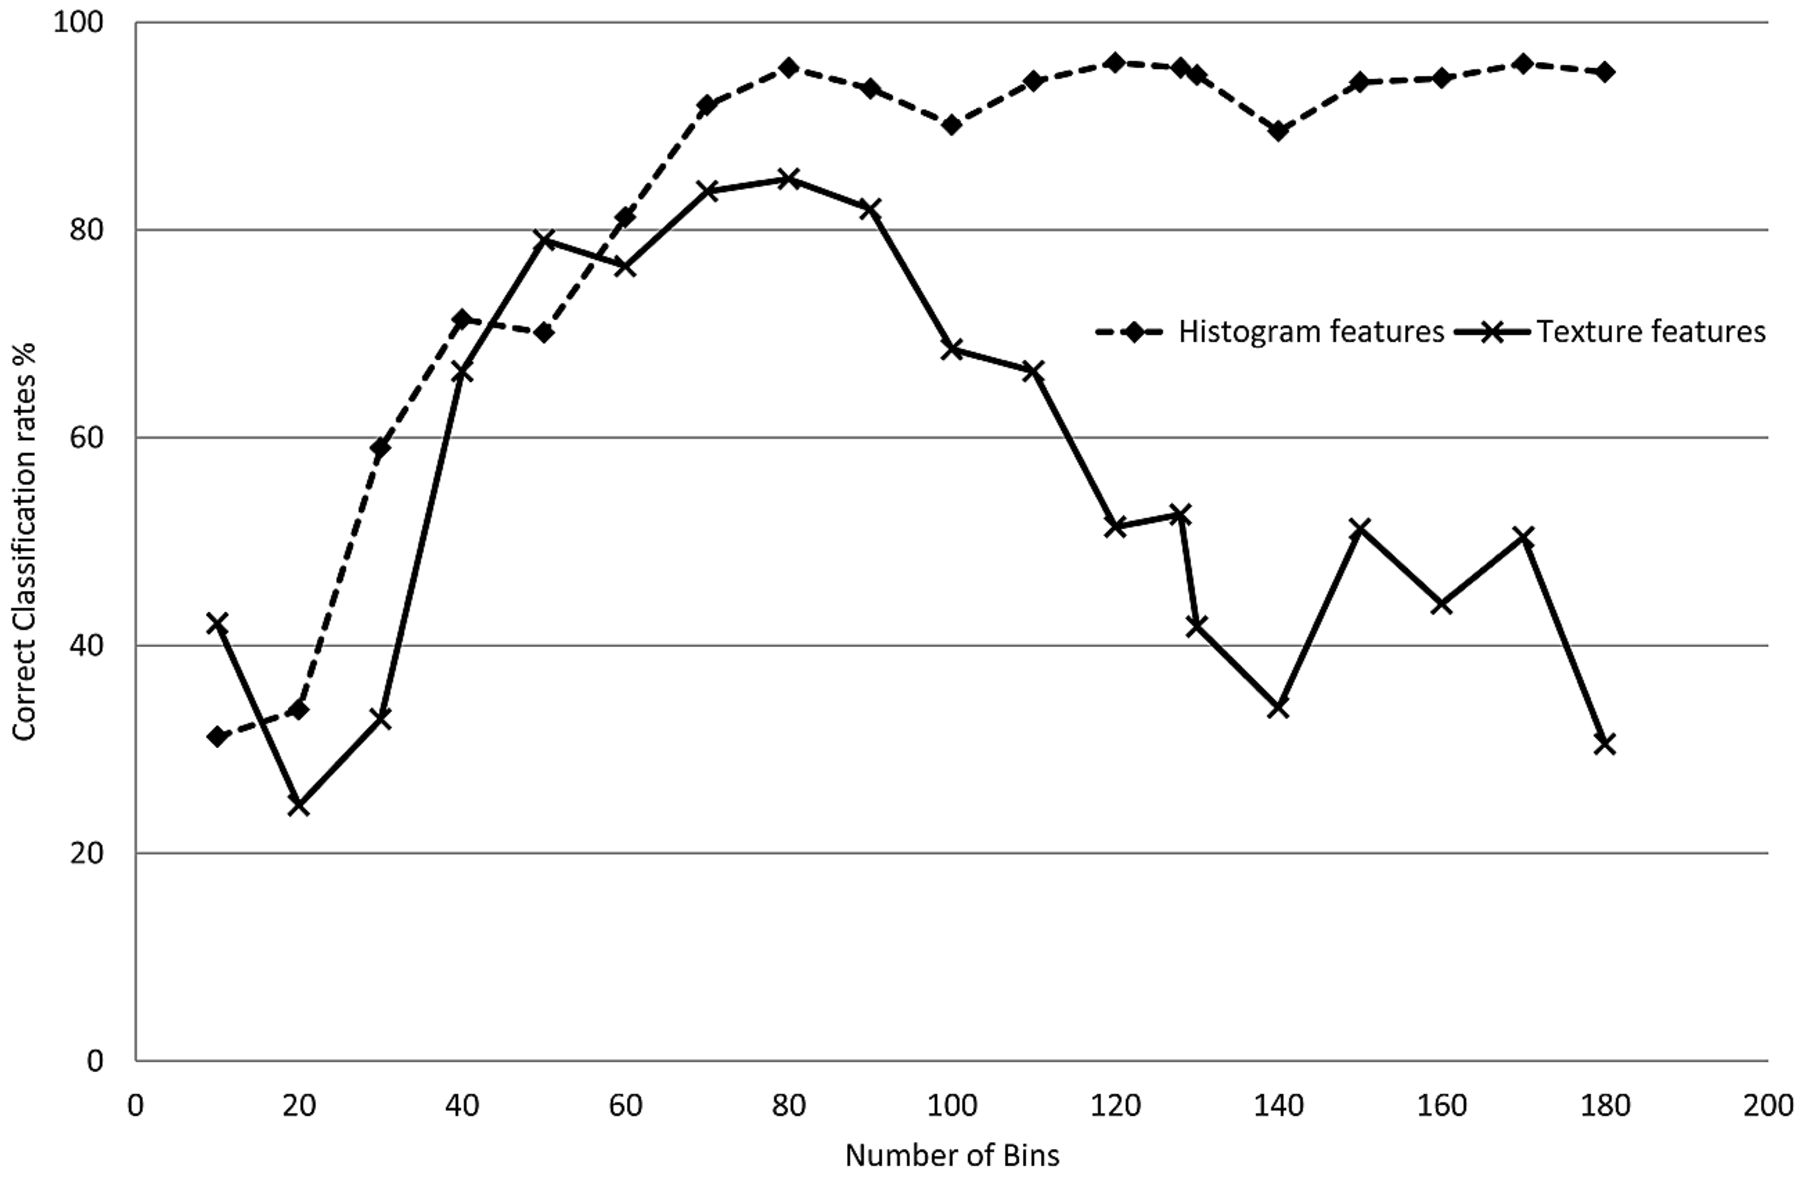
The effect of the number of bins (ie, intensity quantization level) used for texture analysis on the ADC texture features was investigated by recomputing the co-occurrence matrices for different quantization levels (from 10 to 180 gray-level intensities). This is an important aspect in calculating co-occurrence matrices because it directly determines the pairs of pixels with the same intensity that may be found within a region of interest.
Tumor-Type SVM Classifiers
Shapes from region-of-interest, histogram, and TA features from ADC, T1WI+Gd, and T2WI were used independently or in combination to train tumor-type specific binary classifiers for MB, PA, and EP. The SVM classifiers used are part of the Bioinformatics Toolbox in Matlab. They were implemented as linear classifiers that produced a true/false classification for each tumor type.
Single-feature classifiers were created for every shape, histogram, and texture feature. In addition, combined classifiers (going only up to a maximum of 4 features, to avoid overtraining) were produced by a systematic combination of all features.
These individual tumor-type classifiers were combined to produce a joint posterior fossa classifier (3 posterior fossa tumor classifiers) by using a simple voting system based on single-classifier performance. A diagram of the process can be seen in Fig 2.

Training process to create single support vector machine classifiers for each tumor type and a combination step to produce a posterior fossa classifier to be tested on the remaining data.
Training was performed by randomly choosing both true (nT) and false (nF) samples for each tumor type and by using the remaining samples as a test set. Each classifier was retrained with different-size training sets (nT = nF = 2, 3, 4) for each tumor type. For each tumor type and training set size, the training and testing process was repeated 500 times to obtain average classification rates for each classifier.
Radiologic reports at our institution were reviewed to investigate the accuracy of qualitative classification. Provisional diagnosis based on standard (including diffusion) MR imaging was recorded and matched to histopathology for MB, EP, and PA tumor types. Cases in which no provisional diagnosis was provided were considered as incorrectly classified.
Tumor-Subtype SVM Classifiers
In addition to tumor-type classifiers, a set of classic MB classifiers was produced to investigate tumor-subtype classification. The classic MB classifiers were based on ADC histogram and textural features.
Statistics
For both tumor type and subtype, we predefined <75% discrimination accuracy as futile for potential clinical use. Group mean differences for average ADC were calculated by using 1-way ANOVA and Tamhane T2 post hoc multiple comparison correction.
Results
Between-Group Comparison of Metrics and Features
There was a substantial overlap among the 3 tumor types for all metrics and features on all histogram and TA features investigated. Group mean differences for average ADCs were significant (Table 5).
Average tumor ADC values (×10−3mm2/s)
Tumor-Type Classifiers
Average classification rates for those classifiers yielding at least 75% correct classification performance are shown in Table 6 for joint posterior fossa classifiers based on T2WI and T1WI+Gd features with 8 sample randomly selected training sets tested on the remaining samples. The best classifier was based on a combination of size, histogram, and textural features, and it achieved <80% correct discrimination among the 3 groups. Classifiers trained with smaller sample sizes produced lower correct classification rates.
Average correct classification rates for joint posterior fossa classifiers (3-PFT) based on shape, T2WI, and T1WI+Gd histogram/texture featuresa
Average classification rates for the best performing joint posterior fossa classifiers based on ADC features with 8 sample randomly selected training sets and tested on the remaining samples can be seen in Table 7. Combined histogram-feature classifiers performed better than single-feature classifiers. Classifiers based on histogram metrics performed best with clinically useful 91% 3-way discrimination accuracy, which was better than that of classifiers built on either texture in isolation or combinations of histogram and textural features. The best performing ADC texture classifier based on entropy and homogeneity failed to reach the predefined minimum 75% accuracy level.
Average correct classification rates for joint posterior fossa classifiers (3-PFT) based on shape and ADC histogram/texture featuresa
The best single-feature ADC classifier for our dataset was the 25th percentile of the ADC histogram (Table 7). Average ADC classification performance was substantially lower at 71.9% (PA 87.2%, MB 70.6%, and EP 59.0%). The best multiple-feature classifier was a combination of histogram percentiles and skewness. The distributions for the 25th and 75th percentiles (though the normalized distributions were used in the classifiers) and skewness can be seen in Fig 3.

Distribution of 25th and 75th percentile values and skewness from ADC histograms for PAs, EPs, and MBs. White matter normalized values are used in the classifiers.
Neuroradiologists' assessment at our institution according to clinical reports for the same dataset produced the following correct classification rates: PA 65%, MB 53%, and EP 60%.
Tumor-Subtype Classifiers
Due to the low number of nonclassic MBs, tumor-subtype classification was investigated by discriminating classic MB from other MBs (anaplastic MBs) and EPs, again by using a training set size of up to 8 randomly selected samples and by using the remaining samples as a test set. ADC texture-based features (best classifier: sum average + sum variance, 89.4% average correct classification) were more effective in discriminating classic MBs than ADC histogram features (best classifier: 75th percentle + max probability, 68.0%) or T2WI and T1WI+Gd derived classifiers (best classifier: 77.6%). The inclusion of shape features did not result in increased performance.
Effect of the Number of Bins on Classification
All the histogram and texture features were calculated by using 80 bins (bin size = 0.05 × 10⁻³mm2/s). The effect of the number of bins or the bin size on classification performance was investigated by training a series of PA classifiers on the basis of histogram features only (ADC 25th percentile) and another on the basis of texture features only (ADC entropy + homogeneity) by using different bin sizes. With a range from 10 bins (bin size = 0.4 × 10⁻³mm2/s) to 180 bins (bin size = 0.02 × 10⁻³mm2/s), classification rates can be seen in Fig 4. For classifiers based on histogram metrics, a higher number of bins resulted in higher classification rates. Texture-based classification decreased with both low and high numbers of bins. For this dataset, it was observed that the range of 60–90 bins (sized 0.07–0.04 × 10⁻³mm2/s) produced the best classification rates.

Average classification rates for 2 PA tumor-type classifiers as a function of the number of bins used to quantize the normalized ADC values. Classification rates for histogram feature-based classifiers are independent of the number of bins (as long as these are not very low). In contrast, if the number of bins is too large, classification based on Gray-Level Co-Occurrence textural features will be affected (insufficient pairs of pixels are found).
Discussion
We show that quantitative feature analysis based on clinical MR imaging allows discriminating the main pediatric posterior fossa tumor types with an accuracy of 91% when using a combination of diffusion histogram metrics. These were found to be the best-performing metrics from a comparison of histogram and texture analysis features derived from ADC, Gd-enhanced T1WI, and T2WI scans. Conversely, textural ADC features predicted classic MB on average in 89% of test runs, demonstrating the potential for further tumor subtyping and highlighting the need for dedicated task-specific classifier optimization.
Features from diffusion MR imaging allowed better diagnosis of tumor type than textural features derived from conventional imaging. In agreement with Bull et al,7 we found that histogram-derived metrics also outperformed mean tumor metrics. In this study, the 25th percentile expected to characterize the most cellular and hence most aggressive tumor part allowed the best classification. This is in partial contrast to the previously reported best discrimination based on the 75th percentile,7 which also yielded a good discrimination in our study. The difference may be explained by the exclusion of cystic components in their study but deliberate inclusion in ours.
Quantitative analysis of tumor characteristics produced higher correct classification rates than clinical radiology reports provided by neuroradiologists in a tertiary neuroscience center. This difference likely reflects both the added value of quantitative analysis and the current lack of emphasis in radiology reporting of predicting tumor type provided by histology. The proposed approach yielding higher accuracy in predicting tumor types and possibly subtypes opens new avenues of research to explore the potential patient benefit based on noninvasive cancer classification. The surge of promising stratified care concepts highlight the need for parallel development of noninvasive classifiers to complement histologic and genetic classification systems. High-quality diagnosis of tumor type/subtype preoperatively would allow better planning of surgical resection extent and may become particularly useful for treatment guidance in residual/recurrent disease.
The possibility of combining several features by using SVMs was investigated to complement the discriminatory information and therefore increase classification rates. The best performance was achieved when combining the 25th percentile + 75th percentile + skewness (91.4% average correct classification). This performance is similar to classifiers based on single-voxel proton MR spectroscopy studies of pediatric posterior fossa tumors (85%–93%).5,24,25 To date, MR spectroscopy is available in most neuroimaging centers but comes at a significant increase of acquisition time and is limited to large nonhemorrhagic tumors. There is, however, the potential for even higher classification rates of up to 98%26 when using well-defined research protocols with multiple TE MR spectroscopy with even longer acquisition times. In contrast, we show here that a short single-technique ADC scan that is applicable to all posterior fossa tumors regardless of size or hemorrhagic components affords a particular time-efficient classification of tumors.
The shape measures and ADC textural features, separately or in combination, neither yielded useful classification performance nor improved further ADC histogram metrics-based performance. Shape, textural, and histogram features from T1WI+Gd and T2WI data achieved moderate classification only (78.8% for the best classifier based on volume + T1WI+Gd histogram energy + T1WI+Gd sum entropy). This comparative quantitative analysis provides further evidence that diffusion MR imaging is particularly well-suited to tumor characterization, and, in conjunction with advanced postprocessing, may overcome current limitations in the discriminatory performance of conventional MR imaging for posterior fossa tumors.
Most interesting, ADC textural features and not histogram metrics provided the best tumor-subtype classification performance, namely 89% correct classification of classic MBs. This was achieved by using a combination of ADC textural features (sum average and sum variance of the Gray-Level Co-Occurrence Matrix). However, the classifier was only binary in that it specified whether a sample was a classic MB. There were insufficient data to train a similar anaplastic MB classifier, but these promising results suggest that it may be possible to train subtype classifiers and that there may be specific imaging features that best reflect specific tumor phenotypes. T2WI textural features have been found to be strongly predictive of genotype mutations in low-grade gliomas.17
Feature selection for the classifiers in this study consisted of a systematic combination of up to 4 individual features for each technique. Histogram and textural features from different imaging sequences (T1WI+Gd, T2WI, or ADC) were not cross-matched. Some of those features may provide an overlapping description of the tumor characteristics (eg, histogram percentiles describe slightly different aspects of the same distribution), and feature-reduction techniques such as principal component analysis that produce orthogonal features may improve classifier performance. Similarly, there are techniques that can be used to combine classifiers iteratively, such as AdaBoost,27 which operates by weighting the combination of classifiers to minimize training error. These techniques produce strong classifiers from sets of weak classifiers that have the potential to further improve tumor type and subtype classification. Last, the SVM methodology proposed here is flexible and can be used to incorporate other shape and texture measures28 and wavelets29 and to combine multimodal imaging data.
Limitations
The main limitations are the relatively small datasets used, in which low numbers of tumor types (especially in EP) resulted in small training sets (maximum training set size nT + nF = 8). Using new data from other centers/scanners to train the SVM classifiers can help to improve their robustness. Most important, the presented classification is a best case scenario, given the data, and despite the promising accuracy, the generated classifiers from our dataset need to be prospectively tested on independent data to determine their robustness.
Conclusions
SVM-based classifiers by using a small set of ADC features (histogram and/or textural) and a small training dataset yielded very good discrimination among pediatric posterior fossa tumors, even though the individual features substantially overlapped. Features derived from ADC histograms yielded classification rates similar to those in reports based on MR spectroscopy and higher than those extracted from conventional T1WI+Gd or T2WI data. ADC textural features showed promise in discriminating tumor subtypes.
Acknowledgments
The authors thank Gill Glen for data management.
Footnotes
Disclosures: Daniel Rodriguez Gutierrez—RELATED: Grant: Cancer Research United Kingdom,* Engineering and Physical Sciences Research Council.* Amir Awwad—RELATED: Grant: Cancer Research United Kingdom,* EPSRC.* Timothy Jaspan—UNRELATED: Consultancy: Hoffman La Roche,* Comments: radiologist on HERBY study, a joint academia/pharma research study investigating the use of the antiangiogenic drug bevacizumab in pediatric high-grade glioma. Dorothee P. Auer—RELATED: Grant: Cancer Research UK,* Engineering and Physical Sciences Research Council UK,* Comments: includes some allowance for project-related travel, UNRELATED: Board Membership: Parkinson's UK, Comments: reimbursement of travel expenses to Parkinson's UK Research Advisory Panel Meetings, Grants/Grants Pending: MRC,* Engineering and Physical Sciences Research Council,* NIHR,* Stroke Association,* Arthritis Research UK,* Special Trustees NUHT,* Parkinson's UK* due to start. *Money paid to the institution.
This work was funded by grant C7809/A10342, Children's Cancer and Leukemia Group (Cancer Research United Kingdom and Engineering and Physical Sciences Research Council-CIP, in association with the Medical Research Council and England Department of Health).
Previously presented in part as a poster or oral presentations at: 36th European Society of Neuroradiology Annual Meeting, September 20–23, 2012; Edinburgh, Scotland; and European Society for Magnetic Resonance in Medicine and Biology 2012 Congress, October 4–6, 2012; Lisbon, Portugal.
Indicates open access to non-subscribers at www.ajnr.org
REFERENCES
- Received June 17, 2013.
- Accepted after revision August 20, 2013.
- © 2014 by American Journal of Neuroradiology


Jump to section
Related Articles
Cited By...
- The Cerebellum Plays More Than One Role in the Dysregulation of Appetite: Review of Structural Evidence from Typical and Eating Disorder Populations
- MR Imaging Characteristics and ADC Histogram Metrics for Differentiating Molecular Subgroups of Pediatric Low-Grade Gliomas
- Evolving Role and Translation of Radiomics and Radiogenomics in Adult and Pediatric Neuro-Oncology
- Radiomics Can Distinguish Pediatric Supratentorial Embryonal Tumors, High-Grade Gliomas, and Ependymomas
- Deep Learning for Pediatric Posterior Fossa Tumor Detection and Classification: A Multi-Institutional Study
- Automatic Machine Learning to Differentiate Pediatric Posterior Fossa Tumors on Routine MR Imaging
- Diffusion Characteristics of Pediatric Diffuse Midline Gliomas with Histone H3-K27M Mutation Using Apparent Diffusion Coefficient Histogram Analysis
- Correlation of 18F-FDG PET and MRI Apparent Diffusion Coefficient Histogram Metrics with Survival in Diffuse Intrinsic Pontine Glioma: A Report from the Pediatric Brain Tumor Consortium
- Relative ADC and Location Differ between Posterior Fossa Pilocytic Astrocytomas with and without Gangliocytic Differentiation