
Abstract
BACKGROUND AND PURPOSE: Alzheimer disease is the most common neurodegenerative disorder with dementia, and a practical and economic biomarker for diagnosis of Alzheimer disease is needed. Three-dimensional arterial spin-labeling, with its high signal-to-noise ratio, enables measurement of cerebral blood flow precisely without any extrinsic tracers. We evaluated the performance of 3D arterial spin-labeling compared with SPECT, and demonstrated the 3D arterial spin-labeled imaging characteristics in the diagnosis of Alzheimer disease.
MATERIALS AND METHODS: This study included 68 patients with clinically suspected Alzheimer disease who underwent both 3D arterial spin-labeling and SPECT imaging. Two readers independently assessed both images. Kendall W coefficients of concordance (K) were computed, and receiver operating characteristic analyses were performed for each reader. The differences between the images in regional perfusion distribution were evaluated by means of statistical parametric mapping, and the incidence of hypoperfusion of the cerebral watershed area, referred to as “borderzone sign” in the 3D arterial spin-labeled images, was determined.
RESULTS: Readers showed K = 0.82/0.73 for SPECT/3D arterial spin-labeled imaging, and the respective areas under the receiver operating characteristic curve were 0.82/0.69 for reader 1 and 0.80/0.69 for reader 2. Statistical parametric mapping showed that the perisylvian and medial parieto-occipital perfusion in the arterial spin-labeled images was significantly higher than that in the SPECT images. Borderzone sign was observed on 3D arterial spin-labeling in 70% of patients misdiagnosed with Alzheimer disease.
CONCLUSIONS: The diagnostic performance of 3D arterial spin-labeling and SPECT for Alzheimer disease was almost equivalent. Three-dimensional arterial spin-labeled imaging was more influenced by hemodynamic factors than was SPECT imaging.
ABBREVIATIONS:
- AD
- Alzheimer disease
- ASL
- arterial spin-labeling
- ROC
- receiver operating characteristic
- HMPAO
- hexamethylpropyleneamine oxime
Alzheimer disease (AD) is the most common neurodegenerative disorder with dementia and is becoming a social problem in most developed countries. A practical and economic biomarker for diagnosis of AD is needed. CBF is commonly accepted as a physiologic correlate of brain function.1 AD is associated with regional decreases in CBF, so the ability of CBF to differentiate between individuals affected by AD and healthy individuals has been evaluated with the use of SPECT.2
Arterial spin-labeling (ASL) enables measurement of CBF without any extrinsic tracers by use of magnetically labeled arterial blood water as a diffusible tracer. ASL MR imaging has 2 major modalities: pulsed ASL3 and continuous ASL.4 The continuous ASL technique uses continuous adiabatic inversion, whereas pulsed ASL uses a single inversion pulse. The recently developed pulsed-continuous ASL imaging protocol based on 3D stack-of-spirals readouts5 is an intermediate method between the conventional pulsed ASL and continuous ASL methods, in that pulsed-continuous offers a longer tag bolus than does pulsed ASL and a higher labeling efficiency than does the amplitude-modulated continuous ASL.6,7 Each section acquired with 2D ASL experiences a slightly different inflow time; thus, it is difficult to estimate a precise transit time when multiple sections are acquired. The use of 3D acquisition techniques overcomes many of these limitations, allowing both whole-brain coverage and simultaneous acquisition to ensure a unified mean transit time. The SNR of 3D acquisitions can be greater than that of 2D multisection methods. Although ASL has inherently low SNR, mainly because of the relatively small amount of labeled spins in the tissue, pulsed-continuous can provide a better balance between labeling efficiency and SNR than conventional ASL methods. This can improve the accuracy of quantified CBF estimates. Many AD studies by use of ASL have been reported, which indicates that ASL MR imaging is an indispensable technique for studying AD.8⇓⇓⇓–12 CBF measured with ASL MR imaging can detect regional hypoperfusion in the AD precuneus and bilateral parietal cortex and discriminate individuals with AD from normal subjects. Recent research with the use of pulsed-continuous reported that 3D ASL can evaluate the severity of cognitive impairment as measured by the correlation of CBF with cognition.13
SPECT is now commonly used for CBF assessment in the diagnosis of AD, so we considered that it was important to evaluate the differences in CBF distribution in perfusion images obtained with both SPECT and ASL by use of similarly behaved diffusible tracers and to demonstrate the characteristics of ASL in comparison with SPECT. To the best of our knowledge, the evaluation of brain perfusion imaging by use of both ASL and SPECT in the same subjects with clinically suspected AD to discriminate the AD group from the non-AD group has not been reported. We used whole-brain 3D ASL MR imaging with pulsed-continuous labeling for CBF measurement in the diagnosis of AD because of its high SNR and the possibilities for improving image quality.
In this study, we evaluated the detectability of reduced regional cerebral perfusion in AD by use of 3D ASL compared with brain perfusion SPECT and demonstrated the characteristics of perfusion images obtained by means of 3D ASL.
MATERIALS AND METHODS
Our institutional review board approved this study. The requirement for participant informed consent was waived because of the retrospective nature of the study.
Patients
We retrospectively selected 68 consecutive patients with clinically suspected AD from the period between May 2011 and December 2012. Patients included 21 men and 47 women (age range: 53–93 years; mean, 77 years). All patients received the Japanese version of the Mini-Mental State Examination,14 and their scores ranged from 6–29 points (mean, 21 points). MR examinations were performed as part of the patients' routine clinical care. All patients underwent brain perfusion imaging both with 3D ASL on a 1.5T clinical MR scanner and with technetium Tc99m-hexamethylpropylene amine oxime (HMPAO) SPECT within a 1-month period. Structural MR imaging was performed in addition to brain perfusion imaging to confirm that there was no other structural abnormality that could explain the patient's symptoms. Patients had no history of cerebrovascular disease, brain tumor, head trauma, or other causes of dementia. Thirty-six patients were diagnosed with AD and 32 patients were diagnosed as non-AD by experienced neurologists and psychiatrists, by use of the criteria of the National Institute of Neurologic and Communicative Disorders and Stroke in concert with the Alzheimer Disease and Related Disorders Association,15 and the Diagnostic and Statistical Manual of Mental Disorders, 4th edition.16 Four patients with mild cognitive impairment who later converted to AD were included in the AD group. Among patients diagnosed as non-AD, 5 patients had dementia with Lewy bodies, 3 patients had vascular dementia, and 24 were cognitively normal. The diagnosis of dementia with Lewy bodies was based on the criteria of the DLB Consortium.17 Vascular dementia was diagnosed according to the criteria of the National Institute of Neurologic Disorders and Stroke–Association Internationale pour la Recherche et l'Enseignement en Neuroscience.18 A summary of the demographic characteristics and neuropsychological test results for the patients is shown in Table 1.
Demographic characteristics of the subjects
MR Imaging
All MR imaging was performed with a 1.5T unit (Signa; GE Healthcare, Milwaukee, Wisconsin) and an 8-channel head array receiving coil. Pulsed-continuous imaging (3D fast spin-echo acquisition with background suppression, a labeling period of 1450 ms, postlabeling delay of 1525 ms, echo time of 10.47 ms, repetition time of 4546 ms, spiral readout of 8 arms × 512 samples, 30 × 4.0-mm axial sections, 3.2 × 3.2-mm in-plane resolution, reconstructed pixel size of 1.7 × 1.7 mm, acquisition time of 4 minutes, 30 seconds) was performed with the labeling plane at the level of the foramen magnum. Labeled and reference images were then subtracted to obtain perfusion-weighted imaging data. In addition to ASL imaging, all patients underwent axial diffusion-weighted (repetition time of 6000 ms, echo time of 70 ms, b factor of 1000 ms/mm2, 3 directions) and axial T2-weighted fast spin-echo (repetition time of 4717 ms, echo time of 85 ms) imaging to confirm that there was no other structural abnormality. All of these examinations were performed with a 5-mm section thickness, 1.5-mm skip, and 24-cm field of view. In addition, high-resolution 3D T1-weighted whole-brain images (repetition time of 8.3 ms, echo time of 3.8 ms, inversion time of 240 ms, 8° flip angle, matrix of 256 × 256, 176 sections, voxel size of 1.0 × 0.9 × 0.9 mm, imaging time of 4 minutes, 50 seconds) were obtained by use of the magnetization-prepared rapid acquistion of gradient echo (spoiled gradient-echo) sequence for anatomic information. The images were obtained in sagittal planes and were reconstructed into 1-mm-thick consecutive transverse images.
SPECT
Patients were directed to lie down for 20 minutes in the supine position with their eyes closed in a dim, quiet room. SPECT was performed by use of a double-head gamma camera (Forte; ADAC Laboratories, Milpitas, California) equipped with a Vertex general purpose collimator (VXGP; ADAC Laboratories) and converging collimators with a focal length of 65 cm. The acquisition began 7 minutes after the injection of 740 MBq of HMPAO, and projection data were obtained at 25 seconds/step × 32 views, resulting in a total acquisition time of approximately 20 minutes. A Butterworth filter (cutoff: 0.25, order: 8) was used for filtered back-projection reconstruction of the SPECT image, yielding a reconstructed pixel size of 2.5 mm within the transverse plane and a section thickness of 3.6 mm; attenuation correction was performed by use of the Chang method (JETStream Workspace 3.0. Philips Healthcare, Best, The Netherlands). No scatter compensation was available on the SPECT system.
Image Analysis
The ASL and SPECT data were evaluated with visual inspection and 3D stereotactic surface projection z score maps. The normal control data base for 3D stereotactic surface projection of ASL perfusion images was constructed with the newly prepared ASL images of 30 cognitively normal subjects: 11 men and 19 women (age range: 64–84 years; mean age, 73 years) who underwent brain MR imaging because of indefinite complaints and who had no structural abnormalities such as cerebrovascular disease, brain tumor, head trauma, or neurodegenerative disorder. The preset normal data base for HMPAO SPECT in the iSSP program (Nihon Medi-Physics, Tokyo, Japan) was used for this study. Two readers (C.H., K.I.) other than the study coordinator independently reviewed the SPECT images and 3D ASL images. These 2 readers were radiologists with 22 and 25 years of experience in nuclear medicine and were blinded to the results of the examination for AD. In both SPECT images and 3D ASL images, they assessed focal hypoperfusion in areas over the bilateral precunei and posterior cingulate gyri. They recorded their confidence levels regarding the presence of focal hypoperfusion as an indicator of AD by use of the following 5-point rating system: 1, definitely absent; 2, probably absent; 3, presence equivocal; 4, probably present; 5, definitely present. Kendall W coefficients of concordance (K) were computed to compare the assessment of the level of confidence of the 2 readers. Kendall W coefficients (K) of 0.5–0.8 were considered to indicate good agreement, and coefficients higher than 0.8 were considered to indicate excellent agreement. A value of P < .05 was considered to indicate a significant difference. Receiver operating characteristic (ROC) analysis to compare the diagnostic performance was performed with the aid of R software (Version 2.12.1; http://www.r-project.org/).19 The area under the ROC curve was calculated to compare the diagnostic performance for both the 3D ASL images and SPECT images for each of the 2 readers. A confidence level of 4 or 5 was considered a positive finding for the calculation of sensitivity and specificity of AD diagnosis, but the readers were not informed of this. The area under the ROC curve, sensitivity, and specificity were statistically compared between the readers by use of the bootstrap test for 2 correlated ROC curves. In addition, a paired t test was performed to evaluate the differences in regional perfusion distribution between the 2 imaging methods, by use of voxel-based analysis with statistical parametric mapping. Both 3D ASL and SPECT image preprocessing were implemented by use of SPM 8 software (Wellcome Department of Imaging Neuroscience, London, United Kingdom) and code written in Matlab (MathWorks, Natick, Massachusetts). For each subject, images were preprocessed as follows: 1) individual 3D ASL images were coregistered with individual SPECT images; 2) the SPECT images were spatially normalized to the Montreal Neurological Institute space by the SPM program; 3) the 3D ASL images were then spatially normalized to the Montreal Neurological Institute space by using the individual parameter obtained from SPECT normalization; 4) the spatially normalized images were smoothed by use of an isotropic Gaussian kernel with a 12-mm full width for 3D ASL and 8 mm for SPECT images at half maximum to reduce the noise and residual anatomic differences among the brains and to match the spatial resolution of 3D ASL and SPECT images; and 5) a paired t test was performed by using both preprocessed 3D ASL and SPECT images. To control for family-wise errors resulting from multiple comparisons, the initial significance threshold was set at P < .001.
In a recent report, hypoperfusion of the watershed area on 3D ASL imaging in many healthy subjects was referred to as the “borderzone sign.”20 We considered that this sign might have an effect on the performance of AD diagnosis; therefore we evaluated the frequency of this sign in the diagnostic discrepancy group. The patients with a discrepancy between clinical diagnosis and 3D ASL results and with a diagnostic discrepancy for reader 1 by use of SPECT–3D ASL were assessed. The borderzone sign was evaluated on the simple criterion that the signal defect of the watershed area in the 3D ASL images was positive by consensus between the 2 readers (C.H., K.I.).
RESULTS
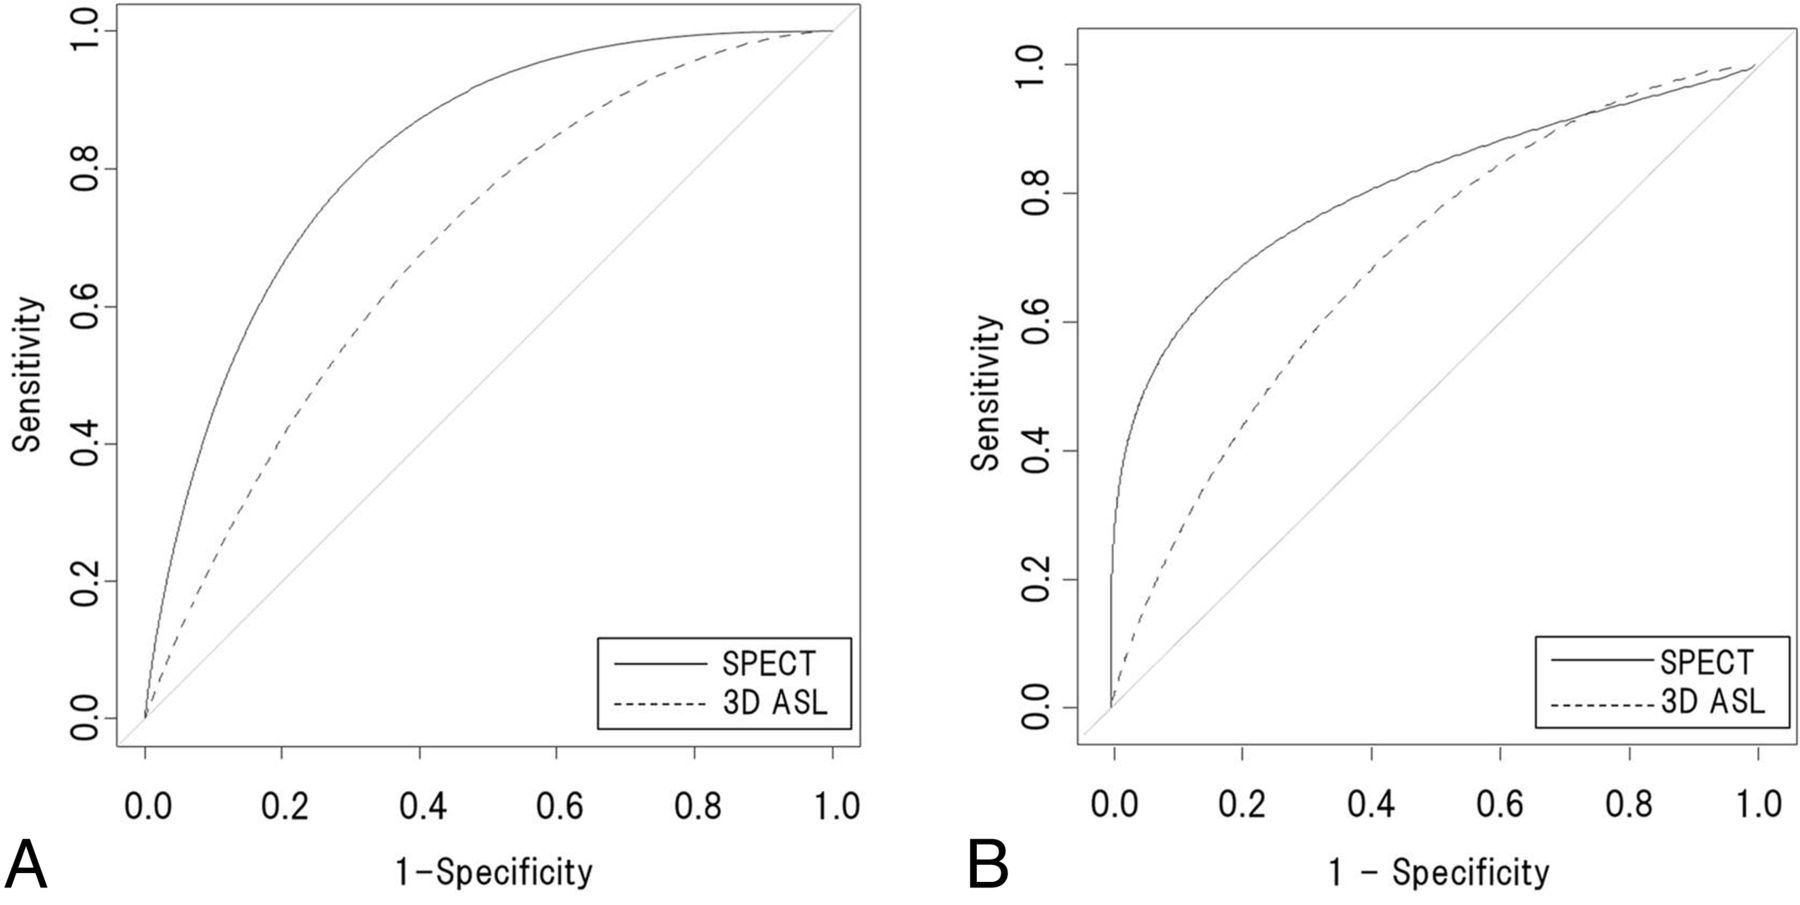
The 2 readers showed excellent agreement for the diagnosis of AD on the SPECT images (K = 0.82, P = .00087) and good agreement for that on the 3D ASL images (K = 0.73, P = .0083). The ROC curves for 3D ASL and SPECT images obtained by each reader are shown in Fig 1A, -B. For reader 1, the area under the ROC curve distinguishing AD from non-AD was 0.82 for SPECT images alone and 0.69 for 3D ASL images alone. A bootstrap test for the 2 correlated ROC curves showed that there was no significant difference (P = .08) between the 2 images. For reader 2, the area under the ROC curve distinguishing AD from non-AD was 0.80 for SPECT images alone and 0.69 for 3D ASL images alone. A bootstrap test for the 2 correlated ROC curves showed that there was no significant difference (P = .20) between the 2 images.

A, Average ROC curves for SPECT and 3D ASL for reader 1. B, Average ROC curves for SPECT and 3D ASL for reader 2. Smoothed curves were adjusted by calculation with a bootstrap test. Area under the ROC curve of 3D ASL was not significantly different (P > .05) from that of SPECT.
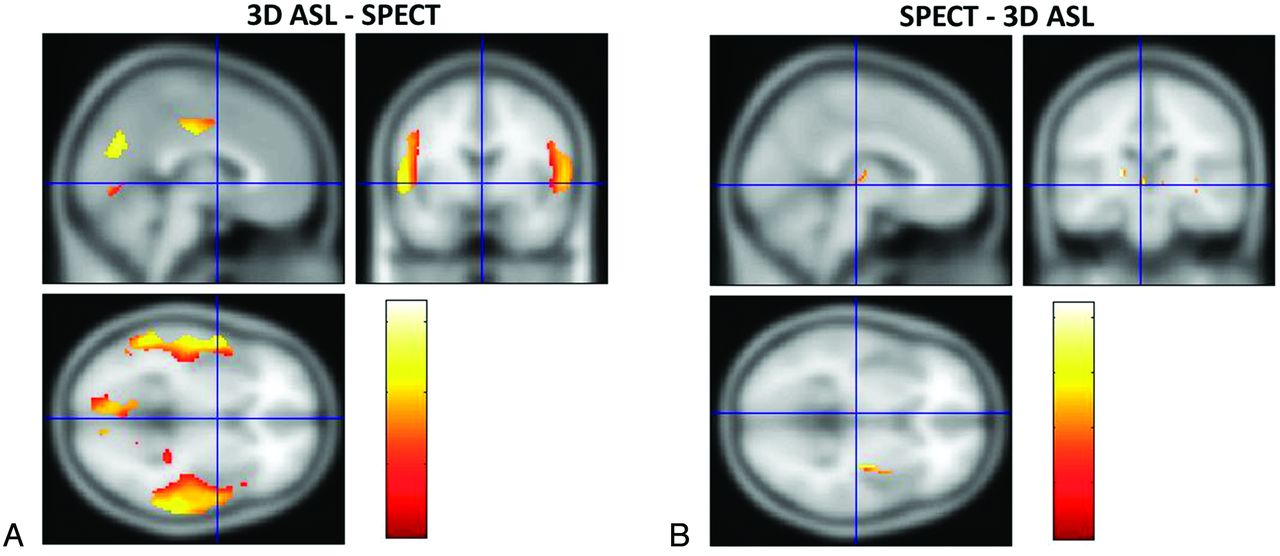
SPM analysis showed that in the 3D ASL image, the perisylvian and medial parieto-occipital perfusion was significantly higher than in the SPECT image (P < .001) (Fig 2A). In contrast, the area of hypoperfusion was barely detected in the 3D ASL image in comparison with the SPECT image (P < .001) (Fig 2B).

SPM analysis revealed that the perfusion images of 3D ASL were delineated by areas of higher CBF (red-to-yellow areas) in the middle cerebral artery region and in the posterior cerebral artery region than those observed on SPECT images (A), whereas small areas of higher CBF (red-to-yellow areas) were scattered in the SPECT perfusion images compared with those on 3D ASL (B).
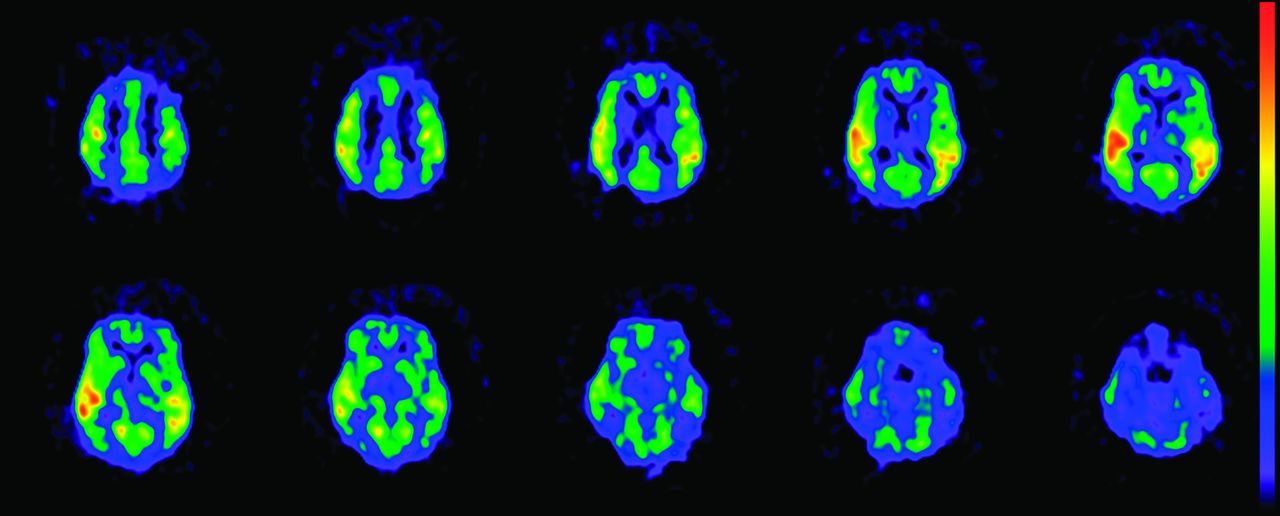
The results for the frequency of the borderzone sign and the discrepancy between clinical diagnosis and 3D ASL diagnosis are described in Table 2. The borderzone sign was observed in 6 of 17 patients (35%) with AD correctly diagnosed by 3D ASL and in 7 of 10 patients (70%) with non-AD incorrectly diagnosed by 3D ASL. The results for the frequency of the borderzone sign and the diagnostic discrepancy between SPECT and 3D ASL are described in Table 3. Diagnostic discrepancy between SPECT and 3D ASL was observed for 28 of 68 patients (41%). In the 9 patients without AD, 1 patient had dementia with Lewy bodies, 1 patient had vascular dementia, and 7 were cognitively normal. More detailed analysis of these results was not performed because the small number of patients precluded statistical analysis. In the patients with SPECT–3D ASL diagnostic discrepancy, the borderzone sign was observed in 2 of 5 patients (40%) with AD correctly diagnosed by 3D ASL and in 4 of 5 patients (80%) with non-AD incorrectly diagnosed by 3D ASL. Representative images of the borderzone sign in patients with diagnostic discrepancy are shown in Fig 3.
Clinical diagnosis and 3D ASL diagnosis
Clinical diagnosis, SPECT diagnosis, and 3D ASL diagnosis

Three-dimensional ASL images frequently show the borderzone sign (watershed area), which indicates bilateral signal deficiency in the middle cerebral artery–anterior cerebral artery and middle cerebral artery–posterior cerebral artery borderzones, with a high signal intensity in the surrounding cortex.
DISCUSSION
CBF assessment by SPECT is established as an indispensable clinical tool in the diagnosis of AD.21,22 HMPAO SPECT and FDG-PET showed hypoperfusion and decreased metabolism in the temporoparietal and posterior cingulate gyrus in AD, which indicates a direct coupling in AD between these 2 effects.23 In addition, a recent study to compare 3D ASL MR imaging with FDG-PET in the same subjects showed similar degrees of functional deficits in the affected areas,24 which indicates that 3D ASL MR imaging may be a more easily accessible alternative perfusion technique than SPECT in the diagnosis of AD.
Voxelwise comparison of the ASL images can be useful to help discriminate patients with AD from healthy subjects.12 A more recent study indicated that CBF maps obtained with 3D ASL can be a marker for disease severity ranging from mild cognitive impairment to advanced AD.13 Although many recent ASL perfusion studies were performed on 3T MR imaging, it has been shown in other studies that ASL with 1.5T MR imaging could detect regional hypoperfusion, mainly in the temporoparietal association cortex and the posterior cingulate gyrus.8,10,25 Another study suggested that CBF mapping by ASL may perform better than MR morphologic analysis by using voxel-based morphometry in discriminating patients with AD from healthy control subjects and that the combination of the 2 methods was more effective than either method alone.26 This result may support our proposal for the combination of structural MR imaging and ASL MR perfusion imaging. Three-dimensional ASL acquisition in our study required 4.5 minutes, which is short enough to be included in a clinical protocol.
In our study, interobserver agreement for both SPECT and 3D ASL revealed a statistically significant difference (SPECT: K = 0.82, P = .00087; and 3D ASL: K = 0.73, P = .0083), which may indicate that there were differences between the 2 readers in the accuracy of AD diagnosis. However, interobserver agreement was excellent for the SPECT images and good for the ASL images. In addition, the result of each reader's ROC analysis showed no significant difference between the image types, so we concluded that the diagnostic performance of 3D ASL on a 1.5T MR scanner is slightly but not significantly inferior to that of SPECT in the differential diagnosis of AD and non-AD.
Our results identified regional variability in the reliability of perfusion assessment by ASL. SPM analysis of 3D ASL and SPECT revealed some regional differences in perfusion distribution. In most of the participants, the distribution of perfusion was almost symmetric in the 2 hemispheres. Three-dimensional ASL perfusion images showed higher signal intensities than SPECT images in the MCA region and in the posterior cerebral artery region. We consider that this was because the MCA and posterior cerebral artery have high flow rates and because perfusion images of 3D ASL are influenced more than SPECT by hemodynamics, so the 3D ASL images can identify hypoperfusion of the watershed area. This is associated with aging and is related to a combination of increased arterial transit time and reduced CBF. Diagnostic discrepancies between 3D ASL and SPECT images were observed for 28 patients. We suggest that the misdiagnosis of cases of non-AD as AD by 3D ASL may result from this effect and that the borderzone sign has major effects on AD diagnosis as a false-positive finding because of its high incidence (70% and 80%) in these cases (Tables 2 and 3). Zaharchuk et al20 reported that about half of the patients with normal imaging findings on bolus perfusion-weighted imaging performed by use of gadolinium enhancement had abnormal ASL findings, most commonly the borderzone sign. The patients included in that study were also older (mean age, 71 ± 11 years). These findings suggest that perfusion imaging with 3D ASL is influenced more than SPECT by hemodynamic factors such as arterial transit time, especially in older people. We used a postlabeling delay of 1525 ms, which in previous reports has been suggested to be too short for quantitative CBF measurements in older patients, in whom arterial transit time could potentially be longer.27 Our patients with suspected AD were all older (mean, 77 ± 8 years). The reason for the use of a postlabeling delay of 1525 ms is that a longer postlabeling delay causes a decrease in SNR because of T1 relaxation, so there is a trade-off between a longer postlabeling delay and decreased SNR.
SPM analysis revealed the same perfusion of the frontal brain regions on 3D ASL images as on SPECT images, so we believe that the effect of the difference of perfusion distribution between 3D ASL images and SPECT images is of minor importance in evaluation of the function of frontal brain regions (eg, the diagnosis of frontotemporal lobar degeneration). We judged that the result shown in Fig 2B of hypoperfusion on 3D ASL was within the limits of statistical error, because hypoperfusion on the 3D ASL image was visible as small scattered areas and its distribution was not related to cerebral hemodynamics.
Given these limitations, this study can be regarded as a pilot investigation to identify the most suitable ASL images for evaluating CBF distribution, which must be more rigorously examined in future studies. There are 2 factors important in obtaining an accurate CBF map: arterial arrival time and postlabeling delay. In addition, our results indicate that a high magnetic field will be valuable because of its high label efficiency and slower label decay.
Conclusions
Perfusion imaging with 3D ASL was influenced to a greater extent than SPECT by hemodynamic factors such as arterial transit time. Statistical analysis revealed that 3D ASL MR imaging can be an alternative perfusion imaging method to SPECT in the diagnosis of AD and indicates that 3D ASL is an appropriate method for diagnosing AD and will allow a “one-stop shop” MR routine examination.
REFERENCES
- Received July 8, 2013.
- Accepted after revision September 10, 2013.
- © 2014 by American Journal of Neuroradiology


