
Abstract
BACKGROUND AND PURPOSE: Pilocytic astrocytomas, the most common posterior fossa tumors in children, are characterized by KIAA1549-BRAF fusions and shows excellent 5-year survival rates. Pilocytic astrocytoma with gangliocytic differentiation, a recently defined pilocytic astrocytoma variant that includes glial and neuronal elements similar to a ganglioglioma, may be distinguished from a classic ganglioglioma by molecular, radiologic, and histopathologic features. This study investigated whether imaging could distinguish posterior fossa pilocytic astrocytoma with and without gangliocytic differentiation.
MATERIALS AND METHODS: Preoperative MRIs (± CTs) of 41 children (age range, 7 months to 15 years; mean age, 7.3 ± 3.7 years; 58.5% male) with pilocytic astrocytoma with gangliocytic differentiation (n = 7) or pilocytic astrocytoma (n = 34) were evaluated; differences in tumor location, morphology, and minimum relative ADC between tumor types were compared (Wilcoxon rank sum test, Fisher exact test). Histopathology and BRAF fusion/mutation status were reviewed. Associations of progression-free survival with diagnosis, imaging features, and BRAF status were examined by Cox proportional hazards models.
RESULTS: Pilocytic astrocytoma with gangliocytic differentiation appeared similar to pilocytic astrocytoma but had lower minimum relative ADC (mean, 1.01 ± 0.17 compared with 2.01 ± 0.38 for pilocytic astrocytoma; P = .0005) and was more commonly located within midline structures (P = .0034). BRAF status was similar for both groups. Non-total resection (hazard ratio, 52.64; P = .0002), pilocytic astrocytoma with gangliocytic differentiation diagnosis (hazard ratio, 4.66; P = .0104), and midline involvement (hazard ratio, 3.32; P = .0433) were associated with shorter progression-free survival.
CONCLUSIONS: Minimum relative ADC and tumor location may be useful adjuncts to histopathology in differentiating pilocytic astrocytoma with gangliocytic differentiation from pilocytic astrocytoma. Shorter progression-free survival in pilocytic astrocytoma with gangliocytic differentiation is likely due to a propensity for involvement of midline structures and poor resectability.
ABBREVIATIONS:
- GG
- ganglioglioma
- GTR
- gross total resection
- MAPK
- mitogen-activated protein kinase
- NTR
- non-total resection
- PA
- pilocytic astrocytoma
- PA-GD
- pilocytic astrocytoma with gangliocytic differentiation
- PFS
- progression-free survival
- rADC
- relative ADC
Genetic alterations resulting in constitutive activation of BRAF, a key tyrosine kinase in the mitogen-activated protein kinase (MAPK) pathway, are the defining abnormality in most pediatric low-grade gliomas.1⇓–3 The most common activating mutations are tandem duplications at chromosomal band 7q34, which generate KIAA1549-BRAF fusions,4⇓–6 and BRAF:p.V600E point mutations.4⇓–6 Pilocytic astrocytoma (PA) is the most common posterior fossa tumor in children, accounting for ∼25% of infratentorial pediatric brain tumors.7 PAs are World Health Organization grade I tumors with biphasic architecture, elongated bipolar (piloid) cells, microvascular proliferation or hyalinization, and degenerative changes such as Rosenthal fibers. Almost all posterior fossa PAs contain a KIAA1549-BRAF fusion, and this alteration differentiates PAs from other low-grade gliomas with high specificity.6 Their imaging characteristics are variable, with 2/3 demonstrating a typical “cyst with enhancing mural nodule” appearance and the remainder appearing solid or partially necrotic.8 Overall survival rates are excellent, around 96% at 5 years.9,10
Pediatric gangliogliomas (GGs) are uncommon World Health Organization grade I glioneuronal tumors. They are rarely found in the posterior fossa, where GGs comprise ∼1% of all tumors,11⇓–13 and frequently contain BRAF:p.V600E mutations (35%–58%).14,15 Overall 5-year survival rates of ∼95% are similar to those seen for PAs, but lower rates (∼78%–81%) have been reported for infratentorial GGs, which frequently involve the brain stem.12,16,17 Similar to PAs, the imaging characteristics of posterior fossa GGs are variable; they may be solid, partially necrotic, or have a “cyst with mural nodule” appearance, reminiscent of PAs.17⇓⇓–20
A recent study found that posterior fossa GGs could be divided into 2 distinct categories, by using histopathologic, molecular, and radiologic features.21 One category comprises classic gangliogliomas (70%), which may contain BRAF:p.V600E mutations and are more frequently solid and enhancing. The other consists largely of PAs with foci of gangliocytic differentiation (PA-GDs, 30%), which more frequently appear cystic/necrotic. These frequently contain KIAA1549-BRAF fusions, but not a BRAF:p.V600E mutation, and are better characterized as PAs with gangliocytic differentiation.
In this study, we investigated whether imaging features could distinguish PAs with and without gangliocytic differentiation and whether clinicopathologic, imaging, and/or molecular features influenced progression-free survival (PFS).
Materials and Methods
Study Population
We performed a retrospective review of our institutional pathology data base, with institutional review board approval and a waiver of consent. Seven patients with posterior fossa PA-GDs and 43 patients with posterior fossa pilocytic astrocytomas were identified, which were diagnosed between February 2006 and February 2014. Tumors involving the cervical spinal cord and patients with neurofibromatosis type 1 were excluded. Five subjects with PA were excluded for insufficient preoperative imaging. Four had insufficient tissue for diagnosis, yielding a final cohort of 34 PAs. We recorded the following clinical data: dates of diagnosis, surgery, and progression; treatment with chemotherapy and/or radiation therapy; whether there was gross total resection (GTR) of tumor, leptomeningeal metastasis, or history of epilepsy; and time and site of progression, if applicable.
Imaging
Preoperative and postoperative MR imaging studies were available for all subjects. Preoperative noncontrast CTs were available for 10 subjects with PA, and none with PA-GD. Most preoperative and immediate postoperative imaging was performed at other institutions (because our institution is a referral-based children's cancer treatment hospital) with equipment by multiple vendors (GE Healthcare, n = 30; Siemens, n = 6; and Philips Healthcare, n = 5) and variable field strengths (1T, n = 1; 1.5T, n = 30; and 3T, n = 10). Imaging sequences acquired for each group are listed in the Table. Section thicknesses for diffusion imaging ranged from 2.5 to 5 mm, with interslice gaps of 0–1 mm except for 1 PA examination with a gap of 2 mm. Other sequences were acquired with variable section thickness ranging from 1 to 6 mm.
MRI sequences by group
All imaging examinations were reviewed by 2 board-certified radiologists (J.H.H. and S.N.H.) with Certificates of Added Qualification in neuroradiology; both were blinded to the diagnosis. Each scored tumors according to the following criteria: dominant site (cerebellar hemisphere, vermis, middle cerebellar peduncle, brain stem); side (left, right, midline); circumscription (yes, no, mixed); hemorrhage (yes, no); cyst+nodule morphology (yes, no); percentage enhancement, percentage cystic/necrotic (0% = 0, <25% = 1, 25%–49% = 2, 50%–75% = 3, >75% = 4); and edema (none = 0, minimal = 1, mild = 2, moderate = 3, severe = 4). Differences were resolved in consensus. For relative ADC (rADC) analysis, ROI ellipses were drawn within the region of lowest ADC within the solid component of each tumor, avoiding areas of hemorrhage or mineralization, and in the contralateral thalamus. rADC was calculated as ADCtumor/ADCthalamus.22
Pathology
The histopathologic diagnosis was reviewed in each case (D.W.E.). Hematoxylin-eosin stained 4-μm formalin-fixed paraffin-embedded sections were supplemented with immunohistochemical analysis with antibodies to glial fibrillary acidic protein (1:400, M076101; Dako, Carpinteria, California), Ki67 (1:200, M7240; Dako), microtubule-associated protein 2 (1:10,000, M4403; Sigma-Aldrich, St Louis, Missouri), Neu-N (1:5000, MAB377; EMD Millipore, Billerica, Massachusetts), neurofilament protein (1:100, M076229; Dako), and synaptophysin (1:400, NCL-L-SYNAP-299; Leica Biosystems, Buffalo Grove, Illinois).
Molecular Analysis and Interphase Fluorescence in Situ Hybridization
Tumors were screened for the presence or absence of a KIAA1549-BRAF fusion by using 2 complementary methods: dual-color interphase fluorescence in situ hybridization for BRAF duplication at 7q34 as a surrogate marker for the presence of fusions, and real-time quantitative reverse-transcription polymerase chain reaction to detect specific KIAA1549-BRAF fusion transcripts. Interphase fluorescence in situ hybridization was performed on 4-μm formalin-fixed paraffin-embedded sections by using bacterial artificial chromosome clones as described previously.21,23 Genomic DNA and total RNA were extracted from 10-μm formalin-fixed paraffin-embedded scrolls, as previously described.21 The BRAF:p.V600 mutation hotspot was sequenced in genomic DNA, and quantitative reverse-transcription polymerase chain reaction was performed by using first-strand complementary DNA synthesized from total RNA, both as previously described.21
Statistical Analysis
The Wilcoxon rank sum test was used to assess differences in continuous variables (rADC, age) between PA and PA-GD groups. The Fisher exact test was used to assess differences in categoric variables (sex, dominant site, hemorrhage, cyst+nodule morphology, circumscription, percentage enhancement, percentage cystic/necrotic, and degree of edema) between the PA and PA-GD groups. Because of the small number of subjects with PA-GD, the dominant site was divided into “midline” (brain stem, vermis) versus “off-midline” (cerebellar hemisphere, middle cerebellar peduncle) structures for comparison.
Progression-free survival was calculated as the following: Date of First Progression (or last imaging follow-up date if no progression) − Diagnosis Date + 1. The Cox proportional hazards model was used to explore the relationship of PFS to diagnosis (PA versus PA-GD), dominant site, and extent of resection (GTR versus non-total resection [NTR]). The association between the dominant site and the extent of resection was assessed by a χ2 test. Associations of BRAF fusion status with the dominant site and the extent of resection were assessed by the Fisher exact test. All statistical tests were performed with SAS, Version 9.3 (SAS Institute, Cary, North Carolina).
Results
Demographic, imaging, and molecular features are summarized in the On-line Table. Children with PA-GD (age range, 4.7–13.3 years; mean age, 10.3 ± 3 years) were older at diagnosis than those with PA (age range, 7.2 months to 15.0 years; mean age, 6.7 ± 3.6 years) (P = .0232). A slight preponderance of males in the PA-GD group (5 of 7 or 71.4%) was not statistically significant compared with the PA group (19 of 34 or 55.9%) (P = .6786).
Treatment
Twenty-three of 34 subjects with PA achieved GTR at the initial operation; none developed metastasis. None of the 23 subjects in whom GTR was achieved underwent chemotherapy or radiation therapy; one had tumor progression, underwent successful repeat GTR, and received no further therapy. Eleven subjects with PA had NTR at presentation; 9/11 had local progression, and 2 received focal radiation therapy alone and had no tumor progression. GTR was achieved at a subsequent operation in 3/6 subjects who underwent repeat resection, which occurred at an average of 489 ± 361 days (range, 25–962 days) after the first operation. In general, unsuccessful repeat operations were performed earlier (mean, 251 ± 197 days after the initial operation) than those that ultimately resulted in GTR (mean, 726 ± 344 days after the initial operation).
GTR was not achieved at the initial operation for any of the 7 subjects with PA-GD. One subject had no progression before or after successful GTR 140 days after the initial operation and had no other therapy; this outcome was classified as GTR for survival and progression analyses. One subject was lost to follow-up after initial postoperative imaging, and a third received chemotherapy and survived to the time of this study, though progression status was not known. The remaining 4 subjects had local progression between 17 and 554 days (mean, 242 ± 238 days) postoperatively. Of these, 1 had repeat NTR 197 days postdiagnosis, with no further therapy, 1 had leptomeningeal metastasis at diagnosis and received craniospinal irradiation, and the remaining 2 subjects received chemotherapy.
Imaging
Imaging features of PAs and PA-GDs are compared in Fig 1. Most PAs and PA-GDs were well-circumscribed with minimal edema (On-line Table). The percentages of enhancing tumor and cystic/necrotic components did not differ significantly between tumor types, nor did the propensity for hemorrhage. Twenty-one percent of PAs and 43% of PA-GDs showed signs of hemorrhage, a difference that was not significant (P = .3324). Although only 1 of 7 (14%) PA-GDs had a classic cyst+nodule morphology compared with 10/34 (29%) PAs, this was not a distinguishing feature (P = .6514). PA-GDs were more likely to occur in midline structures (P = .0034); all 7 PA-GDs predominantly involved either the vermis (n = 5) or brain stem (n = 2), while PAs were more commonly off-midline. Nineteen PAs involved the cerebellar hemisphere, and 2, the middle cerebellar peduncle.

Imaging features of 10 different tumors, 5 PAs and 5 PA-GDs. On axial ADC maps, the solid portions of PAs (A) tend to be homogeneous with relatively elevated ADC; PA-GDs (B) appear more heterogeneous and have foci of lower ADC (arrow). PA-GDs primarily involve midline structures; the PA in C displaces the vermis, while a PA-GD (D) infiltrates the vermis. PA and PA-GD have a similar frequency of hemorrhage, seen in the PA on T2* (E) and in the PA-GD on SWI (F). Both tumors tend to appear circumscribed and may appear solid or necrotic or have cyst-and-nodule morphology as seen on axial contrast-enhanced T1WI of a PA (G) and a PA-GD (H). The percentage of solid tumor components showing enhancement was similar between PA (I) and PA-GD (J).
Diffusion imaging was available for 6/7 PA-GDs and 31/34 PAs. Trace-weighted DWI was provided without ADC maps for 1 subject with PA-GD and 3 subjects with PAs. These subjects were excluded from rADC analysis. An ADC map was provided without trace-weighted DWI for 1 subject with PA. For the 28 PAs and 5 PA-GDs with ADC maps, the minimum tumor rADC was significantly lower for PA-GD (range, 0.81–1.20; mean, 1.01 ± 0.17) than for PA (range, 1.24–2.89; mean, 2.01 ± 0.38), with no overlap in values (P = .0005). For a threshold rADC of 1.22, set midway between the lowest PA rADC of 1.24 and the largest PA-GD rADC of 1.20, the sensitivity and specificity of minimum rADC for differentiation of PA and PA-GD were both 100%.
Pathology/Molecular Analysis
Five of 7 PA-GDs (71%) and 31 of 33 PAs (94%) had a KIAA1549-BRAF gene fusion. Fusion screening was not performed for 1 subject with PA due to insufficient material. There was no significant difference in BRAF fusion status by diagnosis. Four tumors (2 PAs and 2 PA-GDs) did not have a BRAF duplication; all were located in the midline (vermis or brain stem, P = .0424) and were less likely to have undergone GTR (P = .026). No BRAF:p.V600E mutations were identified in 34/41 tumors tested (7 PA-GDs, 27 PAs). Insufficient material was available to complete mutation analysis for 7 tumors (all PAs).
Progression-Free Survival
Two subjects with PA-GD were lost to imaging follow-up after postoperative MR imaging; progression status and survival data were unavailable for one of these. All 40 remaining children were alive at the most recent follow-up, which ranged from 1.0 to 8.1 years (mean, 4.4 ± 2.0 years) after diagnosis for patients with PA and 1.4–9.0 years (mean, 4.4 ± 2.7 years) for children with PA-GDs. Local tumor progression was seen in 3/5 subjects with PA-GDs and 11/34 subjects with PAs; only 1 of these (PA) had undergone GTR. Subjects with KIAA1549-BRAF fusion were more likely to have GTR than those without (P = .0199), but fusion status alone did not predict improved progression-free survival in the entire cohort (P = .1165) or in patients whose tumors were incompletely resected (P = .59).
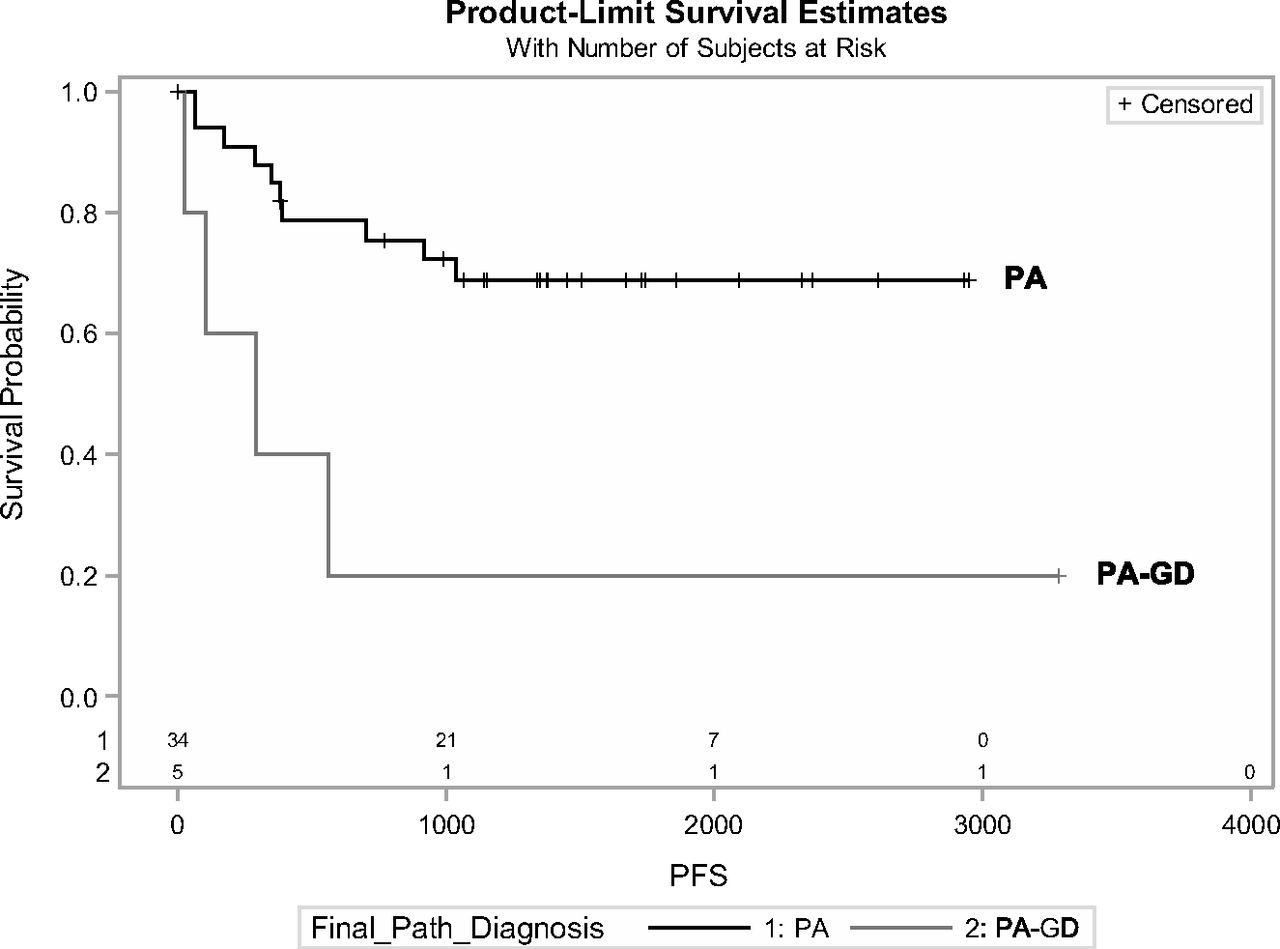
Progression-free survival was significantly lower for PA-GD than PA (P = .0104; hazard ratio, 4.66) (Fig 2). Midline tumors of either type were more likely to progress compared with off-midline tumors (P = .0433; hazard ratio, 3.319). The strongest predictor of tumor progression was non-total resection, with a hazard ratio of 52.644 compared with GTR (P = .0002). NTR was most strongly associated with a PA-GD diagnosis (P = .0141) and midline location (P = .0187), but when only midline tumors were considered, there was no difference in the likelihood of GTR (P = .1577) or in progression-free survival (P = .0833) between PA and PA-GD, and PFS did not differ between patients with NTR of PA versus PA-GD (P = .1800).

Progression-free survival was significantly lower for PA-GD compared with PA (P = .0104; hazard ratio, 4.66).
Discussion
PA-GD is a recently defined rare variant of PA, from which it may be histopathologically differentiated only by the presence of foci of gangliocytic differentiation. In this study, we found that conventional imaging features such as circumscription, enhancement, and cysts/necrosis cannot reliably differentiate PA and PA-GD, both of which may have the cyst+nodule imaging appearance considered characteristic for PA. However, PA-GDs were more likely to involve midline structures than PAs (P = .0034), and a minimum rADC < 1.22 reliably differentiated posterior fossa PA-GD from PA (P = .0005). This simple and rapid approach to differential diagnosis requires no specialized software and may serve as a valuable adjunct to histopathologic diagnosis.
A growing body of literature suggests that activating mutations of BRAF may be tumor- and site-specific in the CNS and have morphologic, prognostic, and therapeutic implications.5,17,21,24⇓⇓⇓⇓⇓–30 Most cerebellar PAs carry BRAF duplications in conjunction with a KIAA1549-BRAF fusion, which is highly specific for PA (98.5%)26,31 and is associated with a well-defined tumor margin and a good prognosis.26,32 The BRAF:p.V600E point mutation is a recurring alteration in gangliogliomas (up to 58%) but is rare in pilocytic astrocytoma.1,5,14,15,24,31,33 Fusions were observed in 94% (31/33) of evaluated PAs and in 71.4% of PA-GDs in this series, further supporting classification of PA-GD as a PA variant, and most tumors were well-circumscribed; however, neither feature influenced progression-free survival. No BRAF:p.V600E mutation was found in this study.
PA-GDs had significantly worse PFS than PAs in this study. This finding aligns with prior studies describing a poorer prognosis for posterior fossa gangliogliomas compared with PAs.34⇓–36 The presence of residual tumor (NTR) was the strongest predictor of tumor progression (P = .0002) and was associated with absence of fusion (P = .0199), midline involvement (P = .0187), and PA-GD diagnosis (P = .0141). All 4 tumors negative for fusion in this series (2 PAs and 2 PA-GDs) were located in either the vermis or brain stem and were incompletely resected (P = .0424 and 0.026, respectively). PAs and PA-GDs involving midline structures had similarly poor resectability (P = .1577) and PFS (P = .0833), and in patients with residual tumor, neither BRAF fusion status (P = .59) nor tumor type (P = .1800) influenced PFS. PA-GDs were more likely than PAs to involve midline structures (vermis or brain stem) (On-line Table). Thus, shorter progression-free survival in PA-GD is more likely due to its proclivity for midline structures, rather than underlying histology or BRAF fusion status.
PA-GD of the posterior fossa is rare, and the small sample size for PA-GD (n = 7) is the major limitation of this study. This may have limited our ability to detect the impact of BRAF status on progression-free survival and to determine whether additional imaging features could distinguish PA from PA-GD. Because we are a referral-only pediatric cancer specialty hospital with a busy consult service, uncommon tumors are disproportionately referred to us for consultation or care; thus, the relative frequencies of PA-GD and PA in this study are not representative of those in the general population. Imaging techniques were also not consistent for this study; not all patients had ADC maps, limiting the sample size for ADC analysis, and vendors and techniques were not uniform. However, although absolute ADC varies between vendors and field strengths,37,38 rADC is robust across MR imaging vendors and platforms and may therefore be considered reliable.22 The ROI-based ADC measures used in this study are readily performed in the typical fast-paced clinical setting but may be subjective. Histogram-based whole-tumor ADC analysis continues to mature and may one day become widely available for clinical use, promising to decrease the subjectivity of ADC measures in future assessments.39,40 Finally, because rADC was not used to guide biopsy in this retrospective study, it was not possible to evaluate whether regions of lower ADC in PA-GD correlated with hypercellularity or dysplastic neuronal elements, the histologic feature distinguishing PA-GD from PA.21
With the advent of targeted cancer therapy, imaging-based identification of classic PA-like features in a ganglioglioma may be therapeutically relevant. BRAF inhibitors such as vemurafenib are effective for tumors positive for BRAF:p.V600E mutation but cause paradoxical activation of the MAPK pathway and progression in tumors with KIAA1549-BRAF fusion or wild-type BRAF.17,28,29 PAs and PA-GDs would not respond favorably to this class of BRAF inhibitor; this scenario highlights the need to separate PA-GDs from classic GGs in the posterior fossa.
Conclusions
A minimum rADC of >1.22 reliably differentiates PA from PA-GD, which is more likely than PA to involve midline structures. This simple approach may be used by any radiologist to suggest PA-GD in the differential diagnosis of a posterior fossa mass that otherwise resembles PA, augmenting histologic and molecular diagnosis. Poorer progression-free survival in PA-GD compared with PA is likely due to its proclivity for midline structures and related poor resectability. As more molecular features of pediatric low-grade gliomas emerge, careful correlation with imaging phenotype may permit imaging-based prediction of molecular features, with therapeutic and prognostic implications.
Footnotes
Disclosures: Julie H. Harreld—RELATED: Grant: National Cancer Institute (grant No. CA21765)*; Other: American Lebanese Syrian Associated Charities,* Comments: American Lebanese Syrian Associated Charities is the fundraising entity that supports research and clinical care at St. Jude; UNRELATED: Travel/Accommodations/Meeting Expenses Unrelated to Activities Listed: World Federation of Neuroradiological Societies; Society of Pediatric Radiology, Comments: World Federation of Neuroradiological Societies: travel expenses for invited talk, 2014; Society for Pediatric Radiology: travel expenses and honorarium for invited talk, 2013. David W. Ellison—UNRELATED: Grants/Grants Pending: National Institutes of Health*, Comments: 5 P01 CA096832–11, coinvestigator; 1 U10CA180886–01, coinvestigator. *Money paid to the institution.
This work was supported, in part, by grant No. CA21765 from the National Cancer Institute and by the American Lebanese Syrian Associated Charities.
Paper previously presented, in part, at: Annual Meeting of the Radiological Society of North America, November 29 to December 4, 2015; Chicago, Illinois.
Indicates open access to non-subscribers at www.ajnr.org
References
- Received April 18, 2016.
- Accepted after revision June 13, 2016.
- © 2016 by American Journal of Neuroradiology


