
Abstract
BACKGROUND AND PURPOSE: Time-of-flight MR angiography is the preferred imaging technique to assess intracranial arterial stenosis but is limited by a relatively long acquisition time. Compressed sensing provides an innovative approach in undersampling k-space to minimize the data-acquisition time. We aimed to evaluate the diagnostic accuracy of compressed sensing TOF for detecting intracranial arterial stenosis by comparison with conventional parallel imaging TOF-MRA.
MATERIALS AND METHODS: Compressed sensing TOF and parallel imaging TOF were performed in 22 patients with intracranial arterial stenosis. The MRA scan times were 2 minutes and 31 seconds and 4 minutes and 48 seconds for compressed sensing TOF and parallel imaging TOF, respectively. The reconstructed resolutions were 0.4 × 0.4 × 0.4 and 0.4 × 0.4 × 0.6 mm3 for compressed sensing TOF and parallel imaging TOF, respectively. The diagnostic quality of the images and visibility of the stenoses were independently ranked by 2 neuroradiologists blinded to the type of method and were compared using the Wilcoxon signed rank test. Concordance was calculated with the Cohen κ. Edge sharpness of the arteries and the luminal stenosis ratio were analyzed and compared using a paired-sample t test.
RESULTS: The interrater agreement was good to excellent. Compressed sensing TOF resulted in image quality comparable with that of parallel imaging TOF but boosted confidence in diagnosing arterial stenoses (P = .025). The edge sharpness of the intracranial arteries for compressed sensing TOF was significantly higher than that for parallel imaging TOF (P < .001). The luminal stenosis ratio on compressed sensing TOF showed no significant difference compared with that on parallel imaging TOF.
CONCLUSIONS: Compressed sensing TOF both remarkably reduced the scan time and provided adequate image quality for the diagnosis of intracranial arterial stenosis.
ABBREVIATIONS:
- CS
- compressed sensing
- GRAPPA
- generalized autocalibrating partially parallel acquisition
- PI
- parallel imaging
Cerebrovascular disease is a major cause of morbidity and mortality worldwide and can arise from several intracranial vessel wall pathologies, such as atherosclerosis, dissection, and vasculitis.1,2 Studies have found that intracranial arterial stenosis is highly prevalent in fatal stroke.3 The imaging of intracranial vessels is an important tool for the clinical evaluation of cerebrovascular disease.
The preferred imaging techniques used to assess intracranial arterial stenosis in clinical practice include CTA and MRA. The limitations of CTA include exposure to radiation, the use of iodinated contrast agents, and impaired accuracy in the presence of vascular calcifications.4,5 Time-of-flight MRA is widely used and is a noninvasive technique for intracranial vascular evaluation that requires no exogenous contrast agent. Because conventional TOF-MRA is a rather slow imaging technique, pursuing high spatial resolution is challenging. The spatial coverage is often compromised to achieve a half-millimeter resolution and good signal-to-noise ratio, while keeping the scan time clinically acceptable.6 Furthermore, relatively long acquisition times may lead to motion artifacts, which disrupt the detection of vascular lesions. Further limitations of conventional TOF-MRA include a loss of signal intensity related to turbulent and slow flow.7
Parallel imaging (PI) is routinely used as a method for k-space undersampling during the acquisition of TOF-MRA. However, the acceleration factor of PI is often only 2- or 3-fold because of the rapid increase in noise or aliasing at higher acceleration factors.8⇓–10 Compressed sensing (CS) provides an innovative approach to undersampling k-space through the exploitation of the underlying sparsity in the appropriate transform domain,11,12 promising higher acceleration. This has been demonstrated in various MR imaging applications, such as TOF-MRA,11,13 contrast-enhanced MRA,14 cardiac cine imaging,15 pediatric MR imaging, and dynamic contrast-enhanced imaging.16,17
The reduction of acquisition time using CS-TOF is beneficial, but its influence in the diagnosis of intracranial arterial stenosis is not well-known. We therefore aimed to evaluate the diagnostic accuracy of CS-TOF for intracranial arterial stenosis, comparing it with conventional PI-TOF.
Materials and Methods
Patient Selection
From December 2017 to January 2018, CS-TOF and PI-TOF were performed in 85 patients who underwent TOF-MRA examinations in our center. Twenty-two consecutive patients were retrospectively recruited for data analysis according to the following inclusion criteria: They had at least 1 segment of intracranial arterial stenosis confirmed on digital subtraction angiography or on either of the TOF-MRA sequences. Patients with no positive vascular findings (n = 49) or with other vascular lesions such as aneurysms (n = 11) or obvious motion artifacts (n = 3) on both CS-TOF and PI-TOF were excluded from further analysis. The study was approved by the institutional review board for human studies. Written informed consent was obtained from all the patients.
MR Angiography Parameters
All the images were obtained with a Magnetom Skyra 3T MR imaging scanner (Siemens, Erlangen, Germany) using a 20-channel head-neck coil. A research sequence and reconstruction prototype provided by Siemens were used for CS-TOF. All imaging parameters for CS-TOF and PI-TOF are listed in Table 1. The main differences of the 2 image protocols were as follows: The acceleration factor of CS-TOF was set at 10.3, while the generalized autocalibrating partially parallel acquisition (GRAPPA) factor of PI-TOF was set at 2. In addition, the phase partial Fourier factor was used for PI-TOF and set at 6/8. For CS-TOF, the acquired voxel size was 0.6 × 0.6 × 0.6 mm3 and reconstructed to 0.4 × 0.4 × 0.4 mm3. For PI-TOF, the acquired voxel size was 0.6 × 0.6 × 1.2 mm3 and reconstructed to 0.4 × 0.4 × 0.6 mm3. The total acquisition time was 4 minutes and 48 seconds and 2 minutes and 31 seconds for PI-TOF and CS-TOF, respectively.
MR imaging parameters for CS-TOF and PI-TOF
Data were reconstructed using 10 iterations of the Modified Fast Iterative Shrinkage-Thresholding Algorithm according to a previous report.13 Maximum-intensity-projection images of the axial, coronal, and sagittal views were reconstructed.
Imaging Evaluation
Two senior neuroradiologists (M.Q. and S.s.L., with 10 and 6 years' experience, respectively), who were blinded to both the patients' information and the type of reconstruction undertaken, independently assessed the diagnostic quality of the images. All MIP images of PI-TOF and CS-TOF were presented to the 2 neuroradiologists in random order. The diagnostic quality of the images was graded on an ordinal scale from 0 to 3, with 0 indicating completely blurred arteries and severe artifacts; 1 indicating partially obscured arteries and moderate artifacts; 2 indicating good and clear arteries and slight artifacts; and 3 indicating excellent arteries and no artifacts. For visualization of the arterial stenosis, the readers first identified a stenosis on the MIP images, and then declared their level of confidence using a 3-point scoring scheme as follows: grade 2, definite stenosis and sufficiently recognized, high confidence; grade 1, probable stenosis, moderately confident; grade 0, low confidence. The location of the arterial stenosis was also recorded. For any discrepancy between the 2 readers, another senior neuroradiologist (X.n.H. with 20 years' experience) re-evaluated the images and assisted in reaching a consensus agreement. The consensus scores were used for the subsequent analyses.
The degree of luminal stenosis was calculated using the following formula: stenosis ratio = (1 − Narrow Lumen Diameter/Reference Lumen Diameter) × 100%, according to the Warfarin-Aspirin Symptomatic Intracranial Disease criterion.18 The reference lumen was defined as the neighboring segment of normal appearance proximal to the stenotic site. The measurement results of the luminal stenosis ratio from the 2 neuroradiologists were averaged for subsequent analysis.
After that, the MIP images were presented to the 2 neuroradiologists in randomized order for a side-by-side comparison the next day. The readers were blinded to the type of reconstruction. They viewed the MIP images of CS-TOF and PI-TOF simultaneously and ranked the images in order of diagnostic quality preference (CS-TOF better than PI-TOF, or equivalent, or PI-TOF better than CS-TOF) on the basis of the criteria that included delineation of the cerebral arteries and recognition of arterial stenosis.
Arterial Sharpness Evaluation
The edge sharpness of the intracranial arteries was calculated by a perceptual image sharpness metric called the Perceptual Sharpness Index based on MIP images, according to a previous report,19 using Matlab (2013b; MathWorks, Natick, Massachusetts). The Perceptual Sharpness Index represents the perceived sharpness in an image. Briefly, the method estimates the sharpness on the basis of a statistical analysis of local edge gradients. It is a no-reference metric and takes properties of the human visual system into account. Based on perceptual properties, a relationship between the extracted statistical features and the metric score is established to form a Perceptual Sharpness Index.
Statistical Analysis
The interrater reliability was performed using the Cohen κ analysis for grading the diagnostic quality and visualization of arterial stenosis. The intraclass correlation coefficients were calculated for measurement of the luminal stenosis ratio. Reliabilities <0.4 were characterized as poor; 0.4–0.6, fair; 0.6–0.8, good; and those >0.8 were deemed excellent. Continuous data were summarized as mean ± SD, and they were assessed for normality by the Kolmogorov-Smirnov test before further comparison. Categoric data were recorded as counts and percentages. The diagnostic quality and visualization of arterial stenoses on PI-TOF and CS-TOF were compared using the Wilcoxon signed rank test. The luminal stenosis ratio and the edge sharpness of the intracranial arteries were compared using a paired-sample t test if the data were normally distributed or the Wilcoxon signed rank test as appropriate. All the statistical analyses were performed using SPSS (Version 16.0; IBM, Armonk, New York). The P value was 2-sided, and P < .05 was considered statistically significant.
Results
Patient Characteristics
Among the 22 patients (11 men, 11 women; 28–86 years of age), 12 had multiple segments of intracranial arterial stenosis and 3 were eventually diagnosed with Moyamoya disease. No patient with a single stenosis seen only on 1 of the TOF sequences was found. In total, 48 arterial segments with stenosis were diagnosed. The demographic details of the patients in this study are listed in Table 2.
Patient demographics (N = 22)
Imaging Evaluation
The interrater agreement for diagnostic-quality grading was 0.776 and 0.753 for CS-TOF and PI-TOF, respectively. The senior neuroradiologist had to decide on a consensus for 1 of 22 (4.5%) cases of CS-TOF and 2 of 22 (9.1%) cases of PI-TOF. The diagnostic quality of most CS-TOF (90.9%) and PI-TOF (77.3%) images was graded as excellent. The CS-TOF images provided comparable diagnostic quality with the PI-TOF images (P = .046). The mean edge sharpness of the intracranial arteries for CS-TOF was 0.358 ± 0.038, significantly higher than that for PI-TOF (0.267 ± 0.042) (P < .001).
The interrater agreement for visualization of arterial stenosis was 1.000 and 0.778 for CS-TOF and PI-TOF, respectively. The senior neuroradiologist had to decide on a consensus for 2 of 48 (4.2%) segments on PI-TOF. Forty-eight (100%) and 43 (89.6%) segments of arterial stenosis were sufficiently recognized on CS-TOF and PI-TOF, respectively. Seven stenosed segments were recorded as probable stenosis on PI-TOF (grade 1), of which 5 were in the intracranial internal carotid artery, and 2 in the proximal M2 segment of the middle cerebral artery. Two segments of the intracranial ICA with suspicious stenosis on PI-TOF (Fig 1B) were eventually considered normal after comparison with CS-TOF in the same patients (Fig 1D) by the senior neuroradiologist. These segments were excluded from further analysis. The other 5 segments were recorded as grade 2 (definite stenosis) on CS-TOF. CS-TOF resulted in more confidence in diagnosing intracranial arterial stenosis than PI-TOF (P = .025).

Source images and coronal view of MIP images in a 42-year-old patient. The speckled noise in the center can be seen on the source image of conventional PI-TOF (A), whereas some artifacts with a curved stripe pattern can be seen on the source image of CS-TOF (C). These artifacts are eliminated on the MIP images and have little effect on the visualization of the stenosis. An obvious stenosis located in the M1 segment of the left middle cerebral artery is sufficiently visualized on both PI-TOF (B) and CS-TOF (D) (arrowheads). The edge sharpness of vessels on CS-TOF (D) is higher than that on PI-TOF (B) (short arrows). The image quality of the right intracranial internal carotid artery (long arrow, B) is improved on CS-TOF (D).
The intraclass correlation coefficient for luminal stenosis measurement was 0.980 and 0.979 for CS-TOF and PI-TOF, respectively. The mean luminal stenosis ratio measured on CS-TOF (57.9% ± 30.5%) showed no significant difference from that measured on PI-TOF (58.9% ± 31.0%) (P = .241). Table 3 shows detailed comparison results between CS-TOF and PI-TOF for the evaluation of intracranial arterial stenosis. Representative cases are shown in Figs 1 and 2. The degree of each luminal stenosis measured on CS-TOF and PI-TOF is shown in Fig 3.
Comparison between CS-TOF and PI-TOF for evaluating intracranial arterial stenosis

MIP images of a 68-year-old patient. Mild stenosis located in the proximal M1 segment of left middle cerebral artery can be sufficiently visualized on both PI-TOF (A) and CS-TOF (B) (arrowheads). The edge sharpness of vessels on CS-TOF is higher than that on PI-TOF (arrows).

The degree of each luminal stenosis measured on CS-TOF and PI-TOF, respectively.
Side-by-Side Comparison
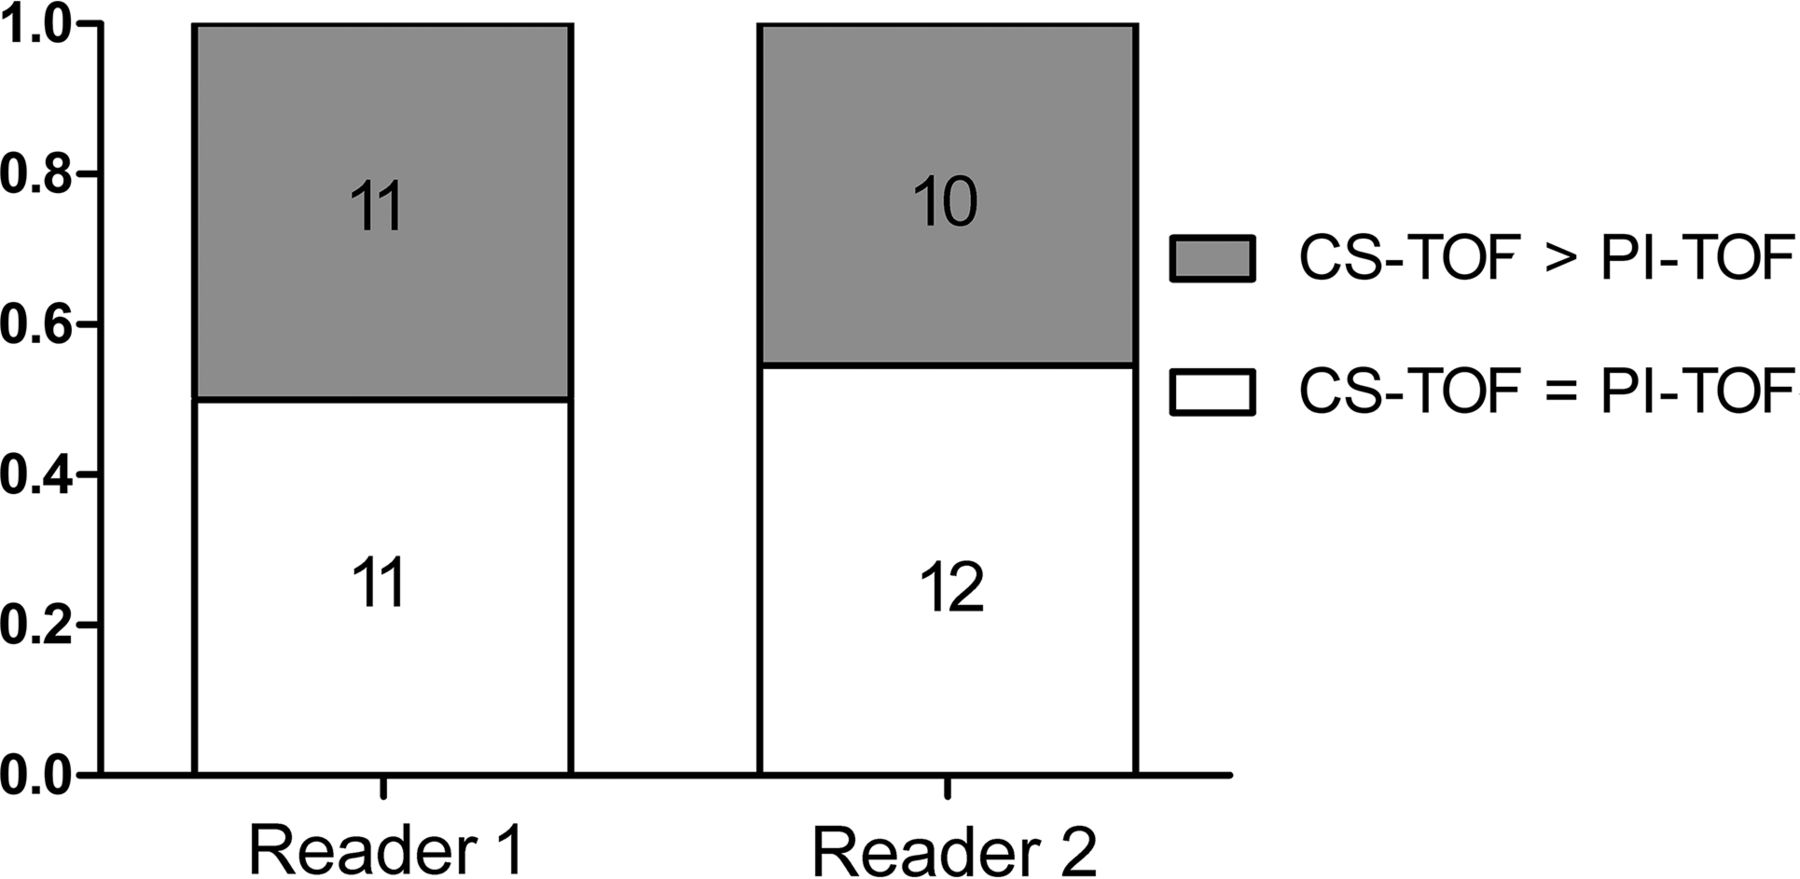
The interrater agreement for side-by-side comparisons of the CS-TOF and PI-TOF was 0.727. Figure 4 shows bar plots summarizing the 2 readers' preference. CS-TOF was considered not inferior to PI-TOF in all the cases. In nearly half of the cases (50.0% for reader 1 and 45.5% for reader 2), the diagnostic quality of CS-TOF was better than that of PI-TOF. For the other cases, the diagnostic quality of CS-TOF and PI-TOF was considered equivalent.

Bar plots of the 2 readers' preferences. CS-TOF is considered not inferior to PI-TOF in all cases. In 50.0% and 45.5% of patients, the diagnostic quality of CS-TOF is considered better than that of PI-TOF by each of the 2 readers.
Discussion
In the present study, we evaluated the diagnostic accuracy of CS-TOF for intracranial arterial stenosis by comparison with conventional PI-TOF. Our results showed that CS-TOF resulted in more clear visualization of arteries and more confidence in diagnosing intracranial arterial stenosis than PI-TOF, even in a reduced acquisition time of 2 minutes and 31 seconds.
3D TOF MRA is an effective and widely used tool to noninvasively evaluate and follow-up patients with cerebrovascular disease.20,21 However, to maintain a reasonable spatial resolution and provide detailed depictions of the vessels, the acquisition time is relatively long for conventional PI-TOF. Reduction of the scan time is clinically significant because motion artifacts would be decreased in a shortened scan time, which would particularly benefit patients with acute ischemic stroke.
CS is a novel technique that uses random undersampling.11,12,22 TOF-MRA is well-suited to CS because high-signal vessels are sparse in space.14,23⇓–25 Previously, sparse TOF has been investigated in patients with cerebral aneurysms by Fushimi et al.26 They reported that cerebral aneurysms were visible with equivalent clarity in sparse TOF and PI-TOF. The measured neck height and width of aneurysms were not significantly different when either method was used. Most recently, the same group studied the reliability of CS-TOF in the evaluation of Moyamoya disease.13 The group found that CS-TOF could improve the visualization of small collaterals in the same amount of time or produce the same results in a shorter acquisition time compared with PI-TOF. In our study, variable degrees of intracranial arterial stenosis (from mild stenosis to occlusion) were included. An acceleration factor of 10.3 for CS-TOF significantly shortened the acquisition time, while providing comparable image quality and more clear visualization of arteries than PI-TOF. The possibly stenosed segments recorded on PI-TOF included the intracranial ICA and proximal M2 segment of the MCA, of which 2 segments were considered artifactual narrowing caused by signal loss due to turbulent and slow flow according to previous studies.27 The diagnostic confidence of stenosis in these segments was improved on CS-TOF. The luminal stenosis ratio based on PI-TOF and CS-TOF was not significantly different; this finding suggests the absence of either over- or underestimation of the luminal stenosis grade due to irregular undersampling with CS-TOF.
We found that CS-TOF provided higher edge sharpness of the intracranial arteries than PI-TOF and enhanced the contrast of the vessels. In previous studies, the apparent contrast-to-background deviation of the sparse TOF images was reported to be stable at various acceleration factors and was significantly higher than with PI-TOF.11,26 Our results were consistent with these findings. The high apparent contrast-to-background deviations in CS-TOF may contribute to the better visualization of stenosis in segments of the intracranial ICA and proximal M2 segment of the MCA, as well as small branches, which are more prone to turbulent or slow flow.
Curved stripe pattern artifacts associated with sparse undersampling could be observed on all the source images of CS-TOF. Such artifacts are considered ghost artifacts originating from the skull boundaries.13 However, these artifacts are hardly noticeable on the MIP images of CS-TOF because the MIP connects the high-intensity dots of the blood vessels in 3D. Each point in the MIP represents the highest intensity experienced in that location on any partition within the imaging volume. Besides, the artifacts introduce an additional modulation of the already inhomogeneous background signal. The additional modulation is spatially slowly varying and of small amplitude compared with the normal signal variations in the background. Therefore, the performance of vessel segmentation algorithms performing well on the artifact-free image should not be degraded significantly by the artifacts. Moreover, the speckled noise on conventional PI-TOF in the central parts of the source images was reduced in CS-TOF. The total reconstruction time after scanning was approximately 1 minute 40 seconds for CS-TOF because we used a graphic processing unit in the current study, shortened to clinically acceptable times, compared with 10 minutes in a previous report.13
There are several limitations to our study. First, DSA is considered the criterion standard. However, only 4 patients had DSA within 4 months before or after the MRA examination. DSA is invasive, and when MRA can depict reliable arterial stenosis, DSA is not considered essential in clinical practice. Previous studies have verified a good correlation between TOF-MRA and DSA for detecting arterial stenosis, though the stenosis ratio may be overestimated on TOF-MRA.28 Patients with mild (<50%) or moderate intracranial arterial stenosis (50%–69%) account for a large proportion of all those with cerebrovascular diseases. However, such patients usually do not undergo DSA examinations. Because TOF-MRA is a good noninvasive screening tool, we considered that including patients with different stenosis ratios varying from mild stenosis to occlusion in our study would be more clinically significant. The evaluation of all the images was performed by 3 experienced neuroradiologists to avoid any false-positive or -negative judgment. In the case of stenosis seen only on 1 of the TOF sequences, the 3 neuroradiologists would confer to obtain a consensus. However, such a dilemma was very rare in our study (only 2 segments). Second, the in-plane resolution between PI-TOF and CS-TOF was identical (0.4 × 0.4 mm), while the slice thickness was not. Keeping the same voxel size (0.4 × 0.4 × 0.4 mm) as CS-TOF would lead to a scan time of around 11 minutes for PI-TOF. We therefore increased the slice thickness while keeping the slab thickness constant in the PI-TOF protocols to achieve an acceptable acquisition time of around 5 minutes. Third, the number of iterations was fixed at 10 in the current study, consistent with a previous report by Yamamoto et al.24 Fushimi et al11 reported that CS-TOF with 10 iterations could provide adequate image quality for the clinical diagnosis of cerebral aneurysms. Vessel sharpness and the visibility of small vessels can be improved with an increasing number of iterations,14 resulting in a largely extended reconstruction time. The reconstruction time would be 4 minutes 50 seconds if the iterations were increased to 20 in our study, which may affect the clinical examination workflow.
Conclusions
The image quality of highly accelerated CS-TOF is comparable with that of PI-TOF, while CS-TOF has the obvious benefit of reducing imaging time and boosts confidence in diagnosing intracranial arterial stenosis.
Acknowledgments
We sincerely thank Long-quan Dai from Nanjing University of Sciences and Technology for his kind and warm help during the analysis of edge sharpness of the intracranial arteries. We also thank Min-lin Zhou from the National Clinical Research Center of Kidney Diseases, Jinling Hospital, for reviewing all the statistics.
Footnotes
Disclosures: Christoph Forman—UNRELATED: Employment: Siemens. Peter Speier—UNRELATED: Employment: Siemens, Michaela Schmidt—UNRELATED: Employment: Siemens. Comments: full-time employee; Stock/Stock Options: Siemens.
References
- Received May 17, 2018.
- Accepted after revision July 15, 2018.
- © 2018 by American Journal of Neuroradiology


