
Abstract
BACKGROUND AND PURPOSE: MR imaging is the key examination in the follow-up of patients with MS, by identification of new high-signal T2 brain lesions. However, identifying new lesions when scrolling through 2 follow-up MR images can be difficult and time-consuming. Our aim was to compare an automated coregistration-fusion reading approach with the standard approach by identifying new high-signal T2 brain lesions in patients with multiple sclerosis during follow-up MR imaging.
MATERIALS AND METHODS: This prospective monocenter study included 94 patients (mean age, 38.9 years) treated for MS with dimethyl fumarate from January 2014 to August 2016. One senior neuroradiologist and 1 junior radiologist checked for new high-signal T2 brain lesions, independently analyzing blinded image datasets with automated coregistration-fusion or the standard scroll-through approach with a 3-week delay between the 2 readings. A consensus reading with a second senior neuroradiologist served as a criterion standard for analyses. A Poisson regression and logistic and γ regressions were used to compare the 2 methods. Intra- and interobserver agreement was assessed by the κ coefficient.
RESULTS: There were significantly more new high-signal T2 lesions per patient detected with the coregistration-fusion method (7 versus 4, P < .001). The coregistration-fusion method detected significantly more patients with at least 1 new high-signal T2 lesion (59% versus 46%, P = .02) and was associated with significantly faster overall reading time (86 seconds faster, P < .001) and higher reader confidence (91% versus 40%, P < 1 × 10⁻⁴). Inter- and intraobserver agreement was excellent for counting new high-signal T2 lesions.
CONCLUSIONS: Our study showed that an automated coregistration-fusion method was more sensitive for detecting new high-signal T2 lesions in patients with MS and reducing reading time. This method could help to improve follow-up care.
ABBREVIATIONS:
- CF
- coregistration-fusion
- HST2
- high-signal T2
- IQR
- interquartile range
MR imaging is the key examination in the diagnosis and follow-up of patients with MS, as emphasized by the McDonald Criteria1,2 or the more recent Magnetic Resonance Imaging in Multiple Sclerosis (MAGNIMS) guidelines.3,4 MR imaging is of great value during follow-up care when new high-signal T2 (HST2) intensity lesions provide an objective indication of an active disease process in addition to clinical presentation, requiring potential therapeutic changes from providers.5,6
However, identifying new lesions when scrolling through 2 follow-up examinations is time-consuming and error-prone and can be extremely difficult in the case of high lesion burden. A few studies have shown that methods such as subtraction or registration could improve the detection of new HST2 lesions, but these approaches to imaging may not be practical in many clinical environments.7⇓⇓⇓⇓–12
The purpose of our study was to evaluate the efficacy of an automated coregistration-fusion (CF) approach during follow-up for patients with MS.
Materials and Methods
Research Design
We conducted a retrospective study in a tertiary referral center specialized in treating neurologic diseases, based on a prospective study data base (Monitoring of Patients Followed for a Multiple Sclerosis and Treated by Dimethyl-fumarate, NCT02047097; www.clinicaltrials.gov). This study was approved by a National Research Ethics Board and adhered to the tenets of the Declaration of Helsinki (institutional review board 2016-A00896-45). Signed informed consent was obtained from all subjects. This study follows the Strengthening the Reporting of Observational Studies in Epidemiology guidelines.13
Patients
Inclusion criteria were the following: older than 18 years of age with a confirmed diagnosis of MS and treatment with dimethyl fumarate and 2 MR imaging examinations, including 3D-FLAIR sequence, performed in our center on the same MR imaging machine, separated by an interval of at least 6 months.
From January 2014 to August 2016, ninety-four patients with MS were included in the study.
Chart Review
The following clinical data were noted at the time of inclusion: type of MS, year of symptom onset, duration of the disease, and the Expanded Disability Status Scale score.14 Clinical data are provided in the Table.
Patient characteristics
MR Imaging
All patients had the same MR imaging protocol, including 3D-FLAIR imaging, axial T2WI, 3D-spin-echo T1WI, and axial diffusion-weighted imaging. All imaging was performed on 2 machines: a 1.5T Achieva with a 16-channel head coil (Philips Healthcare, Best, the Netherlands) for 78 patients and a 3T Achieva with a 32-channel coil (Philips Healthcare) for 16 patients.
The 1.5T sequence parameters were as follows: 3D-FLAIR imaging (TR/TE = 7000/350 ms, TI = 2200 ms, voxel size =1.15 × 1.14 × 1.3 mm3, FOV = 250 × 217 × 182 mm3, total acquisition time = 4 minutes 47 seconds) and 3D-spin-echo T1WI (TR/TE = 400/9.4 ms, voxel size = 1.1 × 1.1 × 1.1 mm3, FOV = 250 × 250 × 180 mm3, total acquisition time = 3 minutes 59 seconds).
The 3T sequence parameters were as follows: 3D-FLAIR imaging (TR/TE = 8000/388 ms, TI = 2400 ms, voxel size = 0.9 × 0.9 × 1 mm3, FOV = 240 × 240 × 175 mm3, total acquisition time = 4 minutes 24 seconds) and 3D-spin-echo T1WI (TR/TE= 500/27 ms, voxel size = 1 × 1 × 1 mm3, FOV = 252 × 252 × 200 mm3, total acquisition time = 3 minutes 37 seconds).
Coregistration-Fusion
We performed the CF process on the workstation that we routinely use during our clinical sessions (Advantage Workstation 4.6; GE Healthcare, Milwaukee, Wisconsin). The CF process available as standard on the Advantage Workstation console is based on a software algorithm that normalizes examinations spatially using rigid body registration. Once the MR images are acquired, they are automatically transmitted to our usual reading console located in our usual reading room. The reader then manually selects the sequences, the 3D-FLAIR sequences in our study, of the current and previous examinations to be analyzed and launches the CF process.
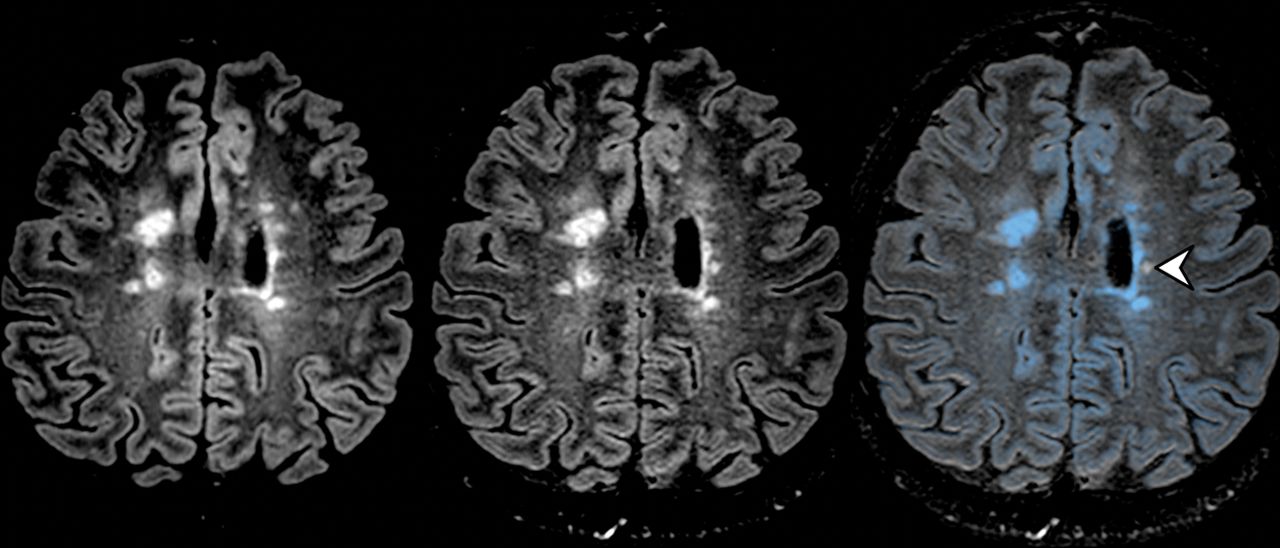
The CF process is then carried out automatically. The 2 images are automatically coregistered and merged, and one of the images is artificially colored. We have arbitrarily chosen to color the old examination blue so that new lesions appear white while pre-existing lesions appear blue. The standard algorithm does not perform either suppression of healthy white matter or any preselection of the HST2 lesions before applying the colors. There is no automated thresholding. The degree of transparency and the intensity of the color applied are dependent on the MR imaging signal intensity and are set manually by the operator. Thus, the areas of lower MR imaging intensity correspond to the areas of maximal transparency and do not appear blue. The transparency ramp is globally linear. Globally, readers modify these settings so the healthy white matter has a minimal intensity, and the MS lesions have the highest intensity, as shown in On-line Video 1. In our study, readers could adjust the window width. The reading console finally displays 3 separate synchronized screens: 2 screens with the 3D-FLAIR sequences of the current and previous examination and a third screen with the fused sequences. The reader can thus analyze the images and check the native images to confirm the presence or absence of a new lesion. The merged images are automatically sent to the PACS to be available for clinicians or later review. Fig 1 artificially details the steps of the CF process, which are performed automatically by the workstation. On-line Video 1 shows a screenshot of the entire process being performed, and On-line Video 2 shows the final result after CF.

Automated MR imaging coregistration-fusion method. A, First step of the CF method: Two 3D-FLAIR images in the axial plane (the previous one on the left and the new one on the right) appear side by side. Note that the ventricles and cerebral sulci are different in size and orientation due to differences in laterolateral and anteroposterior orientation in the image acquisition. B, Second step of CF method: The 2 examinations are perfectly coregistered and linked so that the images can be scrolled together to display the same anatomic level. C, Third step: The previous (left) examination and the current one (middle) are merged, and the fusion image (right) is automatically artificially colored blue. All the pre-existing lesions are blue (black arrowheads), whereas the new ones are white (white arrowheads), highlighting their presence to the reader.
Image Analysis
In our 94 patients, we compared a single pair of separate MR imaging examinations spaced at least 6 months apart. Two radiologists, blinded to clinical data, read independently and in random order the MR imaging examinations using a standard method (ie, scrolling through a side-by-side comparison of the most recent and previous 3D-FLAIR images) or an automated coregistration-fusion method, with at least 3 weeks between the 2 readings to avoid recognition. The first senior neuroradiologist was specialized in neuroimaging with 3 years of experience (A.G.), and the second was a junior radiologist with no experience in neuroimaging (A.C.). They did not have a time limit on their reading but were instructed to read the examinations under conditions of current clinical practice, doing their best to detect new lesions. A dedicated consensus reading session was performed with a third reader, a second senior neuroradiologist with 8 years of experience (A.L.), 6 weeks later to serve as a criterion standard for analysis. He performed his reading independent of the other authors and before statistical analysis. He could use both standard and coregistration-fusion approaches. Conditions were replicated 3 months later to assess intrareader agreement. All examinations were read on the same dedicated workstation.
Readers assessed the following characteristics on a standardized report form:
The presence and number of new HST2 lesions defined as nonartifactual, new, bright areas clearly visible against the background.
The volume of lesion burden classified as low (<10 HST2) or high (>10 HST2).
Repartition of the lesions classified as individual lesion spots and converging lesions.
Reading time measured by an independent timekeeper, starting from the selection of the patient from electronic medical records up to the end of the reading. Reading time included CF processing time. The end of the reading was decided by the reader after identifying all the lesions.
The quality of the examinations classified as excellent, moderate, or poor.
The degree of reading confidence classified as excellent, moderate, or poor.
Failure or success of coregistration-fusion.
Statistical Analysis
Quantitative variables were presented as means and medians (interquartile range [IQR]), and categoric variables, as percentages. Mixed models were fit to compare the 2 reading methods: A Poisson regression was used for the number of new HST2 lesions; a logistical regression, for binary variables such as the presence of at least 1 new HST2 lesion or the degree of confidence; and a γ regression, for the reading time. The Light κ coefficient15 and intraclass correlation coefficient16 were used to assess interobserver and intraobserver agreement for the presence of at least 1 new HST2 lesion and for the number of new HST2 lesions. According to the Landis and Koch15 guidelines, values of κ < 0 indicate no agreement; 0–0.20, slight; 0.21–0.40, fair; 0.41–0.60, moderate; 0.61–0.80, substantial; and 0.81–1, excellent agreement.
Poor, fair, good, and excellent agreement categories were qualified according to Cicchetti.16 A P value below .05 was considered statistically significant. Analyses were performed using R, Version 3.3.2 (http://www.r-project.org/).17 The statistical analysis was conducted by M.A.M.
Results
Demographic and Clinical Characteristics
Ninety-four patients (188 paired MR imaging studies) with a confirmed diagnosis of treated MS (52 women and 42 men; mean age, 38.9 ± 11.3 years) were included in the study from January 2014 to August 2016. The mean Expanded Disability Status Scale score was 3.2 ± 2.1. The mean disease duration was 13.6 ± 9.2 years. Demographic and clinical data are presented in the Table.
Imaging
Comparison of the Reading Methods.
There were significantly more new HST2 lesions per patient discovered with the CF method as opposed to the standard one: 7 (IQR, 12) versus 4 (IQR, 6) (P < .001) (Figs 2 and 3). Forty-seven patients had more lesions discovered with the CF method compared with the standard method, whereas 6 patients had more lesions discovered with the standard method compared with the CF (On-line Figure).

Previous and new 3D-FLAIR MR imaging of a 35-year-old woman with MS. The coregistration-fusion image (right) shows multiple new HST2 lesions; some of them are obvious (arrows), while others are discrete and potentially difficult to detect using the standard method (white arrowheads). Note that the CF method also allows the identification of a lesion that shrank during follow-up (black arrowhead).

Comparison of the number of new HST2 lesions for each reader. Significant differences are indicated with the P value. The median number of new HST2 lesions is represented by the black line.
There were significantly more patients with at least 1 new HST2 lesion discovered with the CF method compared with the standard method (57 [61%] versus 43 [46%], P = .02) (Fig 4). Seventeen patients had at least 1 new HST2 lesion discovered with the CF method compared with the standard method, and 3 had at least 1 new HST2 discovered with the standard method compared with the CF method. Twenty-two (23.4%) patients had at least 3 new HST2 lesions detected with the CF method but fewer than 2 new HST2 lesions with the standard method. MR imaging data for all readers are presented in Fig 3.

Previous and new 3D-FLAIR MR imaging of a 35-year-old woman with MS. The coregistration-fusion image (right) shows only 1 small HST2 lesion (white arrowhead) among several older blue ones.
Detection of new HST2 lesions was significantly higher among patients with a high lesion burden or with converging lesions with the CF method as opposed to the standard method (P < .001 and P < .001, respectively).
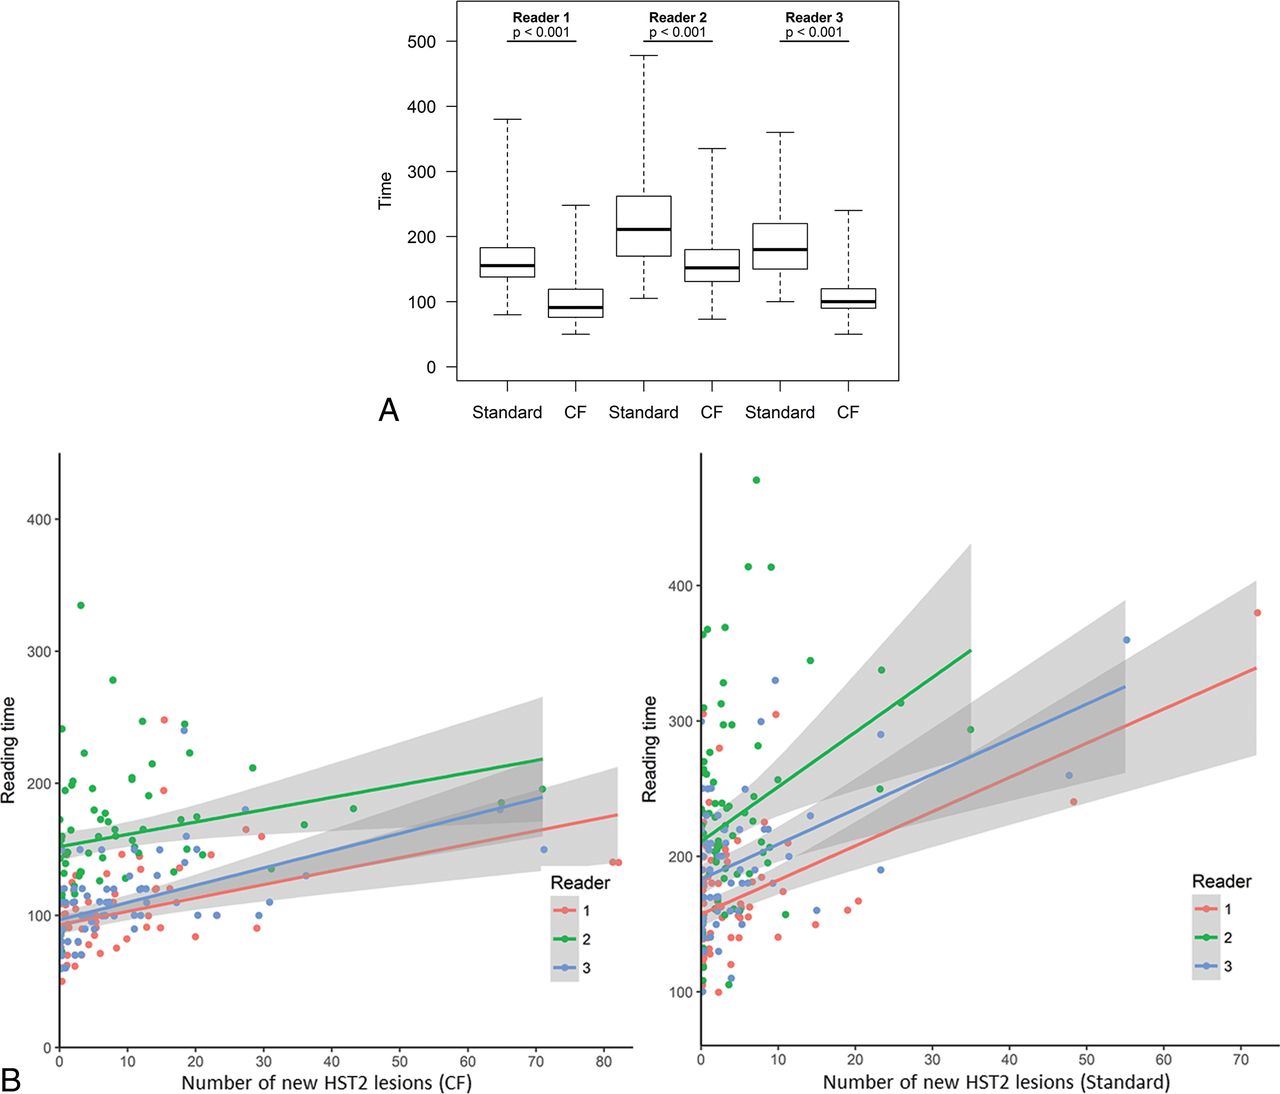
Reading time was significantly reduced with the CF method versus the standard one: 106 ± 31 seconds, including 20 ± 5 seconds of processing, versus 192 ± 54 seconds (P < .001). MR imaging data for all readers are presented in Fig 5.

Comparison of the overall reading time for each reader. Significant differences are indicated with the P value (A). The reading time is indicated in seconds. Note the mild linear increase of the reading time for all readers when facing a higher lesion burden using the CF method as opposed to a much sharper increase with the standard method (B).
The dichotomized degree of confidence (excellent and moderate versus poor) was significantly higher with the CF method as opposed to the standard one: 91% versus 40% (P < 1 × 10⁻⁴).
Inter- and Intraobserver Agreement
Interobserver agreement was substantial for the presence of at least 1 new HST2 lesion (κ = 0.80 [IQR, 0.67–0.88] and 0.75 [IQR, 0.63–0.84]) and excellent for counting new HST2 lesions (intraclass correlation coefficient = 0.97 [IQR, 0.94–0.98] and 0.88 [IQR, 0.83–0.92]) with the CF and the standard methods, respectively.
Intraobserver agreement was excellent for the presence of at least 1 new HST2 lesion (κ = 1) and counting new HST2 lesions (intraclass correlation coefficient = 0.95 [0.67–0.99]) using the CF method.
Discussion
Our study showed that the CF method was significantly more sensitive when detecting new HST2 lesions as opposed to the standard method, with a helpful reduction in reading time and significantly higher reader-reported confidence.
Our results are in accordance with the literature in which different optimized reading techniques have been compared with scrolling through images, as in subtraction techniques7,9,11,18,19 or with semiautomated12 or automated8,10 assistive software platforms. These methods have shown improvement in detecting new lesions and reducing radiologists' false-negative errors. Some authors now consider them the criterion standard for detecting new HST2 lesions in MS studies.20 Despite their benefits, optimized readings remain time-consuming,7 require specific software and training,12 and ultimately may not be practical for most clinical environments. In our study, the CF method detected 80% more lesions than the standard one, which is within the range of 1.5–2.1 times more detections in reports on the advantages of optimized methods.12,21,22 To the best of our knowledge, no one has yet investigated the feasibility and efficacy of combining a coregistration and fusion imaging method in follow-up examination of patients with MS.
Guidelines state that routine brain imaging should be considered every 6 months to 2 years for all patients with relapsing MS.23 Conventional side-by-side comparison is tiring, inefficient, error-prone, and, moreover, not sufficiently reliable due to varying levels of training among readers.12,20 In our study, the CF method showed significantly reduced reading time with increased lesion detection. This kind of success supports accuracy and high-quality care in a frequently disrupted work environment.24 The CF method is automated, can be easily performed in a few steps, and does not require any specific training. It is workable during routine clinical practice. This technique can be easily integrated into the workflow, unlike most assistive software and subtraction techniques. Furthermore, our study demonstrated a jump in reader confidence, suggesting that easier and more reliable answers could be integrated into care, especially in patients who already face a high lesion burden. Moreover, our results show that even a young radiologist not specialized in neuroradiology worked fast and accurately when looking for new HST2 lesions; this outcome is particularly interesting considering that non-neuroradiologists previously showed poorer detection rates when searching for new HST2 lesions compared with specialists.20
Therapeutic decisions often hinge on searching for new lesions in patients with MS for whom positive detection normally indicates disease progression.25⇓–27
Three or more new HST2 lesions were reported to be associated with a worse disability in patients treated with interferon-β,28 while a threshold of 5 new HST2 lesions has been used in the Modified Rio Score to predict therapeutic efficacy.26 In our study, readers saw 23.4% of patients with at least 3 new HST2 lesions visible with the CF method but fewer than 2 using side-by-side comparison, meaning less advanced imaging leaves patients underdiagnosed and misclassified as having “no evidence of disease activity,” which is increasingly considered the treatment goal.29
In addition to MR imaging, radiologists use gadolinium-based contrast agents when checking for new lesions indicating MS progression,25 but the sensitivity and prognostic value of this marker alone are limited because lesions should have appeared in ≤3 weeks old to detect them.30 Moreover, recent studies31 have suggested that gadolinium-based contrast agents could accumulate in the brains of patients who have undergone multiple contrast-enhanced MR imaging studies. Therefore, the most recent guidelines4 recommend that clinicians carefully evaluate the necessity of using gadolinium-based contrast agents. Therefore, an optimized HST2 lesion-detection method such as CF might be a sensitive way to assess lesion change during follow-up of patients with MS,32 while avoiding or reducing the use of gadolinium-based contrast agents.
European and American guidelines provide recommendations about MR imaging protocols for this patient population4,23 but lack consensus on how to use 3D sequences and offer nothing on advised reading methods. 3D sequences come highly recommended,23,33 largely because it is now feasible on most scanners to acquire 3D image datasets with isotropic resolution in clinically acceptable scan times. Our results support these recommendations, especially for 3D-FLAIR, because 3D sequences support accurate coregistration or subtraction methods34 and increase accurate reading performance. New guidelines could include specific recommendations about improved reading methods such as CF.
Our study has limitations. First, the overall number of patients is relatively small. Second, we analyzed only MR imaging with 3D-FLAIR sequences, which are more easily coregistrated than 2D sequences. The practice of using 3D sequences is not yet widespread in all hospitals or in private practice; thus, our results may not be applied in all centers. Third, a high number of patients were followed on a 1.5T MR machine, with performance reported to be less sensitive for detecting new HST2 lesions. Fourth, readers knew which method they were assessing, which could have led to a certain bias.
Conclusions
Our study showed that a CF method was significantly more sensitive when detecting new HST2 lesions as opposed to manually scrolling through 2 images, with significantly decreased reading time and significantly higher reader-reported confidence. It might be interesting to evaluate this method on different PACS and posttreatment systems in the future.
Acknowledgments
Laura McMaster provided professional English-language medical editing of this article.
Footnotes
Disclosures: Antoine Guéguen—UNRELATED: Board Membership: Novartis, Merck, Roche; Consultancy: Novartis, Sanofi Genzyme; Grants/Grants Pending: CSL Bering; Payment for Lectures Including Service on Speakers Bureaus: Roche; Travel/Accommodations/Meeting Expenses Unrelated to Activities Listed: Teva Pharmaceutical Industries, Roche, Biogen, Sanofi Genzyme. Jennifer Aboab—UNRELATED: Board Membership: Merck Serono.
References
- Received January 9, 2018.
- Accepted after revision April 11, 2018.
- © 2018 by American Journal of Neuroradiology


Jump to section
Related Articles
Cited By...
- Evaluation of the Statistical Detection of Change Algorithm for Screening Patients with MS with New Lesion Activity on Longitudinal Brain MRI
- Revolutionizing MS Monitoring: The Impact of Postprocessing Techniques on Lesion Detection
- Revolutionizing MS Monitoring: The Impact of Postprocessing Techniques on Lesion Detection
- Evaluation of the Statistical Detection of Change Algorithm for Screening Patients with MS with New Lesion Activity on Longitudinal Brain MRI
- Evaluation of statistical detection of change algorithm for triaging multiple sclerosis patients with new lesion activity on longitudinal brain MRI
- Automated Color-Coding of Lesion Changes in Contrast-Enhanced 3D T1-Weighted Sequences for MRI Follow-up of Brain Metastases
- PACS Integration of Semiautomated Imaging Software Improves Day-to-Day MS Disease Activity Detection