Advertisement

Main menu

  • Home
  • Content
    • Current Issue
    • Accepted Manuscripts
    • Article Preview
    • Past Issue Archive
    • AJNR Case Collection
    • Case of the Week Archive
    • Classic Case Archive
    • Case of the Month Archive
  • Special Collections
    • Spinal CSF Leak Articles (Jan 2020-June 2024)
    • 2024 AJNR Journal Awards
    • Most Impactful AJNR Articles
  • Multimedia
    • AJNR Podcast
    • AJNR Scantastics
    • Video Articles
  • For Authors
    • Submit a Manuscript
    • Author Policies
    • Fast publishing of Accepted Manuscripts
    • Graphical Abstract Preparation
    • Manuscript Submission Guidelines
    • Imaging Protocol Submission
    • Submit a Case for the Case Collection
  • About Us
    • About AJNR
    • Editorial Board
  • More
    • Become a Reviewer/Academy of Reviewers
    • Subscribers
    • Permissions
    • Alerts
    • Feedback
    • Advertisers
    • ASNR Home
  • Other Publications
    • ajnr

User menu

  • Alerts
  • Log in

Search

  • Advanced search
American Journal of Neuroradiology

American Journal of Neuroradiology

ASHNR American Society of Functional Neuroradiology ASHNR American Society of Pediatric Neuroradiology ASSR
  • Alerts
  • Log in

Advanced Search

  • Home
  • Content
    • Current Issue
    • Accepted Manuscripts
    • Article Preview
    • Past Issue Archive
    • AJNR Case Collection
    • Case of the Week Archive
    • Classic Case Archive
    • Case of the Month Archive
  • Special Collections
    • Spinal CSF Leak Articles (Jan 2020-June 2024)
    • 2024 AJNR Journal Awards
    • Most Impactful AJNR Articles
  • Multimedia
    • AJNR Podcast
    • AJNR Scantastics
    • Video Articles
  • For Authors
    • Submit a Manuscript
    • Author Policies
    • Fast publishing of Accepted Manuscripts
    • Graphical Abstract Preparation
    • Manuscript Submission Guidelines
    • Imaging Protocol Submission
    • Submit a Case for the Case Collection
  • About Us
    • About AJNR
    • Editorial Board
  • More
    • Become a Reviewer/Academy of Reviewers
    • Subscribers
    • Permissions
    • Alerts
    • Feedback
    • Advertisers
    • ASNR Home
  • Follow AJNR on Twitter
  • Visit AJNR on Facebook
  • Follow AJNR on Instagram
  • Join AJNR on LinkedIn
  • RSS Feeds

Welcome to the new AJNR, Updated Hall of Fame, and more. Read the full announcements.


AJNR is seeking candidates for the position of Associate Section Editor, AJNR Case Collection. Read the full announcement.


Research ArticleAdult Brain

MRI Quantitative T2* Mapping to Predict Dominant Composition of In Vitro Thrombus

R. Bourcier, R. Pautre, M. Mirza, C. Castets, J. Darcourt, J. Labreuche, L. Detraz, H. Desal, J.-M. Serfaty and C. Toquet
American Journal of Neuroradiology January 2019, 40 (1) 59-64; DOI: https://doi.org/10.3174/ajnr.A5938
R. Bourcier
aFrom the Departments of Neuroradiology (R.B., R.P., L.D., H.D.)
  • Find this author on Google Scholar
  • Find this author on PubMed
  • Search for this author on this site
  • ORCID record for R. Bourcier
R. Pautre
aFrom the Departments of Neuroradiology (R.B., R.P., L.D., H.D.)
  • Find this author on Google Scholar
  • Find this author on PubMed
  • Search for this author on this site
  • ORCID record for R. Pautre
M. Mirza
cNeuravi Thromboembolic Initiative (M.M.), Galway, Ireland
  • Find this author on Google Scholar
  • Find this author on PubMed
  • Search for this author on this site
  • ORCID record for M. Mirza
C. Castets
dSiemens Healthineers France (C.C.), Saint-Denis, France
  • Find this author on Google Scholar
  • Find this author on PubMed
  • Search for this author on this site
  • ORCID record for C. Castets
J. Darcourt
eDepartment of Neuroradiology (J.D.), Hôpital Purpan, Centre Hospitalier Universitaire de Toulouse, Toulouse, France
  • Find this author on Google Scholar
  • Find this author on PubMed
  • Search for this author on this site
  • ORCID record for J. Darcourt
J. Labreuche
fDepartment of Biostatistics (J.L.), Université de Lille, Centre Hospitalier Universitaire Lille, Lille, France
  • Find this author on Google Scholar
  • Find this author on PubMed
  • Search for this author on this site
  • ORCID record for J. Labreuche
L. Detraz
aFrom the Departments of Neuroradiology (R.B., R.P., L.D., H.D.)
  • Find this author on Google Scholar
  • Find this author on PubMed
  • Search for this author on this site
  • ORCID record for L. Detraz
H. Desal
aFrom the Departments of Neuroradiology (R.B., R.P., L.D., H.D.)
  • Find this author on Google Scholar
  • Find this author on PubMed
  • Search for this author on this site
  • ORCID record for H. Desal
J.-M. Serfaty
bCardiac and Vascular Imaging (J.-M.S.), Hôpital René et Guillaume Laennec, Centre Hospitalier Universitaire de Nantes, Nantes, France
  • Find this author on Google Scholar
  • Find this author on PubMed
  • Search for this author on this site
  • ORCID record for J.-M. Serfaty
C. Toquet
gDepartment of Pathology (C.T.), Hôtel Dieu, Centre Hospitalier Universitaire de Nantes, Nantes, France.
  • Find this author on Google Scholar
  • Find this author on PubMed
  • Search for this author on this site
  • ORCID record for C. Toquet
  • Article
  • Figures & Data
  • Info & Metrics
  • Responses
  • References
  • PDF
Loading

Abstract

BACKGROUND AND PURPOSE: MR imaging quantitative T2* mapping, which provides information about thrombus composition and specifically the red blood cell content, may be obtained in the setting of acute ischemic stroke before treatment. This could be useful to adapt the endovascular strategy. We aimed to analyze the red blood cell content of in vitro thrombi in relation to the thrombus-T2* relaxation time.

MATERIALS AND METHODS: Thirty-five thrombus analogs of different compositions were scanned with an MR imaging quantitative T2* mapping sequence. Two radiologists, blinded to thrombus composition, measured the thrombus-T2* relaxation time twice at an interval of 2 weeks. Quantitative histologic evaluations of red blood cell content were performed. Inter- and intraobserver reproducibility of the thrombus-T2* relaxation time was assessed by calculating intraclass correlation coefficients. Finally, a Spearman product moment correlation between the thrombus-T2* relaxation time and red blood cell content was performed.

RESULTS: The median thrombus-T2* relaxation time was 78.5 ms (range, 16–268 ms; interquartile range, 60.5 ms). The median red blood cell content was 55% (range, 0%–100%; interquartile range, 75%). Inter- and intraobserver reproducibility of the thrombus-T2* relaxation time was excellent (>0.9). The Spearman rank correlation test found a significant inverse correlation between thrombus-T2* relaxation time and red blood cell content (ρ = −0.834, P < .001).

CONCLUSIONS: MR imaging quantitative T2* mapping can reliably identify the thrombus red blood cell content in vitro. This fast, easy-to-use sequence could be implemented in routine practice to predict stroke etiology and adapt devices or techniques for endovascular treatment of acute ischemic stroke.

ABBREVIATIONS:

RBC
red blood cell
SVS
susceptibility vessel sign
TT2*RT
thrombus-T2* relaxation time

Sudden occlusion of an intracranial artery by a thrombus represents the pivotal event in anterior acute ischemic stroke. Consequently, the primary goal of acute stroke treatment is to restore perfusion by lysing the thrombus with intravenous thrombolysis and/or retrieving the thrombus with mechanical thrombectomy.1 The red blood cell (RBC) content may be especially critical to tailor the endovascular treatment. As demonstrated by Hashimoto et al,2 the interaction between the stent-retriever struts and the thrombus is likely dependent on the number of RBCs in the thrombus.3 Hence a first-line imaging-screening protocol that can provide the proportion of RBCs in the whole thrombus would be helpful when planning a treatment strategy. In this field, the T2* sequence offers acquisition times suited to the context of emergency acute ischemic stroke. The susceptibility vessel sign (SVS) on T2* MR imaging is defined by a hypointense signal, exceeding the diameter of the contralateral artery, located at the site of the thrombus.4 A positive SVS (SVS+) correlates with an RBC-dominant thrombus, whereas a lack of SVS (SVS−) indicates a fibrin-dominant thrombus.3

However, a binary assessment of thrombus composition (either SVS+ or SVS−) may not reflect the complex nature of thrombi in which different regions may have different content of RBCs.5⇓–7 Moreover, SVS+ can be difficult to determine in clinical practice because some thrombi may show a hypointense signal with a diameter equal to or slightly above that of the contralateral artery. Last, the diagnostic accuracy of the SVS to determine RBC content varies dramatically among MR imaging machines.8 Because T2* maps are commonly used to assess the cardiac and liver iron load in patients with thalassemia,9,10 measuring the thrombus T2* relaxation time (TT2*RT) could provide quantitative insight into thrombus composition rather than a qualitative evaluation using the SVS.11 In this study, we aimed to analyze the RBC content of in vitro thrombi in relation to the thrombus-T2* relaxation time and to examine the intra- and interobserver agreement of the TT2*RT measurements.

Materials and Methods

Blood Collection and Thrombus Formation

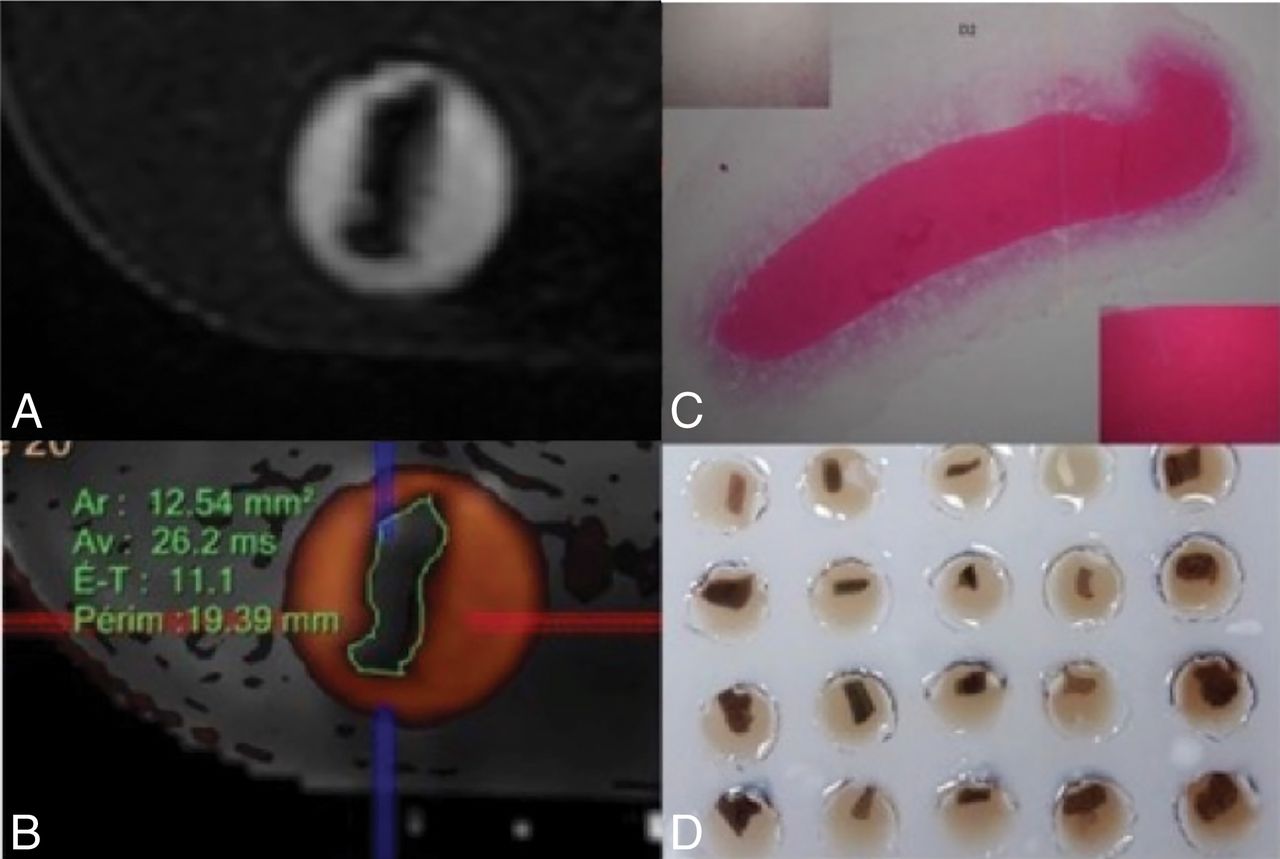
Detailed methods for blood collection and thrombus formation were previously published.12 In brief, ovine blood was obtained from a licensed facility (Ash Stream, Hollymount, Ireland). Seven different thrombi analog types were created, with 5 replicate thrombi for each type. To separate the whole-blood constituents, we performed centrifugation, and coagulation was generally initiated following the addition of a calcium chloride solution to the blood components. Erythrocyte, plasma, and white cell content were controlled by volume in the precoagulated solution. Finally, thrombi were prepared with different ratios of RBCs and fibrin. Clotted material was allowed to mature for approximately 30 minutes to 1 hour at 37°C. Then, thrombi were formed in either a static or dynamic environment and mixed with citrated plasma, thrombin, or platelets to promote thrombus retraction. Of note, the thrombus-creation results show that the environment influences thrombus composition. Specifically, even with the same initial volume and constituents of blood, a thrombus created in static conditions had a vastly different final histologic composition than the dynamic thrombus. To simulate realistic blood conditions and represent the wide range of human thrombus compositions, we used both types of environmental conditions to create thrombi. They were suspended in a physiologic serum within an MR imaging–compatible agarose matrix (Fig 1D).

Fig 1.
  • Download figure
  • Open in new tab
  • Download powerpoint
Fig 1.

A, MR images of 3D-CISS analog thrombi. B, MR images of coregistered T2 mapping and 3D-CISS analog thrombus. Thrombi were manually contoured and analyzed in their largest surface, with the support of multiplanar reconstruction. Thrombi were identified by their localization in the matrix to allow comparison with histologic data. C, Macroscopic view of floating thrombi. D, Matrix of agarose gel with holes filled with physiologic serum. Ar indicates surface; Av, mean T2* relaxation time; E-T, SD.

MR Imaging Analysis

Each thrombus was placed in a vial 4 cm deep and 8 mm wide, filled with physiologic serum. The thrombi were fully submerged at the bottom of the vials but were not embedded in the agarose gel. Thirty-five different thrombi were scanned simultaneously in an MR imaging machine. Experiments were performed on a 1.5T MR imaging unit (Magnetom Aera; Siemens, Erlangen, Germany) equipped with a system capable of 50 mT/m-1 maximum strength and 200 mT-1.s-1 maximum slew rate. A volume coil was used for excitation, while a head/neck coil composed of 20 receiver channels was used for signal reception.

A quantitative T2* mapping sequence based on multi-gradient-echo was used with the following imaging parameters: TR, 442 ms; 12 different TEs: 3.30, 4.72, 6.19, 9.12, 13.08, 17.04, 20.98, 24.92, 28.86, 32.80, 36.74, 40.68 ms; slice thickness, 3 mm; gap between slices, 0.3 mm; FOV, 260 × 260 mm; flip angle, 20°; matrix, 205 × 256; voxel size, 1.3 × 1.3 × 3 mm3; pass band, 930 Hz; acquisition time, 2 minutes and 32 seconds. We performed a 3D-CISS sequence with the following parameters: TR, 6.09 ms; TE, 2.81; section thickness, 0.5 mm; intersection gap, 0 mm; FOV, 190 × 154 mm; flip angle, 62°; matrix, 320 × 240; voxel size, 0.3 × 0.3 × 0.3; pass band, 300 Hz; acquisition time, 2.49 minutes.

The TT2*RT values were measured after coregistration with 3D-CISS images to visualize the boundaries of the thrombi and manually select an ROI to include the entire thrombus on an axial slice. The software automatically provided a mean TT2*RT value in milliseconds (in the ROI), the SD, and the size of the area in square millimeters.

After the MR imaging acquisition, the thrombus analogs were immediately embedded in paraffin for histologic analysis. The measurements by 2 radiologists (a junior radiologist and an experienced neuroradiologist) blinded to the histologic composition of the thrombi were performed in 2 sessions 2 weeks apart to examine inter- and intraobserver reliability.

Histologic Analysis

Immediately after the MR imaging acquisition, the thrombi were fixed in a 10% formalin solution. Formalin-fixed specimens were then embedded in paraffin, cut into 7-μm-thick sections, and stained with hematoxylin-eosin. Two experienced pathologists without knowledge of the laboratory-announced thrombus composition and the imaging findings performed the histologic evaluation independently. Discordant results were re-evaluated and were resolved by consensus. We identified the different components of the thrombi: fibrin/platelet aggregations, RBCs, and rarely found white blood cells. Slides were scanned and analyzed using NDP.view software (https://ndp-view.software.informer.com/). First, a low-power-field examination was used to identify pure fibrin clots (>95% fibrin), pure RBC clots (>95% RBCs), and heterogeneous clots. Preliminary evidence suggested that 2 pathologists working independently could reproducibly evaluate a 10% change in RBC content. Hence, we devised a simple scaling system (Fig 2) based on a 10% threshold that had a stepwise incremental increase in RBC content for this semiquantitative analysis. When the thrombus was heterogeneous, a 2-step procedure was devised. First, the RBC-dominant areas were evaluated by a semiquantitative analysis using a lattice composed of 10 × 10 squares at a high-power field. Second, the proportion of the RBC component was calculated as the ratio (percentage) of selected dominant RBC areas to the entire thrombus area. A 10% incremental scale was again applied.

Fig 2.
  • Download figure
  • Open in new tab
  • Download powerpoint
Fig 2.

This thrombus consists of RBC (A), fibrin/platelet aggregations (B), and very rare white bloods cells. The RBC-dominant areas were identified on microscopic examination; then, a green line was drawn to select each of them. The proportion of the RBC component was calculated as the ratio of selected dominant-RBC areas to the entire thrombus area (hematoxylin-eosin; original magnification, G×20; G×400).

Statistical Analysis

MR imaging quantitative T2* mapping results are expressed as median, range, and interquartile range due to the non-normal distribution. Normality of distributions was assessed using histograms and the Shapiro-Wilk test. Inter- and intraobserver reproducibility of the TT2*RT measurements was assessed by calculating intraclass correlation coefficients. The intraclass correlation coefficients were estimated using a 2-way random effects model (absolute agreement). Intraclass correlation coefficient values of <0.5, between 0.5 and 0.75, between 0.75 and 0.9, and >0.90 were interpreted as poor, moderate, good, and excellent reproducibility, respectively.13 The mean of the TT2*RT values (4 readings) was used in descriptive and correlation analyses. The correlation between TT2*RT values and histologic RBC content was assessed by calculating the Spearman rank correlation (ρ) coefficient. Ninety-five percent confidence intervals for intraclass correlation coefficients and ρ values were obtained using bootstrap methods (2000 bootstrap samples). All analyses were computed using R statistical and computing software (Version 3.5.1; http://www.r-project.org/).

Results

A total of 35 thrombi were histologically processed and analyzed. Inter- and intraobserver reproducibility of the TT2*RT measurements was excellent, with an intraclass correlation coefficient of 0.915 (95% CI, 0.783–0.981) for interobserver reproducibility at the first session, 0.944 (95% CI, 0.814–0.991) for interobserver reproducibility at the second session, 0.977 (95% CI, 0.961–0.988) for intraobserver reproducibility of the junior radiologist, and 0.982 (95% CI, 0.967–0.990) for intraobserver reproducibility of the senior neuroradiologist.

The median TT2*RT value was 78.5 ms (range, 16–268 ms; interquartile range, 60.5 ms). The median TT2*RT SD was 28.5 ms (range, 6–84 ms; interquartile range, 25.5 ms). The median TT2*RT area that reflects the cross-sectional size of the thrombi was 26 mm2 (range, 17–67 mm2; interquartile range, 23.3 mm2). The median RBC content was 55% (range, 0%–100%; interquartile range, 75%).

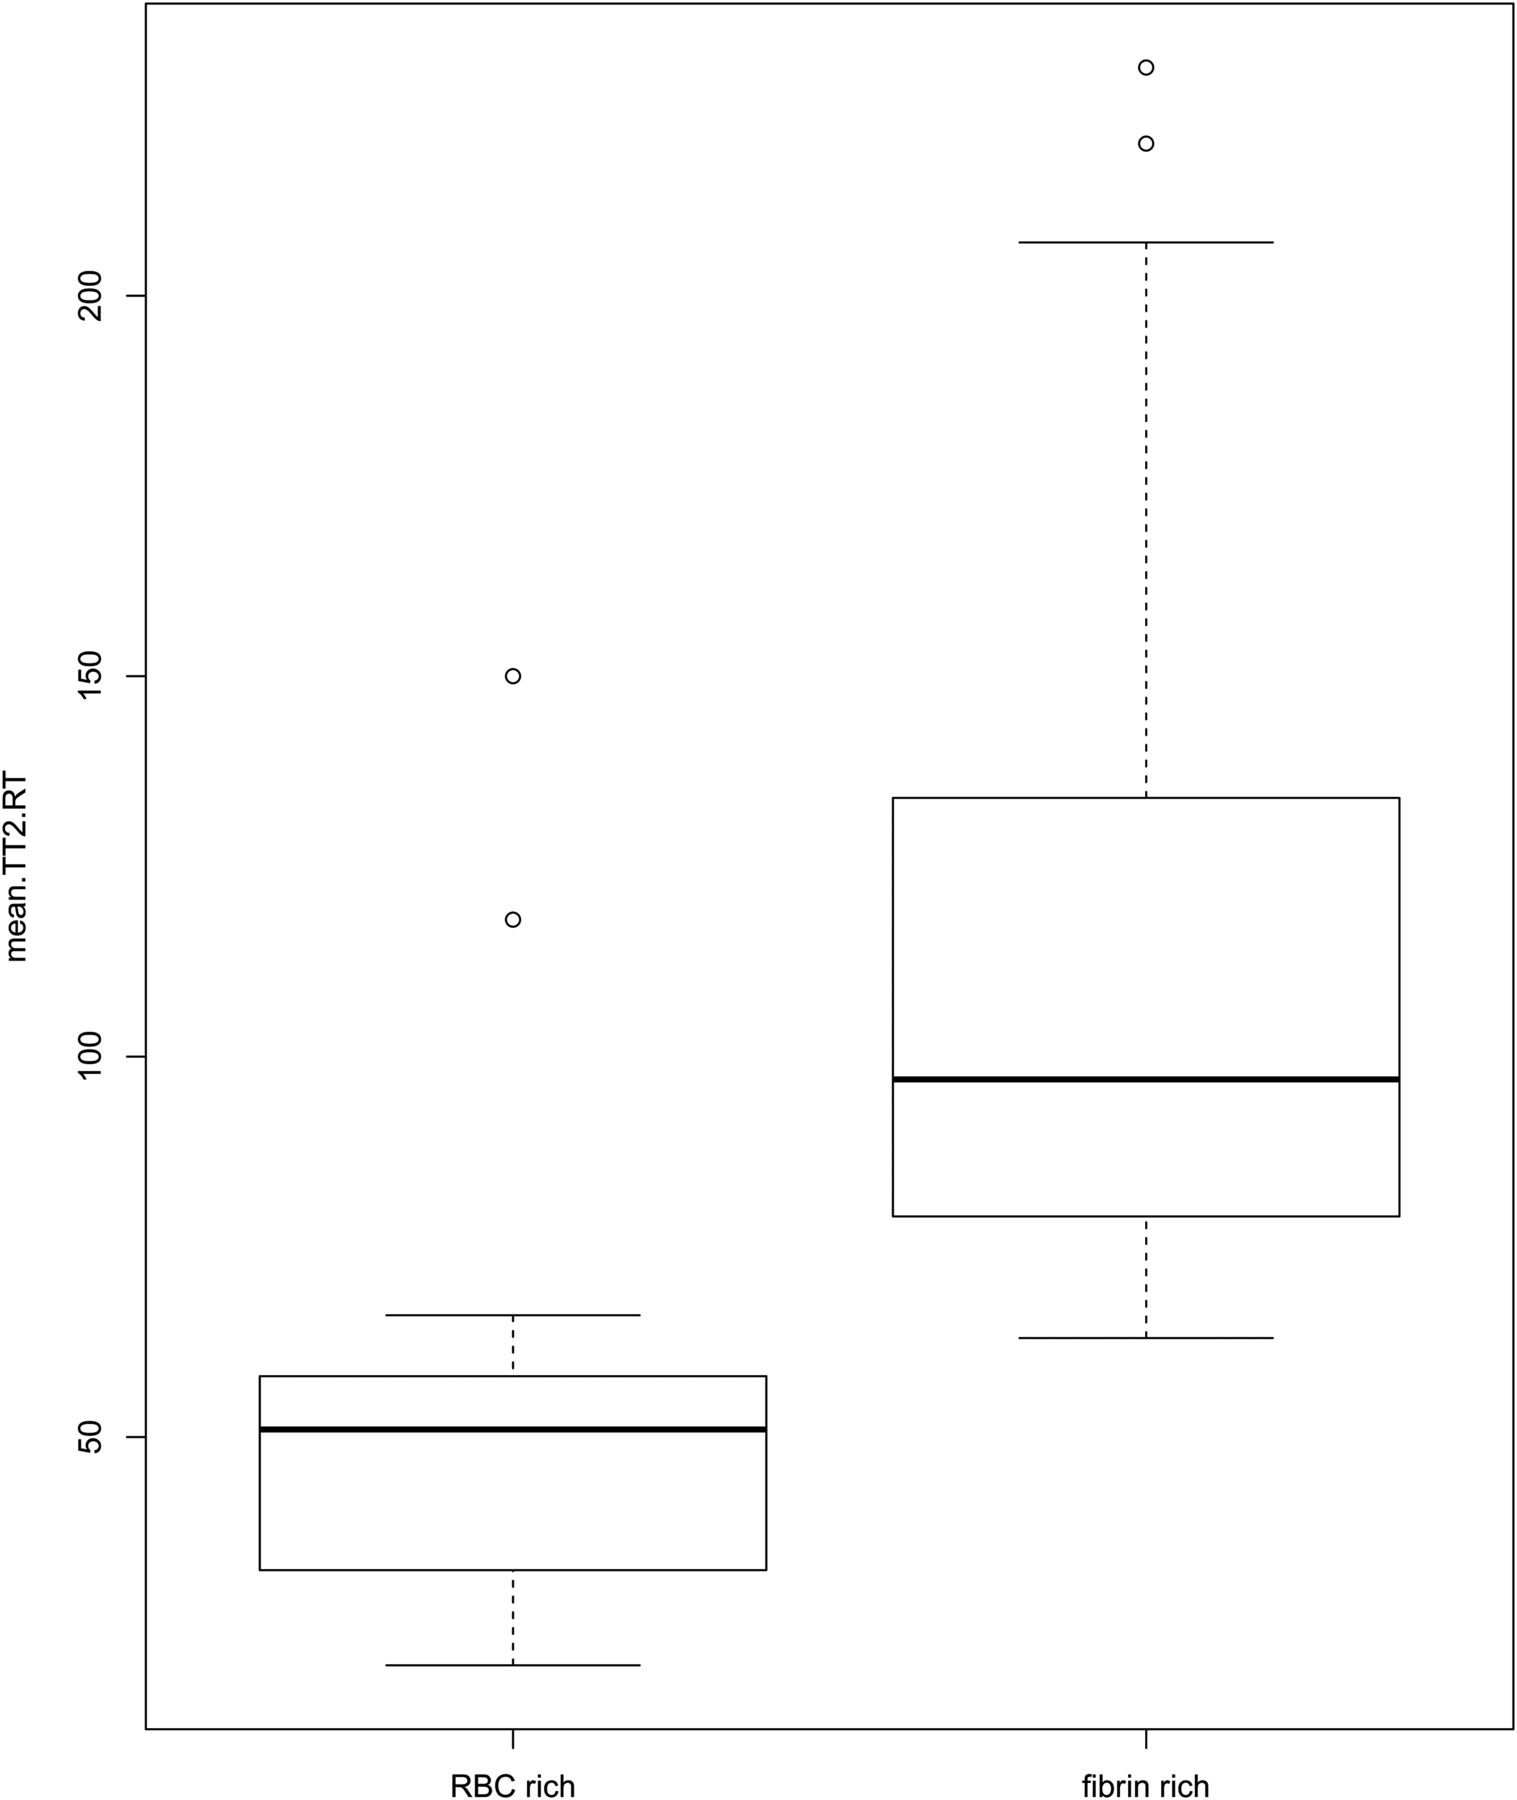
A strong negative correlation between TT2*RT and RBC content was found, with a correlation coefficient of −0.834 (95% CI, −0.659 to −0.915) (Fig 3). For fibrin-dominant thrombi, the median TT2*RT value was 104.25 ms (range, 63–230 ms; interquartile range, 61.9 ms), whereas for the RBC thrombi, the median TT2*RT value was 54 ms (range, 20–150 ms; interquartile range, 45.9 ms) (Fig 4).

Fig 3.
  • Download figure
  • Open in new tab
  • Download powerpoint
Fig 3.

Semiquantitative evaluation (10% steps) of the red blood cell content in the thrombi and corresponding values of the mean thrombus-T2* relaxation time in milliseconds.

Fig 4.
  • Download figure
  • Open in new tab
  • Download powerpoint
Fig 4.

Boxplot of the red blood cell–dominant thrombi and of the fibrin-dominant thrombi with corresponding values of the mean thrombus-T2* relaxation time in milliseconds.

As shown in Fig 3, the scatterplot of RBC content against TT2*RT revealed an outlier (90% RBC content, TT2*RT of 150 ms) with a substantial interobserver discordance (reader 1: TT2*RT of 80 ± 25 ms; reader 2: TT2*RT of 153 ± 163.5 ms), representing a 63% variation between observers. Histologic analysis indicated a 90% RBC content with a central area mostly composed of RBCs. However, a large fibrin-rich halo surrounded the thrombus. This unusual “2-layered” thrombus created discordance and misinterpretation due to inconsistently measured areas in either the RBC or fibrin-rich layers (Fig 1C).

Discussion

We found an inversely proportional correlation between the thrombus RBC content measured by histology and the TT2*RT value using MR imaging with in vitro thrombi. This new and short MR imaging sequence requires <3 minutes for acquisition and has excellent intra- and interobserver agreement, providing a reliable quantitative biomarker for dominant thrombus composition detectible in routine clinical practice.

Randomized controlled trials have demonstrated the superiority of bridging therapy over best medical care for patients with confirmed large-vessel occlusion but without providing any information on thrombus composition.14⇓⇓⇓–18 However, studies on human thrombi retrieved from patients with anterior acute ischemic stroke have revealed varying compositions.5,6 Because the 2 major components of thrombi are RBC and fibrin, the fibrin proportion is roughly the inverse of the RBC content5,6,19 (eg, if the RBC content is 20%, the fibrin content will be around 80%, and conversely). When one engages a thrombus with a stent retriever or aspiration catheter, optimal outcomes are likely best achieved when the entire thrombus can be retrieved in 1 pass without losing any fragments. A fibrin-rich thrombus can be difficult to engage and may adhere to the vessel wall; on the other hand, a weakly organized RBC-rich thrombus can be prone to fragmentation.20,21

Thus, MR imaging can offer a quantitative approach to measuring thrombus composition. The SVS has been studied in the literature on ischemic stroke treated by intravenous thrombolysis or endovascular means with end points defined either in terms of recanalization or functional outcome.11,22⇓⇓–25 However, the qualitative evaluation of the SVS (either + or −) limits its ability to assess the complex and variable composition of thrombi. As previously demonstrated, a linear variation of the RBC/fibrin ratio is observed in samples of retrieved thrombi.3,5,6 Furthermore, the diagnostic accuracy of the SVS to predict thrombus composition varies according to the MR imaging machine.8 This variation seems to be a crucial pitfall for any extensive use of the SVS in large multicenter studies. The appearance of the SVS is related to technical parameters such as TE, voxel size, and magnetic field.26 Given these limitations, the SVS should be read in relation to a precise T2* map calculated using several TRs with highly controlled imaging parameters. Indeed, a gradient-echo sequence is commonly used to identify brain hemorrhage, but the parameters of this sequence are not optimized for the detection and characterization of a thrombus. In this study, we acquired 12 different echo sequences, from 3.30 to 40.68 ms, allowing us to precisely measure T2* on tissue with both high and low T2*.

Hence, a quantitative imaging method might be a useful way of analyzing thrombus composition more precisely. A study found that acute intramural hematoma due to cerebral artery dissection could be determined more accurately on T2* quantification mapping.27 One recent study analyzed the performance of T2* mapping (compared with SVS) to detect thrombi.28 The TT2*RT value has also been found to be related to the number of attempts to reach successful recanalization after endovascular treatment, but the correlation between TT2*RT and the histologic composition of the thrombus has never been analyzed.11 In our study, we used distinct thrombus analogs varying in composition, ranging from RBC-dominant to fibrin-dominant.12 This model of thrombus creation holds promise for translational research on thrombus composition and permeability.29 Using in vitro thrombi provides the opportunity to validate the capacity of the sequence to predict the proportion of RBCs. Thus, in vitro thrombi are more relevant than ex vivo thrombi for 2 main reasons: First, our study required thrombi with a composition ranging from extremely RBC-rich to fibrin-only, corresponding to the wide range of thrombi encountered in clinical practice, some of which can be very difficult to retrieve. In particular, fibrin-rich thrombi are difficult to remove with traditional stent-retriever methods; hence, there is a need to predict these types of thrombi. Second, the use of intravenous thrombolysis before thrombus extraction can modify the thrombus characteristics. In particular, thrombi retrieved after substantial chemical and mechanical manipulations are likely to be vastly dissimilar to the original occlusion.

Our study has several limitations. First, the results of TT2*RT might depend on the magnetic field homogeneity and susceptibility differences between the thrombus and the medium surrounding it. To test the influence of these parameters, one would need to repeat the measurements with thrombi positioned in different orientations. This was not done in our study; the thrombi were randomly placed within their vials. As a consequence, during the MR imaging acquisition, the long axis of the thrombi had multiple directions either in the direction of the phases or the frequency, just like the blood vessels in vivo. Moreover, to limit the effect of heterogeneities on images, we performed a 3D shim before each acquisition, allowing a narrow water-frequency peak. This adjustment only takes 30 seconds, is fully compatible with use in routine clinical practice, and allows the robustness and precision of the T2* value to be substantially improved. Then, a critical point is that the 1.5T Siemens unit offers the possibility of shortening or lengthening the interecho intervals. Thus, in the sequence presented here, we concentrated the echoes around 30 ms for optimal accuracy. However, the T2* value is also dependent on magnetic field strength, and the next step is to analyze the inter-MR imaging machine agreement for this sequence. Last, one can argue that susceptibility-weighted imaging sequences could be useful for detecting intracranial thrombi. This is most likely the case because these sequences are more sensitive to the RBC content, but they may not efficiently predict the proportion of RBCs in the thrombus. Furthermore, because of the longer TEs, the susceptibility-weighted imaging requires a longer acquisition time, which can be detrimental in the context of acute ischemic stroke.

Conclusions

An MR imaging quantitative T2* mapping sequence that records the TT2*RT can reliably identify the thrombus RBC content in vitro. TT2*RT values are inversely related to the RBC content of thrombi. This new short MR imaging sequence provides a quantitative biomarker of thrombus composition accessible in clinical routine. Normalization of the MR imaging quantitative T2* mapping sequence between MR imaging vendors should be considered in the future if large multicenter studies aim to include information on thrombus composition before mechanical thrombectomy.

Acknowledgments

We thank Siemens and Neuravi for their nonfunded, scientific support and Nick Barton for language editing.

Footnotes

  • Jean-Michel Serfaty and Claire Toquet contributed equally to this work.

References

  1. 1.↵
    1. Goyal M,
    2. Menon BK,
    3. van Zwam WH, et al
    ; HERMES collaborators. Endovascular thrombectomy after large-vessel ischaemic stroke: a meta-analysis of individual patient data from five randomised trials. Lancet 2016;387:1723–31 doi:10.1016/S0140-6736(16)00163-X pmid:26898852
    CrossRefPubMed
  2. 2.↵
    1. Hashimoto T,
    2. Hayakawa M,
    3. Funatsu N, et al
    . Histopathologic analysis of retrieved thrombi associated with successful reperfusion after acute stroke thrombectomy. Stroke 2016;47:3035–37 doi:10.1161/STROKEAHA.116.015228 pmid:27780903
    Abstract/FREE Full Text
  3. 3.↵
    1. Brinjikji W,
    2. Duffy S,
    3. Burrows A, et al
    . Correlation of imaging and histopathology of thrombi in acute ischemic stroke with etiology and outcome: a systematic review. J Neurointerv Surg 2017;9:529–34 doi:10.1136/neurintsurg-2016-012391 pmid:27166383
    Abstract/FREE Full Text
  4. 4.↵
    1. Rovira A,
    2. Orellana P,
    3. Alvarez-Sabín J, et al
    . Hyperacute ischemic stroke: middle cerebral artery susceptibility sign at echo-planar gradient-echo MR imaging. Radiology 2004;232:466–73 doi:10.1148/radiol.2322030273 pmid:15215546
    CrossRefPubMed
  5. 5.↵
    1. Liebeskind DS,
    2. Sanossian N,
    3. Yong WH, et al
    . CT and MRI early vessel signs reflect clot composition in acute stroke. Stroke 2011; 42:1237–43 doi:10.1161/STROKEAHA.110.605576 pmid:21393591
    Abstract/FREE Full Text
  6. 6.↵
    1. Marder VJ,
    2. Chute DJ,
    3. Starkman S, et al
    . Analysis of thrombi retrieved from cerebral arteries of patients with acute ischemic stroke. Stroke 2006;37:2086–93 doi:10.1161/01.STR.0000230307.03438.94 pmid:16794209
    Abstract/FREE Full Text
  7. 7.↵
    1. Boeckh-Behrens T,
    2. Schubert M,
    3. Förschler A, et al
    . The impact of histological clot composition in embolic stroke. Clin Neuroradiol 2016;26:189–97 doi:10.1007/s00062-014-0347-x pmid:25261075
    CrossRefPubMed
  8. 8.↵
    1. Bourcier R,
    2. Détraz L,
    3. Serfaty JM, et al
    . MRI interscanner agreement of the association between the susceptibility vessel sign and histologic composition of thrombi. J Neuroimaging 2017;27:577–82 doi:10.1111/jon.12464 pmid:28771893
    CrossRefPubMed
  9. 9.↵
    1. Hanneman K,
    2. Nguyen ET,
    3. Thavendiranathan P, et al
    . Quantification of myocardial extracellular volume fraction with cardiac MR imaging in thalassemia major. Radiology 2016;279:720–30 doi:10.1148/radiol.2015150341 pmid:26653680
    CrossRefPubMed
  10. 10.↵
    1. Gandon Y,
    2. Olivié D,
    3. Guyader D, et al
    . Non-invasive assessment of hepatic iron stores by MRI. Lancet 2004;363:357–62 doi:10.1016/S0140-6736(04)15436-6 pmid:15070565
    CrossRefPubMed
  11. 11.↵
    1. Bourcier R,
    2. Brecheteau N,
    3. Costalat V, et al
    . MRI quantitative T2* mapping on thrombus to predict recanalization after endovascular treatment for acute anterior ischemic stroke. J Neuroradiol 2017;44:241–46 doi:10.1016/j.neurad.2017.03.006 pmid:28478114
    CrossRefPubMed
  12. 12.↵
    1. Duffy S,
    2. Farrell M,
    3. McArdle K, et al
    . Novel methodology to replicate clot analogs with diverse composition in acute ischemic stroke. J Neurointerv Surg 2017;9:486–91 doi:10.1136/neurintsurg-2016-012308 pmid:27127231
    Abstract/FREE Full Text
  13. 13.↵
    1. Koo TK,
    2. Li MY
    . A guideline of selecting and reporting intraclass correlation coefficients for reliability research. J Chiropr Med 2016;15:155–63 doi:10.1016/j.jcm.2016.02.012 pmid:27330520
    CrossRefPubMed
  14. 14.↵
    1. Goyal M,
    2. Demchuk AM,
    3. Menon BK, et al
    ; ESCAPE Trial Investigators. Randomized assessment of rapid endovascular treatment of ischemic stroke. N Engl J Med 2015;372:1019–30 doi:10.1056/NEJMoa1414905 pmid:25671798
    CrossRefPubMed
  15. 15.↵
    1. Campbell BC,
    2. Mitchell PJ,
    3. Kleinig TJ, et al
    ; EXTEND-IA Investigators. Endovascular therapy for ischemic stroke with perfusion-imaging selection. N Engl J Med 2015;372:1009–18 doi:10.1056/NEJMoa1414792 pmid:25671797
    CrossRefPubMed
  16. 16.↵
    1. Berkhemer OA,
    2. Fransen PS,
    3. Beumer D, et al
    . A randomized trial of intraarterial treatment for acute ischemic stroke. N Engl J Med 2015;372:11–20 doi:10.1056/NEJMoa1411587 pmid:25517348
    CrossRefPubMed
  17. 17.↵
    1. Jovin TG,
    2. Chamorro A,
    3. Cobo E, et al
    ; REVASCAT Trial Investigators. Thrombectomy within 8 hours after symptom onset in ischemic stroke. N Engl J Med 2015;372:2296–306 doi:10.1056/NEJMoa1503780 pmid:25882510
    CrossRefPubMed
  18. 18.↵
    1. Saver JL,
    2. Goyal M,
    3. Bonafe A, et al
    ; SWIFT PRIME Investigators. Stent-retriever thrombectomy after intravenous t-PA vs. t-PA alone in stroke. N Engl J Med 2015;372:2285–95 doi:10.1056/NEJMoa1415061 pmid:25882376
    CrossRefPubMed
  19. 19.↵
    1. Boeckh-Behrens T,
    2. Kleine JF,
    3. Zimmer C, et al
    . Thrombus histology suggests cardioembolic cause in cryptogenic stroke. Stroke 2016;47:1864–71 doi:10.1161/STROKEAHA.116.013105 pmid:27197854
    Abstract/FREE Full Text
  20. 20.↵
    1. Fennell VS,
    2. Setlur Nagesh SV,
    3. Meess KM, et al
    . What to do about fibrin rich “tough clots”? Comparing the Solitaire stent retriever with a novel geometric clot extractor in an in vitro stroke model. J Neurointerv Surg 2018;10:907–10 doi:10.1136/neurintsurg-2017-013507 pmid:29352061
    Abstract/FREE Full Text
  21. 21.↵
    1. Machi P,
    2. Jourdan F,
    3. Ambard D, et al
    . Experimental evaluation of stent retrievers' mechanical properties and effectiveness. J Neurointerv Surg 2017;9:257–63 doi:10.1136/neurintsurg-2015-012213 pmid:27016318
    Abstract/FREE Full Text
  22. 22.↵
    1. Soize S,
    2. Batista AL,
    3. Rodriguez Regent C, et al
    . Susceptibility vessel sign on T2* magnetic resonance imaging and recanalization results of mechanical thrombectomy with stent retrievers: a multicentre cohort study. Eur J Neurol 2015;22:967–72 doi:10.1111/ene.12693 pmid:25786977
    CrossRefPubMed
  23. 23.↵
    1. Naggara O,
    2. Raymond J,
    3. Domingo Ayllon M, et al
    . T2* “susceptibility vessel sign” demonstrates clot location and length in acute ischemic stroke. PLoS One 2013;8:e76727 doi:10.1371/journal.pone.0076727 pmid:24146915
    CrossRefPubMed
  24. 24.↵
    1. Kimura K,
    2. Sakamoto Y,
    3. Iguchi Y, et al
    . Clinical and MRI scale to predict very poor outcome in tissue plasminogen activator patients. Eur Neurol 2011;65:291–95 doi:10.1159/000327690 pmid:21508643
    CrossRefPubMed
  25. 25.↵
    1. Aoki J,
    2. Kimura K,
    3. Shibazaki K, et al
    . Location of the susceptibility vessel sign on T2*-weighted MRI and early recanalization within 1 hour after tissue plasminogen activator administration. Cerebrovasc Dis Extra 2013;3:111–20 doi:10.1159/000354848 pmid:24163686
    CrossRefPubMed
  26. 26.↵
    1. Hodel J,
    2. Rodallec M,
    3. Gerber S, et al
    . Susceptibility weighted magnetic resonance sequences “SWAN, SWI and VenoBOLD”: technical aspects and clinical applications [in French]. J Neuroradiol 2012;39:71–86 doi:10.1016/j.neurad.2011.11.006 pmid:22342939
    CrossRefPubMed
  27. 27.↵
    1. Kato A,
    2. Shinohara Y,
    3. Yamashita E, et al
    . Usefulness of R2* maps generated by iterative decomposition of water and fat with echo asymmetry and least-squares estimation quantitation sequence for cerebral artery dissection. Neuroradiology 2015;57:909–15 doi:10.1007/s00234-015-1549-x pmid:26070299
    CrossRefPubMed
  28. 28.↵
    1. Shinohara Y,
    2. Kato A,
    3. Yamashita E, et al
    . R2* map by IDEAL IQ for acute cerebral infarction: compared with susceptibility vessel sign on T2*-weighted imaging. Yonago Acta Med 2016;59:204–09 pmid:27708535
    PubMed
  29. 29.↵
    1. Santos EM,
    2. Marquering HA,
    3. den Blanken MD, et al
    ; MR CLEAN Investigators. Thrombus permeability is associated with improved functional outcome and recanalization in patients with ischemic stroke. Stroke 2016;47:732–41 doi:10.1161/STROKEAHA.115.011187 pmid:26846859
    Abstract/FREE Full Text
  • Received August 8, 2018.
  • Accepted after revision October 21, 2018.
  • © 2019 by American Journal of Neuroradiology
View Abstract
PreviousNext
Back to top

In this issue

American Journal of Neuroradiology: 40 (1)
American Journal of Neuroradiology
Vol. 40, Issue 1
1 Jan 2019
  • Table of Contents
  • Index by author
  • Complete Issue (PDF)
Advertisement
Print
Download PDF
Email Article

Thank you for your interest in spreading the word on American Journal of Neuroradiology.

NOTE: We only request your email address so that the person you are recommending the page to knows that you wanted them to see it, and that it is not junk mail. We do not capture any email address.

Enter multiple addresses on separate lines or separate them with commas.
MRI Quantitative T2* Mapping to Predict Dominant Composition of In Vitro Thrombus
(Your Name) has sent you a message from American Journal of Neuroradiology
(Your Name) thought you would like to see the American Journal of Neuroradiology web site.
CAPTCHA
This question is for testing whether or not you are a human visitor and to prevent automated spam submissions.
Cite this article
R. Bourcier, R. Pautre, M. Mirza, C. Castets, J. Darcourt, J. Labreuche, L. Detraz, H. Desal, J.-M. Serfaty, C. Toquet
MRI Quantitative T2* Mapping to Predict Dominant Composition of In Vitro Thrombus
American Journal of Neuroradiology Jan 2019, 40 (1) 59-64; DOI: 10.3174/ajnr.A5938

Citation Manager Formats

  • BibTeX
  • Bookends
  • EasyBib
  • EndNote (tagged)
  • EndNote 8 (xml)
  • Medlars
  • Mendeley
  • Papers
  • RefWorks Tagged
  • Ref Manager
  • RIS
  • Zotero
0 Responses
Respond to this article
Share
Bookmark this article
MRI Quantitative T2* Mapping to Predict Dominant Composition of In Vitro Thrombus
R. Bourcier, R. Pautre, M. Mirza, C. Castets, J. Darcourt, J. Labreuche, L. Detraz, H. Desal, J.-M. Serfaty, C. Toquet
American Journal of Neuroradiology Jan 2019, 40 (1) 59-64; DOI: 10.3174/ajnr.A5938
del.icio.us logo Twitter logo Facebook logo Mendeley logo
  • Tweet Widget
  • Facebook Like
  • Google Plus One
Purchase

Jump to section

  • Article
    • Abstract
    • ABBREVIATIONS:
    • Materials and Methods
    • Results
    • Discussion
    • Conclusions
    • Acknowledgments
    • Footnotes
    • References
  • Figures & Data
  • Info & Metrics
  • Responses
  • References
  • PDF

Related Articles

  • No related articles found.
  • PubMed
  • Google Scholar

Cited By...

  • Impedance-based sensors discriminate among different types of blood thrombi with very high specificity and sensitivity
  • Impedance-based sensors discriminate among different types of blood thrombi with very high specificity and sensitivity
  • Quantitative estimation of thrombus-erythrocytes using MRI. A phantom study with clot analogs and analysis by statistic regression models
  • Crossref (16)
  • Google Scholar

This article has been cited by the following articles in journals that are participating in Crossref Cited-by Linking.

  • Imaging Clot Characteristics in Stroke and its Possible Implication on Treatment
    Ana Siri Luthman, Laurie Bouchez, Daniele Botta, Maria Isabel Vargas, Paolo Machi, Karl-Olof Lövblad
    Clinical Neuroradiology 2020 30 1
  • Thrombus Histology as It Relates to Mechanical Thrombectomy: A Meta-Analysis and Systematic Review
    Ankur Bhambri, Arjun Rohit Adapa, Yang Liu, Tobias Boeckh-Behrens, Václav Procházka, Francisco Hernández-Fernández, Rosa Angélica Barbella-Aponte, Tetsuya Hashimoto, Luis E Savastano, Joseph J Gemmete, Neeraj Chaudhary, Albert J Shih, Aditya S Pandey
    Neurosurgery 2021 89 6
  • A review on the association of thrombus composition with mechanical and radiological imaging characteristics in acute ischemic stroke
    Rachel Cahalane, Nikki Boodt, Ali Cagdas Akyildiz, Jo-anne Giezen, Manouk Mondeel, Aad van der Lugt, Henk Marquering, Frank Gijsen
    Journal of Biomechanics 2021 129
  • Biomechanics and hemodynamics of stent-retrievers
    Anna Luisa Kühn, Zeynep Vardar, Afif Kraitem, Robert M King, Vania Anagnostakou, Ajit S Puri, Matthew J Gounis
    Journal of Cerebral Blood Flow & Metabolism 2020 40 12
  • Clot Analog Attenuation in Non-contrast CT Predicts Histology: an Experimental Study Using Machine Learning
    Aglae Velasco Gonzalez, Boris Buerke, Dennis Görlich, Manfred Fobker, Thilo Rusche, Cristina Sauerland, Norbert Meier, Astrid Jeibmann, Ray McCarthy, Harald Kugel, Peter Sporns, Andreas Faldum, Werner Paulus, Walter Heindel
    Translational Stroke Research 2020 11 5
  • Quantitative estimation of thrombus-erythrocytes using MRI. A phantom study with clot analogs and analysis by statistic regression models
    Kevin Janot, Tiago Ribeiro Oliveira, Gaelle Fromont-Hankard, Mariam Annan, Isabelle Filipiak, Laurent Barantin, Roseline Guibon, Sharon Duffy, Michael Gilvarry, Jean-Philippe Cottier, Ana Paula Narata
    Journal of NeuroInterventional Surgery 2020 12 2
  • Texture parameters of R2* maps are correlated with iron concentration and red blood cells count in clot analogs: A 7-T micro-MRI study
    Martin Bretzner, Renaud Lopes, Ray McCarthy, Delphine Corseaux, Florent Auger, Gillian Gunning, Nicolas Beauval, Antonino Bongiovanni, Meryem Tardivel, Charlotte Cordonnier, Jean-Pierre Pruvo, Sophie Susen, Xavier Leclerc, Grégory Kuchcinski
    Journal of Neuroradiology 2020 47 4
  • Impact of Clot Shape on Successful M1 Endovascular Reperfusion
    Adrien Guenego, Robert Fahed, Eric S. Sussman, Matthew Leipzig, Gregory W. Albers, Blake W. Martin, David G. Marcellus, Gabriella Kuraitis, Michael P. Marks, Maarten G. Lansberg, Max Wintermark, Jeremy J. Heit
    Frontiers in Neurology 2021 12
  • Impedance-based sensors discriminate among different types of blood thrombi with very high specificity and sensitivity
    Pierluca Messina, Cédric Garcia, Joachim Rambeau, Jean Darcourt, Ronan Balland, Bruno Carreel, Myline Cottance, Elena Gusarova, Julie Lafaurie-Janvore, Gor Lebedev, Franz Bozsak, Abdul I Barakat, Bernard Payrastre, Christophe Cognard
    Journal of NeuroInterventional Surgery 2023 15 6
  • Activated Platelet-Homing Nanoplatform for Targeting Magnetic Resonance Imaging of Aneurysm-Related Thrombus in Rabbits
    Yang Zhang, Sijie Cheng, Yu He, Chaojie Tang, Feng Liu, Yun Sun, Shuo Zhao, Greta S. P. Mok, Hong Yang, Zhiguo Zhou, Wu Wang
    ACS Applied Materials & Interfaces 2021 13 43

More in this TOC Section

  • Diagnostic Neuroradiology of Monoclonal Antibodies
  • Cerebral ADC Changes in Fabry Disease
  • ML for Glioma Molecular Subtype Prediction
Show more Adult Brain

Similar Articles

Advertisement

Indexed Content

  • Current Issue
  • Accepted Manuscripts
  • Article Preview
  • Past Issues
  • Editorials
  • Editors Choice
  • Fellow Journal Club
  • Letters to the Editor

Cases

  • Case Collection
  • Archive - Case of the Week
  • Archive - Case of the Month
  • Archive - Classic Case

Special Collections

  • Special Collections

Resources

  • News and Updates
  • Turn around Times
  • Submit a Manuscript
  • Author Policies
  • Manuscript Submission Guidelines
  • Evidence-Based Medicine Level Guide
  • Publishing Checklists
  • Graphical Abstract Preparation
  • Imaging Protocol Submission
  • Submit a Case
  • Become a Reviewer/Academy of Reviewers
  • Get Peer Review Credit from Publons

Multimedia

  • AJNR Podcast
  • AJNR SCANtastic
  • Video Articles

About Us

  • About AJNR
  • Editorial Board
  • Not an AJNR Subscriber? Join Now
  • Alerts
  • Feedback
  • Advertise with us
  • Librarian Resources
  • Permissions
  • Terms and Conditions

American Society of Neuroradiology

  • Not an ASNR Member? Join Now

© 2025 by the American Society of Neuroradiology All rights, including for text and data mining, AI training, and similar technologies, are reserved.
Print ISSN: 0195-6108 Online ISSN: 1936-959X

Powered by HighWire