
Abstract
BACKGROUND AND PURPOSE: Attempts have been made to quantify the microvascular leakiness of glioblastomas and use it as an imaging biomarker to predict the prognosis of the tumor. The purpose of our study was to evaluate whether the extraction fraction value from DSC-MR imaging within nonenhancing FLAIR hyperintense lesions was a better prognostic imaging biomarker than dynamic contrast-enhanced MR imaging parameters for patients with glioblastoma.
MATERIALS AND METHODS: A total of 102 patients with glioblastoma who received a preoperative dynamic contrast-enhanced MR imaging and DSC-MR imaging were included in this retrospective study. Patients were classified into the progression (n = 87) or nonprogression (n = 15) groups at 24 months after surgery. We extracted the means and 95th percentile values for the contrast leakage information parameters from both modalities within the nonenhancing FLAIR high-signal-intensity lesions.
RESULTS: The extraction fraction 95th percentile value was higher in the progression-free survival group of >24 months than at ≤24 months. The median progression-free survival of the group with an extraction fraction 95th percentile value of >13.32 was 17 months, whereas that of the group of ≤13.32 was 12 months. In addition, it was an independent predictor variable for progression-free survival in the patients regardless of their ages and genetic information.
CONCLUSIONS: The extraction fraction 95th percentile value was the only independent parameter for prognostic prediction in patients with glioblastoma among the contrast leakage information, which has no statistically significant correlations with the DCE-MR imaging parameters.
ABBREVIATIONS:
- DCE
- dynamic contrast-enhanced
- EF
- extraction fraction
- Ktrans
- volume transfer constant
- MGMT
- O6-methylguanine methyltransferase
- PFS
- progression-free survival
- Ve
- volume of extravascular extracellular space
- Vp
- volume of vascular plasma space
- IDH
- isocitrate dehydrogenase
Glioblastoma multiforme is a hypervascular tumor, and its aggressive portion is known to disrupt the BBB, resulting in enhancement on contrast-enhanced MR imaging. In addition, glioblastoma tumor cells have an infiltrative nature that shows only high signal intensity on FLAIR images without definite enhancement. This characteristic of the tumor is highly related to microvasculature disruption, which may be demonstrated as BBB leakiness.1⇓–3 The standard treatment for glioblastoma is surgical resection, followed by concomitant chemoradiotherapy with adjuvant temozolomide.4,5 The surgical resection is performed mainly at the contrast-enhancing portion of the tumor based on imaging guidance. Nonenhancing infiltrative tumor cells remain after the operation, which explains most of the local recurrences at the resection margin.6 Those infiltrative tumor cells intermingle with reactive edema on T2WI or T2 FLAIR images, thereby increasing the difficulty of their identification. Therefore, nonenhancing FLAIR high-signal-intensity lesions have clinical significance.7
Attempts have been made to quantify the microvascular leakiness of a tumor and use it as a biomarker to predict the level of aggressiveness and the prognosis of a tumor. One approach is the use of dynamic contrast-enhanced (DCE) MR imaging, which is an imaging technology that provides BBB permeability information, to analyze nonenhancing FLAIR high-signal-intensity lesions of glioblastoma.8 Gliomas with high-permeability parameters from DCE-MR imaging have been reported to show a poor prognosis due to a large proportion of leaky vasculature.9⇓–11 To date, many studies have revealed the utility of DCE-MR imaging for predicting the tumor grade and/or tumor progression in patients with glioblastoma.12
Recently, a new method that can reveal contrast leakage information (ie, the extraction fraction [EF]) using DSC-MR imaging has been reported; this method has well-known advantages over DCE-MR imaging, such as providing perfusion information, a shorter scan time, and higher contrast.13 However, no studies have investigated the application of EF for prognostication in patients with glioblastoma receiving standard treatment. Thus, the aim of our study was to evaluate whether the EF parameter from DSC-MR imaging has correlation with contrast leakage information from DCE-MR imaging and whether the EF value from nonenhancing FLAIR high-signal-intensity lesions was a better prognostic imaging biomarker than DCE-MR imaging parameters in patients with glioblastoma receiving standard treatment.
MATERIALS AND METHODS
Patients
This retrospective study was approved by the Institutional Review Board of Seoul National University Hospital. The requirement for informed consent was waived. A total of 134 patients diagnosed with glioblastoma from April 2010 to September 2018 at Seoul National University Hospital were enrolled in this study. The following were the inclusion criteria: adult patients (older than 18 years of age) who were initially diagnosed with glioblastoma based on the 2016 World Health Organization classification of central nervous system tumors, underwent both preoperative DCE- and DSC-MR imaging, and received the standard treatment, including surgical resection of the contrast-enhancing lesion, followed by concomitant chemoradiotherapy with temozolomide and adjuvant temozolomide. Patients with lost raw data (n = 14) or inadequate image quality for analysis (n = 17) or who were lost to follow-up (n = 1) were excluded from the study. Under these inclusion and exclusion criteria, 102 patients were enrolled in our study.
All patients underwent a follow-up MR imaging while visiting the outpatient clinic. On the basis of the clinical features and radiologic results, we categorized our study population into disease progression and nonprogression groups according to the Response Assessment in Neuro-Oncology criteria at 24 months after the operation. Patients satisfying any of the following Response Assessment in Neuro-Oncology criteria were considered to have disease progression14: 1) a >25% increase in the sum of the products of the perpendicular diameters of the enhancing lesions with the smallest tumor measurement, 2) any new lesion, 3) clear clinical deterioration not attributable to causes other than the tumor, and 4) clear progression of nonmeasurable disease. Accordingly, 15 patients (14.7%) were grouped into the nonprogression group, and 87 patients (85.3%) were classified into the disease-progression group.
The flow diagram in On-line Fig 1 shows the inclusion and exclusion of patients in this study. Image acquisition is summarized in the On-line Appendix.
Image Processing and Analysis
MR images were acquired from the PACS workstation and transferred to a personal computer using a software package (NordicICE, Version 4.1.2; NordicNeuroLab, Bergen, Norway) for analysis. On-line Figure 2 shows the schematic diagram of the imaging analysis.
The DCE and DSC perfusion MR imaging analysis methods based on the 2-compartment pharmacokinetic model were performed with the DCE- and DSC-MR imaging data to calculate contrast leakage information parameters, which were presented as parametric maps. The parameters of interest were volume transfer constant (Ktrans), volume of extravascular extracellular space (Ve), volume of vascular plasma space (Vp), and EF.15 For preprocessing, the noise threshold and noise level were set to dispose of noise during parameter extraction from the MR imaging. In addition, a motion-correction function was used for spatial and temporal smoothing of the MR imaging. After preprocessing, vascular deconvolution with the arterial input function was executed by determining it in the intracranial tumor-supplying arteries near the tumor for DCE-MR imaging. This step was assisted by the software’s automatic detection function for arterial input function, which still required manual setting of the arterial input function search region within the tumor. Subsequently, the arterial input function curves and concentration-time curve were generated, which indicated the tumor-supplying artery within the ROI. To find the ideal relationship between the arterial input function curve and the concentration-time curve, we manually defined the ROI, and an appropriate arterial input function curve was selected by 2 well-trained medical students (S.H.K. and K.H.C.) supervised by 1 neuroradiologist (S.H.C., with 16 years of experience in brain MR imaging). The baseline T1 was fixed at 1000 ms in this study.16
A recently introduced contrast leakage information parameter (EF) from DSC-MR imaging is defined as the ratio of permeability (Ktrans) to perfusion (fractional tissue perfusion). EF describes the fraction of contrast agent that is extracted during the first passage through tissue following an instantaneous tracer bolus. Assisted by automated arterial input function detection, EF is obtained by a novel contrast agent extravasation-correction method that is based on fitting the tissue residue function, including both apparent tissue extravasation and a perfusion component, to the 2-compartment uptake kinetic model.17⇓⇓–20 Both the arterial input function and the tissue residue function were estimated from the T1- and T2*-dominant leakage effect. Then, the value of F derived from the tissue residue function was applied to the equation to calculate the EF.17,21
A multiplanar reconstruction tool was used to convert contrast-enhanced, T1-weighted, multiplanar images into axial images. These axial contrast-enhanced T1WI and FLAIR images were deployed for structural imaging. The coregistration algorithm of the software allows users to resample the number of target image sets to that of a reference image set based on the geometric information stored in each dataset. In our case, the target image set was structural images, whereas the reference image set was parametric maps from the DCE- and DSC-MR imaging.22,23
Afterwards, the parametric maps were coregistered with the structural images from the FLAIR and contrast-enhanced T1WI. Then, the ROIs of the nonenhancing FLAIR high-signal-intensity lesion on each axial image were determined manually by reviewers blinded to any information regarding the patient’s prognosis. Additionally, the necrotic and cystic regions as well as large vessels were excluded from the ROI. All manual tasks were performed by consensus to minimize reviewer bias.
We used the ROI analysis function provided by the software to calculate the contrast leakage information, including the Ktrans, Vp, Ve, and EF, from every pixel within the range of the ROI on every axial image and thereby acquired the sum of values from all pixels in the ROI. The total parametric values from the entire nonenhancing FLAIR high-signal-intensity lesion were obtained for each tumor. Finally, the mean values and 95th percentile values for Ktrans, Vp, Ve, and EF were derived from the cumulative histograms (the xth percentile point is the point at which x% of the pixel values that form the histogram are found to the left of the histogram).
Statistical Analysis
All statistical analyses were performed by using MedCalc for Windows, Version 18.11 (MedCalc Software, Mariakerke, Belgium). For all analyses, only P < .05 was considered statistically significant. Clinical characteristics, including age, sex, date of the operation, radiation dose, date of progression, and genetic information, were recorded for each patient. The Fisher exact test was performed for categoric data. The data for each parameter were assessed for normality with the Kolmogorov-Smirnov test. An unpaired Student t test was performed to compare data between the disease progression and nonprogression groups, in which patients with a follow-up period of >24 months or progression-free survival (PFS) of ≤24 months were enrolled.
The Pearson correlation analysis for parametric data was performed to assess the correlations between the EF from DSC-MR imaging and contrast leakage information (eg, Ktrans, Ve, and Vp) from DCE-MR imaging, which were obtained from contrast-enhancing areas as well as nonenhancing FLAIR high-signal-intensity lesions. To further assess the correlation analysis, we calculated intraclass correlation coefficients. Intraclass correlation coefficient values of <0, 0–0.2.0, 0.21–0.40, 0.41–0.60, 0.61–0.80, or >0.81 were interpreted as negative, positive but poor, fair, moderate, good, or excellent agreement, respectively.
Receiver operating characteristic curve analysis was performed to set the optimum cutoff value for each contrast leakage parameter with an aim of distinguishing between the disease progression and nonprogression groups and to calculate the diagnostic performances of the contrast leakage information.
PFS was assessed using the Kaplan-Meier method according to the contrast leakage information and was compared using the log-rank test. We only recorded the first progression. PFS was calculated from the date of the operation to that of glioblastoma progression, the patient’s death, the last confirmation of no evidence of disease, or the most recent follow-up examination. Patients without an event were censored at the date of the most recent follow-up regardless of whether they were scheduled for future follow-ups or had been lost to follow-up. Receiver operating characteristic curve analysis was performed to determine the thresholds for each contrast leakage information parameter for PFS. Multivariate analysis was performed using the Cox proportional hazards model adjusted for prognostic factors, including age, the isocitrate dehydrogenase (IDH) 1/2 mutation, and the O6-methylguanine methyltransferase (MGMT) promoter methylation status.
Finally, the prediction performance of the 95th percentile EF was evaluated via the leave-one-out method. This method was performed by selecting 1 patient as a testing sample, with the remaining patients used as the training samples. The cutoff values determined by receiver operating characteristic curve analysis on the training samples were used to distinguish whether the testing sample belonged to the early disease progression or the nonprogression group. As a result of these validation rounds, we acquired the sensitivity, specificity, and accuracy of the total study population’s 95th percentile EF as the cutoff value.
RESULTS
Patient Clinical Characteristics
The mean age of the patients with glioblastoma in the disease progression group (n = 87) was slightly higher than that of the patients in the nonprogression group (n = 15) (59.24 ± 13.50 versus 51.33 ± 13.96 years, respectively, P = .04). The other clinical characteristics, including the radiation dose, sex, MGMT promotor methylation status and IDH 1/2 mutation status, were not statistically significantly different between the 2 groups (all, P > .05; Table 1).
Clinical characteristics of the study populationa
Correlation analyses between EF from DSC-MR imaging and contrast leakage information from DCE-MR imaging are given in the On-line Appendix and On-line Fig 3.
Comparison of Contrast Leakage Information and Imaging Findings between the Early Disease Progression and Nonprogression Groups
These analyses enrolled patients with a follow-up period of >24 months without progression (n = 15) or PFS of ≤24 months (n = 71), as mentioned above. On the basis of the unpaired Student t test, the EF 95th percentile value was higher for the patients in the nonprogression group than for those in the disease-progression group (15.7895% ± 8.6931% versus 11.0527% ± 7.6511%, respectively, P = .0363). However, no statistically significant differences in the other parameters were found between the 2 groups (all, P > .05; Table 2).
Comparison of the parametric values of the progression and nonprogression groupsa
Here, sensitivity and specificity are defined for identification of early disease progression and nonprogression, respectively, using receiver operating characteristic curve analysis. The EF 95th percentile value also showed statistical significance in receiver operating characteristic curve analysis, with an area under curve of 0.71 (95% CI, 0.599–0.800, and P = .008). The best cutoff criterion for the EF 95th percentile value was 13.32, with a sensitivity of 60.0% and a specificity of 78.9%. Two representative cases with disease progression and nonprogression with parametric maps of EF, Ktrans, Ve, and Vp are shown in Figs 1 and 2, respectively.

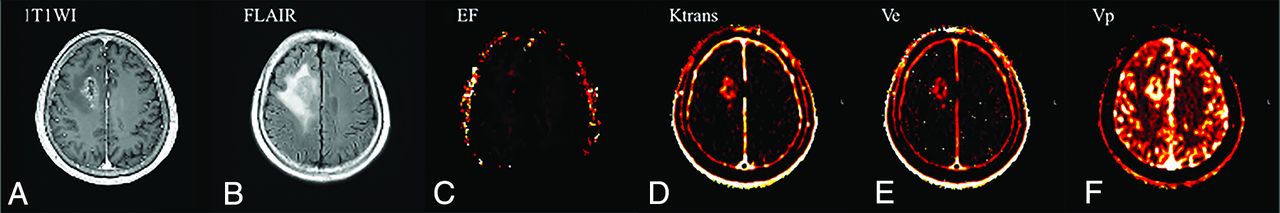
A 64-year-old patient with glioblastoma who had early disease progression (PFS = 14 months) after standard treatment. The preoperative axial contrast-enhanced T1WI (A) and FLAIR (B) images represent an enhancing area and nonenhancing FLAIR high-signal-intensity lesions, respectively. The preoperative parametric maps of contrast leakage information (EF, Ktrans, Ve, and Vp) are shown (C, D, E, and F, respectively). A low EF value on the nonenhancing FLAIR high-signal-intensity lesion was observed, with an EF 95th percentile value of 5.67.

A 60-year-old patient with glioblastoma who had nonprogression (PFS = 31 months) after standard treatment. The preoperative axial contrast-enhanced T1WI (A) and FLAIR (B) images represent an enhancing area and a nonenhancing FLAIR high-signal-intensity lesion, respectively. The preoperative parametric maps of contrast leakage information (EF, Ktrans, Ve, and Vp) are shown (C, D, E, and F, respectively). A high EF value on a nonenhancing FLAIR high-signal-intensity lesion was noted, with an EF 95th percentile value of 16.69.
Correlation analysis between the EF from DSC-MR imaging and contrast leakage information from DCE-MR imaging is given in the On-line Appendix and On-line Table 1.
Leave-One-Out Cross-Validation
In the leave-one-out cross-validation of the EF 95th percentile value, the cross-validated values for the prediction of glioblastoma disease progression were found, with corresponding sensitivity (46.67%), specificity (77.46%), and accuracy (72.09%).
Contrast Leakage Information Correlated with PFS.
In all patients, PFS was correlated with the EF 95th percentile value with an optimum cutoff value of 13.32% obtained from receiver operating characteristic curve analysis, which showed statistical significance (P = 0.02) (On-line Fig 4). Then, we performed Cox proportional hazards model analysis, including the EF 95th percentile value, which was significantly associated with PFS, and previously reported prognostic genetic factors, including the IDH1/2 mutation and MGMT promotor methylation status. The analysis revealed that only the EF 95th percentile value was significant among these factors (P = .01, On-line Table 2). In all patients, a significant difference in PFS was found between patients with high and low EF 95th percentile values (median, 17.0 months [95% CI, 12.0–36.0 months] versus 12.0 months [95% CI, 9.0–15.0 months]; P = .02, log-rank test), which was independent of age, the IDH1/2 mutation, and the MGMT promotor methylation status.
DISCUSSION
In our study, contrast leakage information from both DCE- and DSC-MR imaging, including the EF, Ktrans, Ve, and Vp, was analyzed for prognostication in patients with glioblastoma treated with standard methods. Most interesting, the EF value from DSC-MR imaging had no significant correlation with any DCE-MR imaging parameters. We found that the EF 95th percentile value was higher in patients with nonprogression than in patients with disease progression within 2 years. We also found that patients with a higher EF 95th percentile value had longer PFS than those with a lower value. PFS also had a significant correlation with the EF 95th percentile value, which was the most important prognostic marker, regardless of age, IDH1/2 mutation, and the MGMT promoter methylation status.
Microscopic infiltrative glioblastoma cells commonly are unenhanced on contrast-enhanced T1WI and are indistinguishable from peritumoral edema components, features increasing the difficulty of response prediction for patients with glioblastoma. DCE- and DSC-MR imaging have been used to evaluate microscopic infiltrative glioblastoma cells in nonenhancing FLAIR high-signal-intensity lesions.8,24 DCE-MR imaging parameters, including the Ktrans, Ve, and Vp, can reflect vascular permeability, which usually is increased in the glioblastoma vasculature.10⇓–12,25 Extensive studies have been performed to determine the survival-associated parameters of DCE-MR imaging in patients with glioblastoma. Despite some controversies, patients with glioblastoma with high contrast leakage information parameters on DCE-MR imaging are known to have a poor prognosis.26⇓⇓⇓–30 However, no controlled studies have been established to evaluate the EF on the basis of DSC-MR imaging as a survival-associated parameter.
In our study, although a weak correlation was found between the mean EF and Vp values in the Pearson correlation analysis, no statistical correlation was found with the other parameters, and the intraclass correlation coefficients did not show any significant correlations between the EF and the DCE-MR imaging parameters. These results are supported by previous studies in patients with glioblastoma that indicated a nonlinear relationship between the Ktrans obtained from DCE-MR imaging and that obtained by DSC-MR imaging, probably due to the mixed contributions from the T1- and T2*-dominant leakage effects in DSC-MR imaging.13,21 Even for the EF, because the estimation of perfusion theoretically is independent of leakage, varying contributions of the 2 relaxation effects by postextravasation would directly influence the magnitude of the resulting EF value. Therefore, even though both DCE- and DSC-MR imaging use a contrast agent extravasation-correction method, the EF parameter from DSC-MR imaging cannot replace the parameters from DCE-MR imaging; however, the EF may be a noteworthy parameter that is affected by the T2* effect from contrast agents and may be more sensitive to contrast leakage than the parameters that are mainly determined by the T1 effect from DCE-MR imaging.
We believe that the EF value needs clinical validation before use as a potential imaging biomarker for prognostication in patients with glioblastoma treated with a standard method. Contrast leakage information can be translated into drug-delivery predictions, especially within nonenhancing FLAIR high-signal-intensity lesions after near-complete resection of the enhancing portions. In nonenhancing FLAIR high-signal-intensity lesions in patients with glioblastoma after the operation, the BBB is still an effective barrier that prevents entry of the drug into the brain tissue; hence, BBB disruption accounts for a better prognosis of patients with glioblastoma due to more efficient drug delivery.31⇓⇓–34 The improved tumor response to chemotherapy after radiation-induced vascular damage also supports the association between permeability and drug delivery.35 We found that a high EF within nonenhancing FLAIR high-signal-intensity lesions was an independent prognostic biomarker for longer PFS in patients with glioblastoma in our study, which suggested that the EF value could effectively reflect BBB disruption related to the chemotherapy response.
The MGMT gene encodes the MGMT protein, which has DNA repair activity.36,37 Some studies have shown a significant correlation between the MGMT promotor methylation status and the outcome of alkylating chemotherapeutic substances, such as temozolomide.38 Additionally, mutations of the IDH1/2 gene encoding the cytosolic nicotinamide adenine dinucleotide phosphate+–dependent isocitrate dehydrogenase have been shown to be correlated with the outcome in patients with malignant gliomas.39,40 To examine whether these genetic statuses influence PFS as confounding factors of the EF 95th percentile value, we performed Cox proportional hazards regression analysis in our study. The analysis revealed that the EF 95th percentile value was a predictive parameter of PFS independent of MGMT promoter methylation and the IDH1/2 mutation status in patients with glioblastoma. Some studies have shown that decreased vascular permeability can cause treatment resistance in patients with gliomas.41 Similarly, in our study, improved drug delivery by increased vascular permeability in patients with glioblastoma could have resulted in a better prognosis regardless of genetic variances.
Our study has some limitations, including the nature of its retrospective design. First, the patients with glioblastoma in our study were not perfectly balanced because the mean age of the disease-progression group was slightly older than that of the nonprogression group, whereas no significant differences were found in any of the other clinical characteristics. However, according to Cox proportional hazards regression, the age of the patients with glioblastoma did not affect the significance of the EF 95th percentile value. Second, we manually marked the nonenhancing FLAIR high-signal-intensity lesions as ROIs using image-analysis software, which might have resulted in observer bias. However, we carefully drew the ROIs under supervision of an expert neuroradiologist. Third, our study enrolled patients who received a double dose of contrast medium for both DSC- and DCE-MR imaging. This could increase the risk of nephrogenic systemic fibrosis and gadolinium organ tissue deposition.42,43 Although a macrocyclic gadolinium-based contrast agent was used in our study, the risk of tissue deposition could be increased in patients given a double dose of contrast material. In a previous study, 1 dose of contrast medium was suggested for the acquisition of both DSC- and DCE-MR imaging by splitting the dose, which was not considered in our MR imaging protocol.44 However, our study showed the feasibility of the contrast leakage information from DSC-MR imaging, which is usually calculated from DCE-MR imaging; thus, our results can give evidence to reduce unnecessary additional contrast media injections in the future. Finally, we did not analyze the tumor tissues to find pathophysiologic evidence for why the EF parameter was associated with the prognosis in patients with glioblastoma. Thus, we believe that future studies are warranted.
CONCLUSIONS
The EF 95th percentile value within the nonenhancing FLAIR high-signal-intensity lesions from DSC-MR imaging was the only independent parameter for prognostication in patients with glioblastoma among the contrast leakage information, which has no significant correlations with the DCE-MR imaging parameters. Application of the EF 95th percentile value can be helpful for treatment stratification in patients with glioblastoma.
Footnotes
S.H. Kim and K.H. Cho contributed equally to this work.
This study was supported by a grant from the Korea Healthcare Technology R&D Projects, Ministry for Health, Welfare & Family Affairs (HI16C1111), by the Bio & Medical Technology Development Program of the National Research Foundation of Korea funded by the Korean government, Ministry of Science, Information & Community Technology and Future Planning (NRF-2015M3A9A7029740), by the Brain Research Program through the National Research Foundation of Korea funded by the Ministry of Science, Information & Community Technology and Future Planning (2016M3C7A1914002), by the Creative-Pioneering Researchers Program through Seoul National University, and by Project Code (IBS-R006-D1).
Disclosures: Seung Hong Choi—RELATED: Grant: governmental grant, Comments: grants from the Korean government.* Tae Min Kim—UNRELATED: Grants/Grants Pending: AZ-KHIDI research fund.* Chul-Kee Park—UNRELATED: Employment: Seoul National University Hospital. *Money paid to the institution.
Indicates open access to non-subscribers at www.ajnr.org
References
- Received June 18, 2019.
- Accepted after revision September 16, 2019.
- © 2019 by American Journal of Neuroradiology


Jump to section
Related Articles
Cited By...
- No citing articles found.