
Abstract
BACKGROUND AND PURPOSE: Infratentorial and spinal cord lesions are important for diagnosing and monitoring multiple sclerosis, but they are difficult to detect on conventional MR imaging. We sought to improve the detection of infratentorial and upper cervical cord lesions using composite FLAIR3 images.
MATERIALS AND METHODS: 3D T2-weighted FLAIR and 3D T2-weighted images were acquired in 30 patients with MS and combined using the FLAIR3 formula. FLAIR3 was assessed against 3D T2-FLAIR by comparing the number of infratentorial and upper cervical cord lesions per subject using the Wilcoxon signed rank test. Intrarater and interrater reliability was evaluated using the intraclass correlation coefficient. The number of patients with and without ≥1 visible infratentorial/spinal cord lesion on 3D T2-FLAIR versus FLAIR3 was calculated to assess the potential impact on the revised MS diagnostic criteria.
RESULTS: Compared with 3D T2-FLAIR, FLAIR3 detected significantly more infratentorial (mean, 4.6 ± 3.6 versus 2.0 ± 1.8, P < .001) and cervical cord (mean, 1.58 ± 0.94 versus 0.46 ± 0.45, P < .001) lesions per subject. FLAIR3 demonstrated significantly improved interrater reliability (intraclass correlation coefficient = 0.77 [95% CI, 0.63–0.87] versus 0.60 [95% CI, 0.40–0.76] with 3D T2-FLAIR, P = .019) and a tendency toward a higher intrarater reliability (0.86 [95% CI, 0.73–0.93] versus 0.79 [95% CI, 0.61–0.89], P = .23). In our cohort, 20%–30% (47%–67%) of the subjects with MS had ≥ 1 infratentorial (cervical cord) lesion visible only on FLAIR3.
CONCLUSIONS: FLAIR3 provides higher sensitivity than T2-FLAIR for the detection of MS lesions in infratentorial brain parenchyma and the upper cervical cord.
ABBREVIATION:
- CNR
- contrast-to-noise ratio
Infratentorial brain lesions are commonly present in MS, an inflammatory and demyelinating disease of the CNS that affects 2.5 million individuals worldwide.1 The current McDonald criteria for diagnosing MS require demonstration of the dissemination of CNS lesions in time and space.2 Dissemination in space is established through detection of ≥1 T2-hyperintense lesion characteristic of MS in ≥2 areas in the CNS: infratentorial (including the brain stem and cerebellum), periventricular, and juxtacortical brain regions and the spinal cord.2
MR imaging is the primary technique in MS, used for diagnosis, detecting pathology, monitoring the disease course, and patient management. T2-FLAIR MR imaging is currently the most commonly used imaging sequence for identifying brain T2-hyperintense lesions. However, the contrast of infratentorial lesions on T2-FLAIR is suboptimal due to partial T1-weighting and different tissue relaxation properties between supratentorial and infratentorial regions.3-5
3D T2-FLAIR imaging has shown promise in improving the detection of infratentorial lesions,6,7 especially with optimized scan parameters.8 Combining T2-weighted and proton density–weighted images has also shown improved contrast.9 A previous study has shown that an algebraic combination of T2-FLAIR and T2-weighted images,10 referred to as FLAIR3, can yield substantial improvement in lesion contrast, but the performance for infratentorial lesion detection was not specifically addressed in that publication.
The primary aim of this prospective study was to test whether the lesion contrast and detectability of MS infratentorial lesions are improved with FLAIR3 imaging compared with 3D T2-FLAIR alone. With the extended FOV offered by 3D acquisitions, we also assessed the performance of these two methods for detecting upper cervical cord lesions.
MATERIALS AND METHODS
Study Subjects
This was a single-center, prospective study that included 30 patients with definite MS. The demographics and clinical characteristics of the study participants are listed in Table 1. The study was approved by our institutional review board, and all volunteers gave written informed consent.
Characteristics of the study participants
MR Imaging Experiments
All brain MR imaging scans were performed on a 3T Ingenia MR imaging scanner (Philips Healthcare; software version R5.1.7) using a 15-channel head coil. 3D T2-FLAIR and 3D T2-weighted images were acquired in the sagittal plane (frequency-encoding in the foot-head direction with oversampling to reduce aliasing; phase-encoding along the left-right and anterior-posterior directions) with a TSE sequence with refocusing control (volume isotropic turbo spin-echo acquisition). The scan parameters were the following: 3D T2-FLAIR (TR/TI/TE = 4800/1650/300 ms; T2-preparation time = 125 ms; echo-train length = 167; scan time = 5:31 minutes) and 3D T2-weighted (TR/TE = 2500/252 ms; echo-train length = 133; scan time = 4:33 minutes). Both images were acquired with matching spatial coverage and resolution (FOV = 256 × 256 × 180 mm3; voxel size =1 × 1 × 1 mm3).
FLAIR3 Reconstruction
After acquisition, the 3D T2-FLAIR and 3D T2-weighted images were coregistered with a rigid-body transformation using the Advanced Normalization Tools (ANTS) software11 (http://stnava.github.io/ANTs/) and algebraically combined to produce the FLAIR3 image using the following formula: FLAIR3 = FLAIR1.55 × T2-weighted1.45. This formula was proposed as a balance between lesion contrast and CSF suppression.10 To improve the dynamic range of the reconstructed FLAIR3 image, we performed intensity nonuniformity correction using multiplicative intrinsic component optimization, an energy-minimization method for joint bias field estimation and segmentation.12
Image Analysis
A board-certified neuroradiologist with 6 years of experience (A.K., rater 1) and an MS neurologist with 15 years of experience in neuroimaging of MS (J.A.L., rater 2) identified all infratentorial and upper cervical lesions seen on 3D T2-FLAIR and FLAIR3 images. Due to the large difference in image contrast between T2-FLAIR and FLAIR3, blind evaluation was not feasible. The 3D T2-FLAIR and FLAIR3 images were reviewed in several sessions during 7 weeks (rater 1) and 8.5 weeks (rater 2), with the raters first analyzing all 3D T2-FLAIR images before starting on FLAIR3 images. There was no specified order for reviewing images in each set. Thus, we did not expect a substantial recall bias. In addition, a neuroradiology fellow (O.A., rater 3) who was not familiar with the imaging protocol or the study objective independently evaluated all images to identify infratentorial and cervical cord lesions. For rater 3, 3D T2-FLAIR and FLAIR3 images from all subjects were pooled and randomized for review. Image evaluation was performed during 1–2 days. Interrater reliability was evaluated using image evaluations by raters 1 and 2, together with the first image evaluation by rater 3. Rater 3 repeated the analysis (with a different randomization) after 3 weeks to assess intrarater reliability.
Lesions were identified as regions with hyperintense signal compared with the background tissue, visible on all 3 planes. ROIs were manually drawn on the identified lesions on an axial section showing the largest extent of the lesion using MRIcron software (https://www.nitrc.org/projects/mricron/).13 The ROIs were carefully placed to minimize partial volume effects from surrounding tissue that could affect contrast computations. Control ROIs were placed in adjacent normal-appearing white matter, and the lesion conspicuity was assessed by the contrast-to-noise ratio (CNR), calculated as CNR = (SL–SB)/SDN, where SL and SB are the average signal intensities in the lesion and background ROIs, respectively, and SDN is the estimated SD of the image noise, obtained from histogram analysis of local image variance.14
To investigate the potential impact of FLAIR3 on the diagnostic criterion in MS, we calculated the number of lesions detected on either or both image sets. We also computed the number of subjects with (n ≥ 1) and without (n = 0) infratentorial or cord lesions on each image.
Statistical Analysis
We constructed histograms to examine distributions of continuous variables. Normality was not satisfied for the difference in the number of lesions. Hence, the number of lesions per subject between 3D T2-FLAIR and FLAIR3 was compared using the Wilcoxon signed rank test. Lesion CNR between T2-FLAIR and FLAIR3 was assessed at the lesion level using the van Elteren test to account for patient clustering. Based on histograms, normality approximately held for the total number (infratentorial + cervical) of lesions only. For the total number of lesions, we fitted the 2-way random-effects models to individual measurements and calculated the intraclass correlation coefficients to measure interrater variability and intrarater reliability. We generated 2000 bootstrap samples to compare the intraclass correlation coefficients for 3D T2-FLAIR and FLAIR3. Pearson correlation analysis and linear regression were performed to visualize the correspondence among the 3 raters for the total number of lesions per subject. A P value <.05 was considered statistically significant for all tests. Statistical analysis was performed using the SAS software (Version 9.4; SAS Institute).
RESULTS
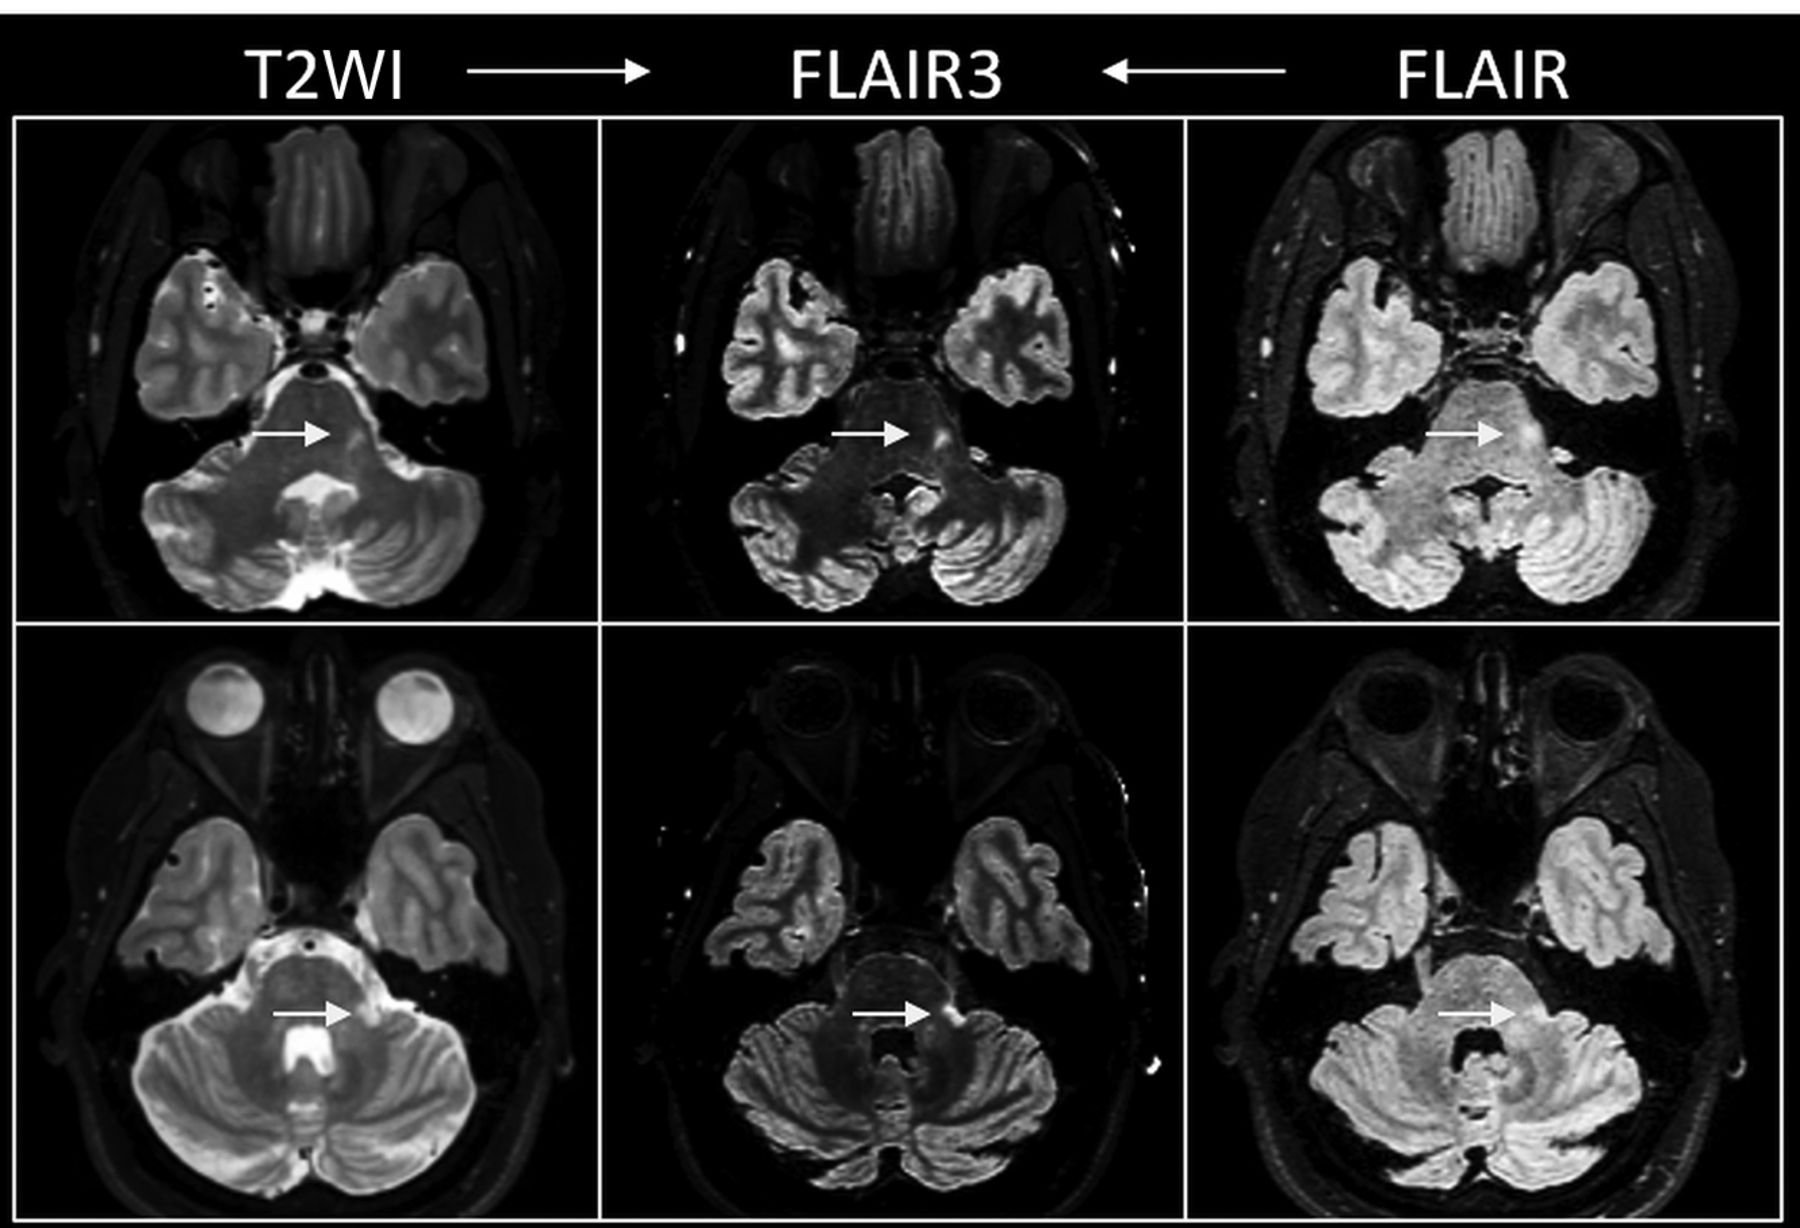
Figure 1 shows representative sections from 3D T2-FLAIR, T2-weighted, and reconstructed FLAIR3 images from 2 patients with MS. Note the improved visual lesion contrast in the infratentorial region on FLAIR3. Corresponding 3D T2-FLAIR and FLAIR3 images are shown in subsequent figures, demonstrating the improved lesion contrast with FLAIR3 in infratentorial (Fig 2) and upper cervical cord (Fig 3) lesions.

Acquired T2-weighted (left) and FLAIR (right) images and the reconstructed FLAIR3 images (middle) from 2 patients with MS (rows). Note the improved contrast of the infratentorial lesions (arrows) on FLAIR3.

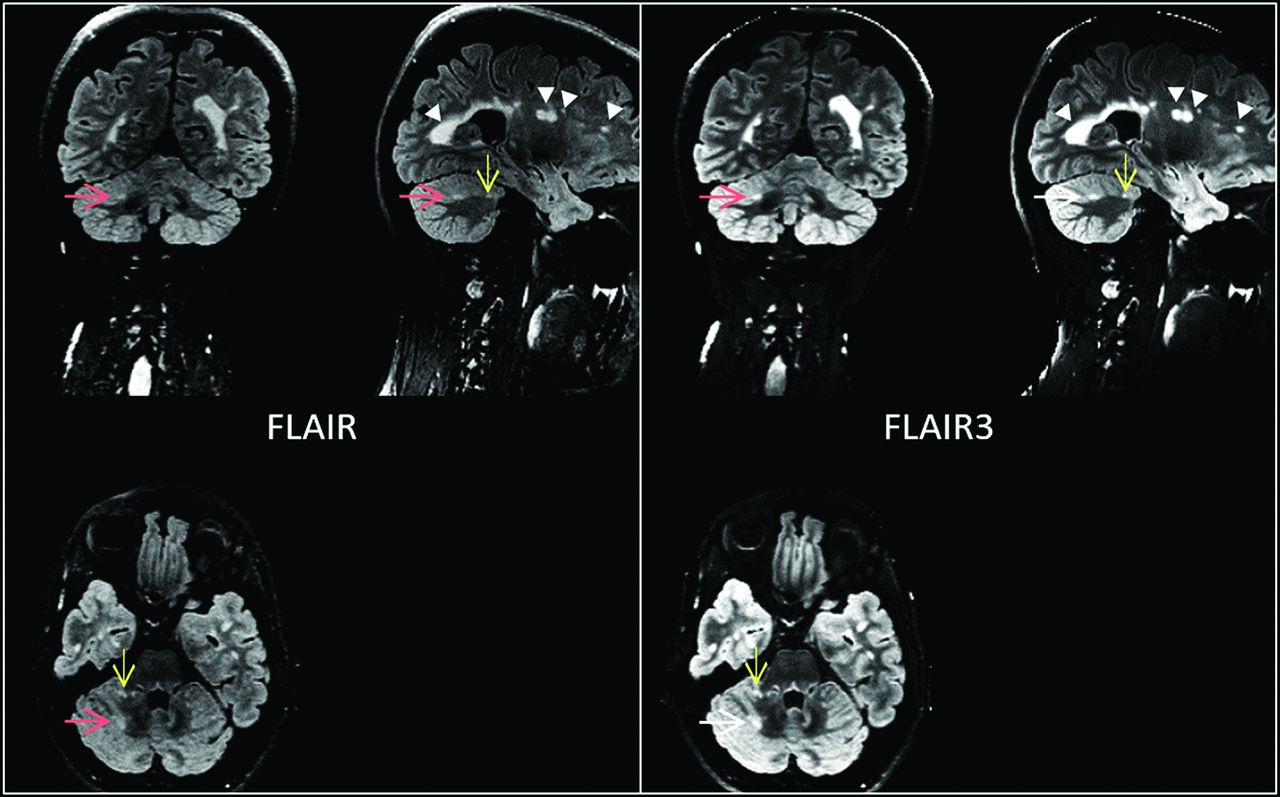
Three-plane view showing the improved contrast of infratentorial lesions (red and yellow arrows) on FLAIR3 compared with FLAIR.

Sagittal (upper row) and axial (lower row) sections showing improved contrast of cervical cord lesions on FLAIR3 compared with FLAIR in 3 patients with MS. The lesions were detected on both FLAIR and FLAIR3 in case A, but only on FLAIR3 in cases in B and C.
The number of all lesions per subject by each rater is summarized in Table 2. A larger number of lesions were found using FLAIR3 for both types of lesion by all raters, with a rater average (± SD) of 6.2 ± 4.2 total lesions on FLAIR3 versus 2.5 ± 2.0 lesions on 3D T2-FLAIR (P < .001). On average, 4.6 ± 3.6 infratentorial lesions and 1.58 ± 0.94 cervical cord lesions were detected on FLAIR3 compared with 2.0 ± 1.8 infratentorial lesions (P < .01) and 0.46 ± 0.45 cervical cord lesions (P < .001) on 3D T2-FLAIR. Lesions on FLAIR3 showed significantly higher average lesion CNR compared with T2-FLAIR (Table 3).
Number of lesions per subject detected on 3D T2-FLAIR and FLAIR3
CNR of lesions detected on 3D T2-FLAIR and FLAIR3a
Good interrater reliability was observed in this study, with a significantly higher intraclass correlation coefficient of 0.77 (95% CI, 0.63–0.87) for all lesions detected on FLAIR3 compared with 3D T2-FLAIR, 0.60 (95% CI, 0.40–0.76) (P = .019). Intrarater reliability was also higher for FLAIR3 with the intraclass correlation coefficient of 0.86 (95% CI, 0.73–0.93) compared with 0.79 (95% CI, 0.61–0.89) for 3D T2-FLAIR, but the difference was not statistically significant (P = .23). Figure 4 shows the pair-wise Pearson correlation among the 3 raters for the average total number of lesions. The better agreement among the raters using FLAIR3 is evident by the higher correlation coefficients.

Scatterplot and linear regression with the 95% confidence interval (shaded) between the raters for the average total number of lesions for 3D T2-FLAIR (upper row, A–C) and FLAIR3 (lower row, D–F).
The number of infratentorial or upper cervical cord lesions detected on 3D T2-FLAIR alone, FLAIR3 alone, and both 3D T2-FLAIR and FLAIR3 is summarized in Table 4. Table 4 also reports the number of subjects with MS with (n ≥ 1) and without (n = 0) infratentorial or cord lesions detected on either or both images. FLAIR3 identified infratentorial lesions in 20%–30% of the subjects and cervical cord lesions in 47%–67% of the subjects who had normal findings on T2-FLAIR.
Number of lesions detected on 3D T2-FLAIR and/or FLAIR3 images
DISCUSSION
In this study, on FLAIR3, we detected approximately 2.3 and 3.4 times the number of infratentorial and cervical cord lesions, respectively, compared with 3D T2-FLAIR, with lesion–white matter CNR showing approximately 4- to 5-fold improvement. In addition, higher intra- and interrater agreement was obtained with FLAIR3, suggesting a higher degree of confidence for lesion identification. Most interesting, rater 3, who was blinded to the type of sequence and the goal of the study, had a similar number of lesions compared with those obtained with the raters familiar with the imaging protocol. This finding supports the superiority of FLAIR3 in objectively detecting the lesions over 3D T2-FLAIR.
The improved detection of infratentorial and cord lesions can increase the confidence in diagnosing and monitoring patients with MS. In addition to its role in diagnosing MS, a previous study found that the volume of infratentorial lesions correlated with the sensory functional system score.15 Infratentorial lesions were also found to be predictive of long-term prognosis in patients with initial findings suggestive of MS,16 and the volume of infratentorial T1-hypointense lesions correlated with the Expanded Disability Status Scale score in patients with MS with chronic cerebellar ataxia.17 The high sensitivity of FLAIR3 can, thus, be useful in studies assessing the prognostic value of these lesions.
Our study first focused on imaging infratentorial lesions, but with the extended coverage in the foot-head direction offered by the 3D sagittal TSE protocols, we were able to additionally assess upper cervical cord lesions. Currently, sagittal sequences including conventional T2-weighted, proton density–weighted,18 STIR,19 and phase-sensitive inversion recovery20 are recommended for assessing spinal cord lesions.21 A comparative study of FLAIR3 with those sequences will be necessary for evaluating the role it can play in spinal cord imaging.
A limitation of FLAIR3, similar to other image-combining methods, is its susceptibility to image registration errors. Executing the T2-FLAIR and T2-weighted sequences in succession with minimal delay can help minimize these errors. Interleaving the T2-FLAIR and T2-weighted acquisitions in a single pulse sequence, similar to interleaved FLAIR/T2*-weighted imaging,22 can eliminate the need for coregistration and simplify the FLAIR3 reconstruction. However, the longer scan time of the interleaved scan may increase susceptibility to motion. Another limitation of FLAIR3 is the reduced image dynamic range, which results from intensity modulation during reconstruction. This was addressed by applying a nonuniformity correction technique after FLAIR3 reconstruction. In this study, we found visually better results with a joint segmentation and bias field correction method12 compared with the N4 bias field correction.23 A FLAIR3-specific nonuniformity correction could theoretically help improve the image quality and will be investigated in future work.
We have thus far evaluated FLAIR3 images reconstructed from 3D FLAIR and 3D T2-weighted images, but generation of FLAIR3 is equally applicable to 2D scans. Volumetric (3D) acquisitions provide higher spatial resolution, facilitate identification of small lesions, and reduce registration errors. However, motion and aliasing are potential problems in 3D imaging. Our cohort of relatively young subjects with MS appears to have tolerated the 3D scans well, and no substantial motion or aliasing artifacts were observed in this study.
Our study was also limited by the relatively small number of subjects. However, the large gains in lesion contrast and number of lesions detected with FLAIR3 are evident even in this small-sized study. The confidence in the results also reflects the observed high contrast of supratentorial lesions, in concordance with a previous study,10 which was visually confirmed in this study. Quantitative assessment for supratentorial lesions was not attempted because these lesions are less challenging to identify compared with infratentorial and cord lesions. Another limitation of this work is the lack of correlation of the identified lesion with clinical measures. Further qualitative and quantitative assessment in a larger cohort will be conducted to assess the potential of FLAIR3 in the clinical evaluation of MS.
CONCLUSIONS
FLAIR3 yields substantial gain in lesion contrast and allows detection of more lesions in the infratentorial brain region and in the upper cervical cord. With its simple acquisition and reconstruction protocol, FLAIR3 may provide a sensitive tool for routine clinical application in the diagnosis and follow-up of patients with MS.
Acknowledgments
We thank Vipulkumar Patel and Corina Donohue for help with the MR imaging studies.
Footnotes
This work was partially funded by the National Institute of Neurological Disorders and Stroke/National Institutes of Health (grant No.1R56NS105857), the Chair in Biomedical Engineering Endowment, and the Dunn Foundation. The 3T scanner was partially funded by National Institutes of Health (grant No. 1 S10 RR19186-01).
Disclosures: Refaat E. Gabr—RELATED: Grant: National Institutes of Health, Dunn Foundation, Chair in Biomedical Engineering Endowment, Comments: National Institute of Neurological Disorders and Stroke/National Institutes of Health (grant No. 1R56NS105857), Dunn Foundation, Chair in Biomedical Engineering*; UNRELATED: Employment: University of Texas Health Science Center at Houston; Grants/Grants National Institutes of Health, Comments: 2 R01 NS055903-10.* John A. Lincoln—UNRELATED: Grants/Grants Pending: Department of Defense, National Institutes of Health, Comments: current Department of Defense grant; Payment for Lectures Including Service on Speakers Bureaus: Biogen Idec. Ponnada A. Narayana—RELATED: Grant: National Institutes of Health*; UNRELATED: Grants/Grants Pending: SanBio.* *Money paid to the institution.
Indicates open access to non-subscribers at www.ajnr.org
References
- Received March 4, 2020.
- Accepted after revision July 22, 2020.
- © 2020 by American Journal of Neuroradiology


Jump to section
Related Articles
Cited By...
- No citing articles found.