
Abstract
BACKGROUND AND PURPOSE: Repeat contrast-enhanced MR imaging exposes patients with relapsing-remitting MS to frequent administration of gadolinium-based contrast agents. We aimed to investigate the potential metabolite and neurochemical alterations of visible gadolinium deposition on unenhanced T1WI in the dentate nucleus using MRS.
MATERIALS AND METHODS: This prospective study was conducted in a referral university hospital from January 2020 to July 2021. The inclusion criteria for case and control groups were as follows: 1) case: patients with relapsing-remitting MS, visible gadolinium deposition in the dentate nucleus (ribbon sign), >5 contrast-enhanced MR images obtained; 2) control 1: patients with relapsing-remitting MS without visible gadolinium deposition in the dentate nucleus, >5 contrast-enhanced MR images obtained; 3) control 2: patients with relapsing-remitting MS without visible gadolinium deposition in the dentate nucleus, <5 contrast-enhanced-MR images obtained; and 4) control 3: adult healthy individuals, with no contrast-enhanced MR imaging. Dentate nucleus and pontine single-voxel 12 × 12 × 12 MRS were analyzed using short TEs.
RESULTS: Forty participants (10 per group; 27 [67.5%] female; mean age, 35.6 [SD, 9.6] years) were enrolled. We did not detect any significant alteration in the levels of NAA and choline between the studied groups. The mean concentrations of mIns were 2.7 (SD, 0.73) (case), 1.5 (SD, 0.8) (control 1), 2.4 (SD, 1.2) (control 2), and 1.7 (SD, 1.2) (control 3) (P = .04). The mean concentration of Cr and mIns (P = .04) and the relative metabolic concentration (dentate nucleus/pons) of lipid 1.3/Cr (P = .04) were significantly higher in the case-group than in healthy individuals (controls 1–3). Further analyses compared the case group with cumulative control 1 and 2 groups and showed a significant increase in lactate (P = .02), lactate/Cr (P = .04), and Cr (dentate nucleus/pons) (P = .03) in the case group.
CONCLUSIONS: Although elevated concentrations of Cr, lactate, mIns, and lipid in the dentate nucleus of the case group indicate a metabolic disturbance, NAA and choline levels were normal, implying no definite neuronal damage.
ABBREVIATIONS:
- CE
- contrast-enhanced
- DN
- dentate nucleus
- GBCA
- gadolinium-based contrast agent
- Gd
- gadolinium
- RRMS
- relapsing-remitting MS
- SI
- signal intensity
MS is a chronic demyelinating, neurodegenerative disease of the CNS that affects >2 million people worldwide.1 Contrast-enhanced (CE) MR imaging is extensively used and is vital for early diagnosis and follow-up of patients with MS because it can help fulfill the “dissemination in time” McDonald criteria. As a result, patients with MS are frequently exposed to the administration of gadolinium-based contrast agents (GBCAs) required for CE-MR imaging.2 GBCAs have been considered very safe since the US Food and Drug Administration’s approval in 1988. The first report of gadolinium deposition as a source of the high signal intensity (SI) in the dentate nucleus (DN) was published in 20143 and has led to extensive investigation of this phenomenon. Initially in patients with MS, radiologists linked the suspicious increase in SI on T1WI in the deep gray matter to MS itself,4 but this etiology has since been discredited. The observed DN hyperintensity on unenhanced T1-weighted images was specifically attributed to the secondary-progressive disease MS subtype, but now there is no support for an independent association between MS and a hyperintense DN.
The GBCAs are either linear or macrocyclic based on their type of polyamino-polycarboxylic ligand. Each of these groups is composed of nonionic and ionic classes of agents based on their electric charge. Despite the rigid cage wrapping around the Gd3+ in macrocyclic GBCAs, this cage is more flexible in the linear type. Because the agent’s cage contributes to its stability, linear-type GBCAs are less stable than macrocyclic agents. As a general concept, the ionic macrocyclic and nonionic linear chelates are the most and least stable GBCAs, respectively.5,6 The thermodynamic and kinetic stabilities of GBCAs are the main concerns in their safety because the stability of the gadolinium (Gd) agent determines the likelihood of its deposition.5 Although several studies have found that hyperintensity in the DN on unenhanced T1-weighted images has the highest association with previous administration of linear GBCAs,7,8 macrocyclic GBCAs can also lead to DN hyperintensity.9
Several studies have investigated the safety of GBCAs in pediatric10,11 and adult patients.12-14 The pooled evidence clearly supports the idea that GBCA administration is significantly, positively, and directly correlated with increased SI in the DN and globus pallidus on unenhanced T1WI assessments.8,9 The aforementioned correlation was detected regardless of the patient’s renal function.6 Studies on patients with MS have also supported this evidence.15,16 However, histologic findings on brain postmortem examinations in human and animal models have not detected any damage, despite the confirmed accumulation of gadolinium in affected structures.17 Quantitative assessments of T1- and T2-weighted imaging also supported an association with previous GBCA administration and gadolinium accumulation, particularly in gray matter structures.13
To date, there is no study, to our knowledge, investigating the brain metabolite alterations following GBCA exposure in humans. A promising and relatively accessible technique is MRS because it has the unique ability to provide the chemical characteristics of MR imaging–visible lesions as well as normal-appearing brain tissue.18 Therefore, we aimed to investigate the potential metabolite alterations in visually detectable Gd deposition in the DN following multiple prior GBCA exposure in patients with MS using a case-control design. Preclinical and clinical studies have reported in vitro neurotoxic effects of Gd exposure due to impairment of mitochondrial function and mitochondrial metabolic alterations subsequent to gadolinium deposition.19,20 We hypothesize that Cr and lactate will show alterations due to disturbed mitochondrial metabolism. We also hoped this study would contribute to the understanding of the molecular and cellular ramifications of Gd deposition.
MATERIALS AND METHODS
Study Design and Participants
This prospective case-control study was reviewed and approved by Institutional Review Board of Imam Khomeini Hospital Complex and was conducted in a quaternary referral university hospital from January 2020 to July 2021. After all patients were informed about the study goals and assured that their medical data would remain confidential, consent was obtained. Patients were also assured that unwillingness to participate in the study or leaving the study would not affect their medical care.
The MS diagnosis was established according to an expert fellowship-trained neurologist based on the McDonald criteria.2 The enrolled patients were selected from a specialized MS center. This center conducts all patients’ follow-up imaging with the same protocol and GBCA type (gadoterate meglumine) that is used for the imaging in this study. No patient had prior GBCA exposure before the MS diagnosis. The inclusion criteria for case and control groups were as follows:
Case: adult patients with relapsing-remitting MS (RRMS) with visually detectable hyperintensity in the DN (ribbon sign; DN/pons SI ratio, >1) who underwent >5 CE-MRIs.
Control 1: adult patients with RRMS without visually detectable hyperintensity in the DN who underwent >5 CE-MRIs.
Control 2: adult patients with RRMS without visually detectable hyperintensity in the DN who underwent <5 CE-MRIs.
Control 3: healthy adult individuals with no history of CE-MRI.
Exclusion criteria were the following: 1) any MS plaques involving the infratentorial region, 2) any other previously diagnosed neurologic diseases, 3) impaired renal function (estimated glomerular filtration rate of <60 mL/min), 4) a history of cranial irradiation, or 5) any other disease requiring CE- MR imaging.
Image Acquisition and Interpretation
MR Imaging Protocol.
All patients were in remission at the time of the examination, and no patient had MS plaques involving the infratentorial region. Patients were scanned on a 3T MR imaging machine (Discovery MR750; GE Healthcare) using a 32-channel phased array head coil. The protocol included axial, coronal, and sagittal T2 FSE: TR = 3000 ms, TE = 106 ms, matrix size = 352 × 256, FOV = 230 × 230, section thickness = 5 mm, flip angle = 142°; and an axial 3D T2*-weighted angiography gradient-echo sequence: TR = 75 ms, TE = 50 ms, section thickness = 2 mm, matrix size = 320 × 224, and FOV = 220 × 220. We used an axial T1 spin echo: TR = 600 ms, TE = 10 ms, section thickness = 5 mm, matrix size = 352 × 256, FOV = 230 × 230 to detect high intensity in the DN. A standard dose (0.1 mmol/kg) of a macrocyclic GBCA (gadoterate meglumine) was administered to all patients during each MR imaging acquisition.
Two fellowship-trained neuroradiologists (with 22 and 10 years of experience), blinded to clinical data, independently reviewed the images. Unenhanced T1WIs were used to draw a 4-mm2 ROI in the middle of the pons and around the area with the highest intensity in the DN. The DN/pons SI ratio was calculated by dividing the mean SI within the DN by the mean SI within the central pons. Any disagreement was resolved by consensus.
MRS Evaluation
MRS imaging with the use of pointed-resolved spectroscopy was performed with the following configurations: long TE = 144 and short TE = 35 ms, FOV = 240 × 240, voxel size = 12 × 12 × 12 mm, TR1 = 500 ms, and number of samples per spectrum = 1024. A chemical shift selective suppression technique was used to suppress the water signal. Out-of-volume saturation bands were applied to suppress signal excited outside the FOV. No lipid suppression was applied. Manual shimming was performed.
Single-voxel 12 × 12 × 12 mm MRS was performed for the evaluation of the DN and pons area. Quantification-procedure MRS imaging data were obtained in TARQUIN (Version 4.3.10; https://sourceforge.net/projects/tarquin/) software. Quantification results for each metabolite were analyzed in the associated optimal TE with the metabolite peaks as follows: choline at 3.2 ppm; NAA at 2.02 ppm; Cr at 3 ppm; lactate at 1.3 ppm; lipid at 0.9- 1.3 ppm; Glx at 2.1–2.4 ppm; and mIns at 3.5 ppm (Online Supplemental Data).
MRS performed with short TE minimizes signal loss due to transverse relaxation, allowing higher quantification precision than long TE.18 However, on short TE, broad macromolecule resonances are presented, which could be a confounding factor for quantification.18 Because macromolecule lipid resonance and lactate resonances are closely located and might overlap each other, the macromolecule confounding problem mainly occurs at the spectra of lactate.21 To confirm that the observed lactate change on short TE was clearly due to lactate, we compared the short TE and long TE spectra with TE = 144, in which the lactate peak was inverted. Then, the lactate quantification was performed on short TE spectra.
Statistical Analysis
We performed the analyses in SPSS for Windows, Version 18 (IBM). All P values < .05 were considered statistically significant. Descriptive data are presented in mean (SD) for continuous variables and frequency and percentage for categoric variables. To assess whether the recorded data have a normal distribution, we performed the Kolmogorov-Smirnov test. We conducted the comparisons by the following: 1) 1-way ANOVA with Tukey post hoc test and an independent 2-tailed sample t test for continuous variables with normal distribution and the relevant degree of freedom, 2) the Kruskal-Wallis test and the Mann-Whitney U test for the continuous variable with a significant lack of normality, and 3) a χ2 test for nominal variables.
RESULTS
Participant Characteristics
Forty participants (10 in each group; 27 [67.5%] females; mean age , 35.6 [SD, 9.6] years; range, 20–57 years) were enrolled in this prospective study. The participants’ demographic features are presented in Table 1. Considering that all patients were scanned with the same protocol and GBCA type, any reported differences are not due to different GBCA agents or scanning techniques. DN/pons SI ratios on T1WI were 1.04, 0.98, 0.94, and 0.94 in case and control 1–3 groups, respectively (P < .001), indicating appropriate selection of case and control groups.
Demographic features of participants
DN Values
The absolute metabolite concentrations and calculated ratios in the DN in all 4 studied groups are presented in Table 2 and Figs 1 and 2. mIns was the only metabolite that was significantly different in all groups. The mean concentrations of mIns were 2.7 (SD, 0.73) (case), 1.5 (SD, 0.8) (control 1), 2.4 (SD, 1.2) (control 2), and 1.7 (SD, 1.2) (control 3) (P = .04). We observed intergroup differences in other metabolites as well, though they were not homogeneous in all 2 × 2 comparisons. The mean concentrations of Cr on short TE (P = .04) and mIns (P = .04) were significantly higher in the case group compared with healthy individuals (control 3). Further analyses compared the case group with an aggregated group of control 1 and 2 participants and showed significant elevation of lactate on short TE (P = .02) and lactate/Cr on short TE (P = .04) in the case group and elevation of Glx/Cr (P = .04) in the control groups.
Absolute mean metabolite concentrations and calculated ratios in the DN in all 4 studied groups

1H-MR spectra from the DN in 1 patient from both case and control groups. Red lines represent the TARQUIN fits. MRS at TE = 35 ms shows elevated mIns peaks at 3.5 ppm, creatine peaks at 3 ppm, lactate peaks at 1.3 ppm, and Glx peaks at 2.1–2.4 ppm.

Boxplots of the metabolites. Differences between case and control groups.
DN-to-Pons Ratio Values
The relative metabolite concentrations and calculated ratios in DN/pons in all 4 studied groups are presented in Table 3. Among all variables, there were 2 statistically significant observations. First, the mean concentration of Cr on short TE (P = .03) was significantly higher in case participants than in a group of control 1 and 2 participants. Second, lipid 1.3/Cr (P = .04) was significantly higher in the case group than in control 3.
Relative mean metabolite concentrations and calculated ratios in DN/pons in all 4 studied groups
DISCUSSION
Our findings support the hypothesis that Gd deposition could be related to metabolite alterations in the DN. Despite evidence of metabolite changes among the studied groups, these findings were minor and their clinical importance should be investigated in further studies. To elaborate, we did not detect any significant alteration in the levels of NAA and Cho among the studied groups, suggesting the absence of neuronal tissue damage in the DN with visually detectable Gd deposition. Nonetheless, the levels of mIns, Cr, lactate, and lipid showed a significant increase in the case group, which can be interpreted as a change in cellular metabolism as discussed below.
Two studies by McDonald et al22,23 used inductively coupled plasma mass spectrometry and detected Gd deposition in the endothelial wall, neural tissue interstitium, and nuclei of neurons in the absence of any gross histologic changes. The concept of Gd crossing the blood-brain barrier and being deposited in neural nuclei raises concern about the potential cytotoxicity of Gd. To this end, preclinical in vitro studies provided insight about the time- and dose-dependent cytotoxic and neurotoxic mechanism of Gd through disturbance of mitochondrial function and oxidative stress.19,24-26 The authors speculated that Gd, as a calcium antagonist due to their similar atomic radius, can interrupt the mitochondrial calcium metabolism leading to cellular death.27
Feng et al19 observed that Gd exposure is associated with mitochondrial membrane depolarization, caspase-3 activation, cytochrome C release, lactate dehydrogenase increase, intracellular reactive oxygen species increase, adenosine triphosphate synthesis decrease, and subsequent DNA fragmentation. All the aforementioned cellular mechanisms indicate mitochondrial dysfunction and oxidative stress leading to neuronal cell apoptosis. The cellular studies of GBCA exposure in humans could help to predict its potential long-term clinical consequences. However, there is only 1 study using PET/CT in human subjects that has investigated the metabolic activity in Gd-deposition regions.28 The authors found 16% and 27% lower [18F] FDG uptake in the DN and globus pallidus, respectively, of individuals who received GBCAs.28 Most interesting, a recent study used untargeted mass spectroscopy–based metabolomic analyses to investigate the plasma metabolite alterations after Gd administration.20 Compared with healthy controls, patients with Gd-deposition disease showed differences in 45 biochemicals, mostly related to mitochondrial function, similar to our findings in the brain.20
We propose that the observed increased levels of Cr in case participants might indicate a disturbance in cellular energy homeostasis. Cr transmission through the blood-brain barrier is minimal, and most Cr is produced in the brain using the arginine:glycine amidinotransferase and guanidinoacetate methyltransferase enzymes.29 Cr is the essential component of high-energy phosphate metabolism (рCr+ADP↔Cr+ATP) and plays a vital role in channeling energy into the cytosol to maintain cellular energy homeostasis.30 Therefore, because MRS measures both Cr and creatine phosphate, compromised cellular energy production due to Gd accumulation could be caused by the responsive up-regulation of Cr as the substrate to compensate for an altered cellular energy system.
Lactate is the product of anaerobic glycolysis and increases in stroke, encephalopathies, lactic acidosis, neonatal hypoxia, and mitochondrial myopathies.18 Neuronal metabolism appears to be mostly oxidative, and astrocytic metabolism is glycolytic according to the hypothesis of astrocyte-neuron lactate shuttle (Fig 3).31-33 Astrocytes take up glucose through the glucose transporter 1 and metabolize it to lactate. Lactate, then, is conveyed to the outside of the astrocytes and is captured by neurons via monocarboxylate transporters. Neurons oxidize intracellular lactate to pyruvate and metabolize it through the oxidative phosphorylation pathway in the mitochondria.31-33 Impaired mitochondrial function and the subsequent oxidative phosphorylation in neurons can result in accumulation of lactate. Therefore, the observed increased lactate in the case group might indicate the existence of an impaired mitochondrial energy environment.

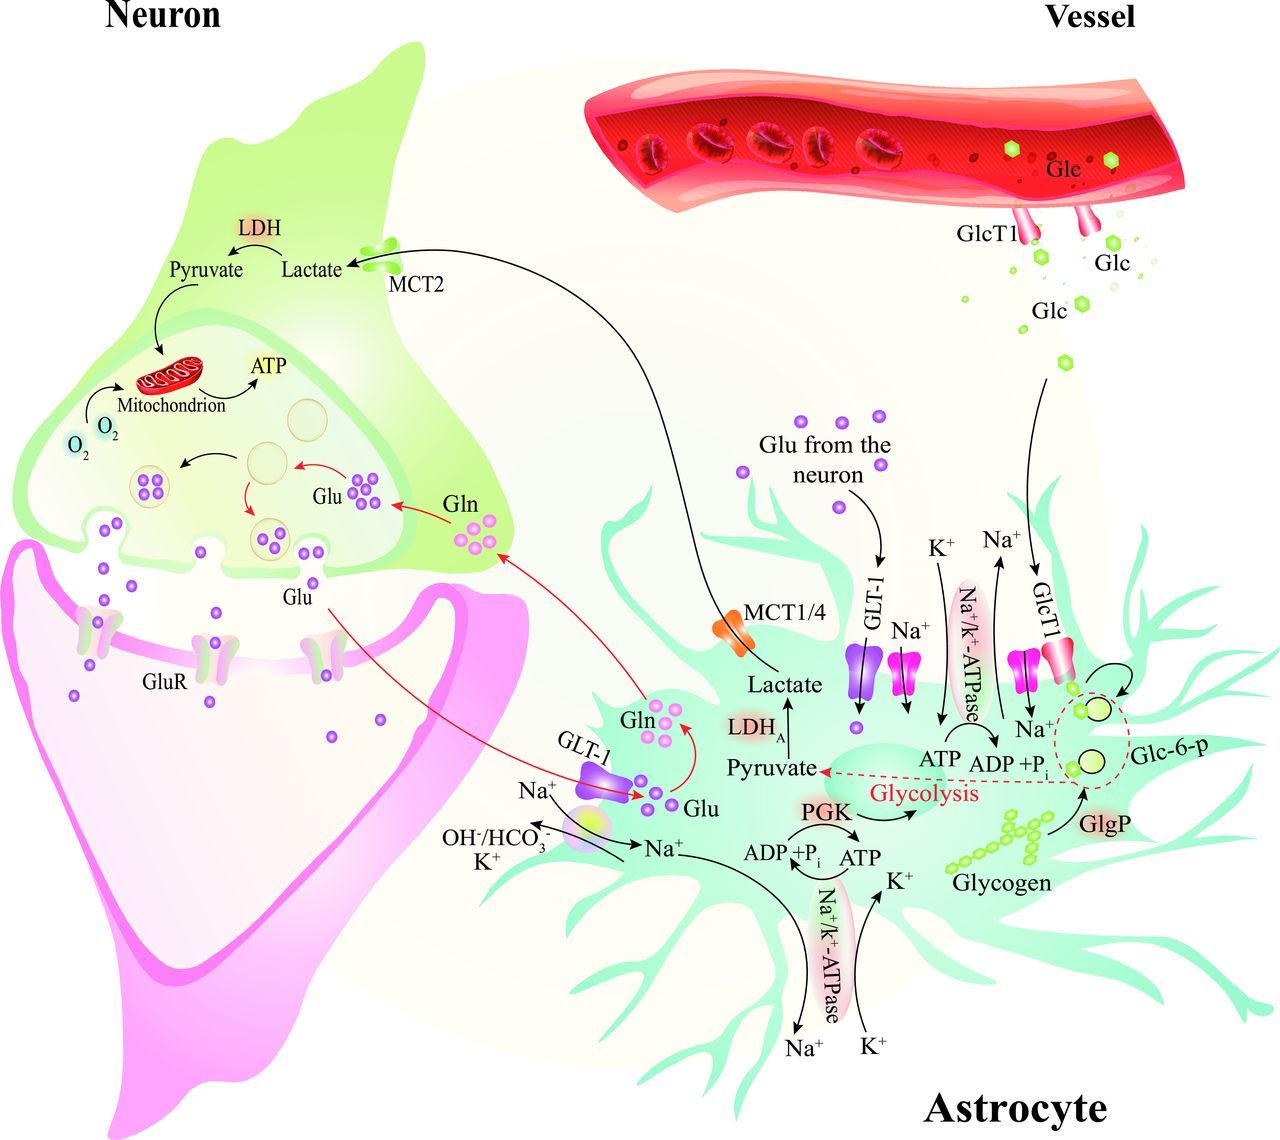
The astrocyte-neuron lactate shuttle and glutamate-glutamine cycles. After traveling through the endothelial cells, glucose (Glc) enters the astrocytes via Glc transporter 1 (GlcT1). It is metabolized to pyruvate and then lactate by lactate dehydrogenase (LDH5). The lactate is carried outside the astrocyte and inside the neuron via the monocarboxylate transporters (MCTs). The lactate inside the neuron is metabolized in the oxygen pathway. Glutamate (Glu) molecules released from presynaptic neurons are transported into the astrocytes through Na+-dependent channels. In astrocytes, the Glu is transformed into Glutamine (Gln) or α-ketoglutarate to perform oxygen metabolism in the Krebs cycle. ATP indicates adenosine triphosphate; ADP, adenosine di-phosphate; P, phosphate; GluR, glutamate receptor; OH/HCO3, hydroxide/bicarbonate; K+, potassium; GLT, glutamate transporter; PGK, phosphoglycerate kinase; ATPase, adenosine triphosphatase.
We also observed lower Glx levels in the case group. Glx is a mixture of similar amino acids that contribute to excitatory-inhibitory neurotransmission processes. Glutamate is released from the presynaptic neuron to stimulate glutamate receptors on the postsynaptic neuron. It enters the astrocytes through the synaptic gap via sodium (Na)-dependent excitatory amino acid activating transporters. Then, it is metabolized into glutamine (by the glutamine synthase enzyme or α-ketoglutarate by glutamate dehydrogenase) to process further oxygen metabolism in the tricarboxylic acid cycle (Krebs cycle) in the mitochondria. Glutamine, then, is transported to neurons to complete further glutamate production using phosphate-activated glutaminase (Fig 3).31,33 Impairment of mitochondria functioning would lead to a compromised glutamate-glutamine cycle, which is dependent on the glutaminase enzyme in the mitochondria. In addition, impairment of the tricarboxylic acid cycle results in less use of α-ketoglutarate and, accordingly, impairment of the transformation of glutamate to α-ketoglutarate. Taken together, a glutamate/glutamine decrease can also be interpreted as a marker for metabolic impairment of neuronal cells.
Lipid levels were also significantly higher in the case group than in healthy controls. A recent study also detected elevated levels of 7-dehydrocholesterol, the cholesterol precursor, in patients with Gd deposition.20 One of the degradation products of the leucine, 3-methylglutarate/2-methylglutarate, also showed increased levels after Gd deposition due to nicotinamide adenine dinucleotide phosphate/nicotinamide adenine dinucleotide phosphate–dependent enzyme impairment.20 Sterol synthesis and leucine degradation are connected via the mevalonate shunt, leading to increased sterol production due to 3-methylglutarate/2-methylglutarate accumulation.34,35 Hence, the authors believe that mitochondrial metabolism impairment due to Gd deposition leads to elevated levels of sterol biosynthesis through the mevalonate shunt.
Myo-inositol and its transporters may provide neuroprotection during or following brain ischemia36 and are often increased in cerebral infarction. Impairment of mitochondrial function and oxidative phosphorylation can simulate a relatively hypoxic condition that leads to the accumulation of mIns. The H+-mIns cotransporter is mainly expressed in the brain and is strongly stimulated by a decrease in pH.37 Subsequently, brain exposure to a substantial lactate load—as discussed before—and a favorable H+ gradient result in a significantly enhanced mIns uptake by the brain. Although mIns is known as a glial cell marker, studies have observed its elevated levels in neurodegenerative disorders without glial cell involvement, including Alzheimer disease, Huntington disease, and ataxia.18 Taken together, the aforementioned mIns observations and the associated clinical conditions raise concerns regarding the long-term sequelae of Gd deposition.
Apart from the proposed notions, there is another potential mechanism behind the accumulation of these metabolites. There is a common understanding that mIns and Cr are the main osmolytes in the brain, which undergo alteration under chronic osmotic changes.38 For instance, sodium-myo-inositol cotransporter-1 in the cortical astrocytes of rats was observed to up-regulate under a chronic hyperosmolar situation.39 Therefore, chronic Gd deposition in the neural tissue interstitium could result in a hyperosmolar condition that induces the production of these osmolytes. Such hyperosmolarity has not been observed at clinical levels to date.
Our findings provide preliminary insight about a potential neurochemical alteration in patients with Gd deposition. Although we observed some degree of metabolite change in association with cellular metabolism and mitochondrial function, there were no significant changes in NAA and choline that would indicate the existence of any major neuronal damage. The authors posit that Gd deposition interrupts the mitochondrial function and results in some minor metabolite changes that are kept at the minimum level through the regulatory and compensatory cellular mechanisms. Nonetheless, the Gd deposition in the DN and evidence of malfunction of the mitochondrial energy pathway shown in animal and in vitro studies raise the specter of subclinical neurotoxicity effects of Gd deposition. Some animal studies have shown loss of motor coordination, including tremor, seizure, ataxia, and stereotyped movements and myoclonus.40,41 In a recent study, patients with Gd-deposition disease reported symptoms similar to those with known mitochondrial-related diseases.20 Although 2 other clinical studies reported lower verbal fluency in patients with MS with repetitive GBCA exposure,42,43 there has not been a comprehensive study to indicate whether there are major adverse clinical effects attributed to multiple GBCA administrations in patients with MS.6,27 We recommend that clinicians limit CE-MR imaging to the necessary indications and conform with the latest guidelines from such reputable bodies as the Consortium of Multiple Sclerosis Centers,44 especially in those with chronic CNS diseases requiring repeat imaging.
Our study has several limitations. Our results indicate some statistically weak associations (.05 <P < .10), but we cannot ensure that they would remain the same if the sample size were larger. Second, although we enrolled patients with RRMS in similar stages of the disease, our case and control groups were not matched for age and sex. Several studies have hypothesized that MS therapeutic agents could alter the brain metabolites, but we did not include the treatment regimens in this study because we were interested in any potential harm of Gd, even if it was caused by an interaction with medications in patients with MS. In addition, our assessment did not include clinical evaluations of the patients and was limited to a specific macrocyclic GBCA. Moreover, this study requires more in-depth comparison of background information between the case and control groups in addition to age and sex, including, but not limited to, extensive medical history, smoking history, environmental exposures, and other neurologic conditions. We highly recommend conducting randomized controlled trials that incorporate information on the suggested background conditions that could help reveal the potential clinical significance of gadolinium deposition.
CONCLUSIONS
We found elevated concentrations of Cr, lactate, mIns, and lipid in the DN of patients with visible Gd deposition on their unenhanced T1WIs, indicating a metabolic disturbance in the affected patients. Our findings confirm previous studies implicating a potential adverse effect of Gd deposition on mitochondrial membrane and function. However, because we observed normal levels of NAA and choline in the DN, neuronal damage might be disavowed. Nevertheless, we require further clinical correlation and support for this notion. We recommend that clinicians remain cautious in their use of Gd, and that researchers should build on these preliminary findings by enrolling patients in a study with a larger sample size, with controlled and randomized design and full clinical assessment of the patients.
Acknowledgment
The authors thank the patients and hospital staff for their collaboration.
Footnotes
M. Mohammadzadeh and S. Kolahi had equal contribution as co-first authors.
Disclosure forms provided by the authors are available with the full text and PDF of this article at www.ajnr.org.
References
- Received February 3, 2022.
- Accepted after revision July 1, 2022.
- © 2022 by American Journal of Neuroradiology


Jump to section
Related Articles
Cited By...
- No citing articles found.