
Abstract
BACKGROUND AND PURPOSE: High-resolution postcontrast 3D T1WI is a widely used sequence for evaluating brain metastasis, despite the long scan time. This study aimed to compare highly accelerated postcontrast 3D T1-weighted sampling perfection with application-optimized contrasts by using different flip angle evolution by using wave-controlled aliasing in parallel imaging (wave-T1-SPACE) with the commonly used standard high-resolution postcontrast 3D T1-SPACE for the evaluation of brain metastases.
MATERIALS AND METHODS: Among the 387 patients who underwent postcontrast wave-T1-SPACE and standard SPACE, 56 patients with suspected brain metastases were retrospectively included. Two neuroradiologists assessed the number of enhancing lesions according to lesion size, contrast-to-noise ratiolesion/parenchyma, contrast-to-noise ratiowhite matter/gray matter, contrast ratiolesion/parenchyma, and overall image quality for the 2 different sequences.
RESULTS: Although there was no significant difference in the evaluation of larger enhancing lesions (>5 mm) between the 2 different sequences (P = .66 for observer 1, P = .26 for observer 2), wave-T1-SPACE showed a significantly lower number of smaller enhancing lesions (<5 mm) than standard SPACE (1.61 [SD, 0.29] versus 2.84 [SD, 0.47] for observer 1; 1.41 [SD, 0.19] versus 2.68 [SD, 0.43] for observer 2). Furthermore, mean contrast-to-noise ratiolesion/parenchyma and overall image quality of wave-T1-SPACE were significantly lower than those in standard SPACE.
CONCLUSIONS: Postcontrast wave-T1-SPACE showed comparable diagnostic performance for larger enhancing lesions (>5 mm) and marked scan time reduction compared with standard SPACE. However, postcontrast wave-T1-SPACE showed underestimation of smaller enhancing lesions (<5 mm) and lower image quality than standard SPACE. Therefore, postcontrast wave-T1-SPACE should be interpreted carefully in the evaluation of brain metastasis.
ABBREVIATIONS:
- CNR
- contrast-to-noise ratio
- CR
- contrast ratio
- DANTE
- delay alternating with nutation for tailored excitation
- SPACE
- sampling perfection with application-optimized contrasts by using different flip angle evolution
- wave-CAIPI
- wave-controlled aliasing in parallel imaging
Early detection of brain metastasis is important for the treatment decisions of patients. Stereotactic radiosurgery delivers highly focused radiation to small metastatic lesions with minimal damage to adjacent normal brain tissue, thereby improving the safety of the patients and the outcome. Currently, high-resolution postcontrast 3D T1WI is widely used for evaluating brain metastasis due to its higher sensitivity for detecting small enhancing lesions than postcontrast 2D T1WI. However, the long scan time (5∼10 minutes) of high-resolution postcontrast 3D T1WI is a major drawback1⇓-3 for patients with cancer who could not tolerate the scan time due to poor their general conditions.4 Long scan times may contribute to increased motion artifacts and the patient's anxiety.5
Recently, accelerated 3D acquisition techniques have been developed to reduce the scan time of high-resolution 3D T1WI sequences while preserving image quality.6⇓-8 There are several studies6⇓-8 that have used accelerated 3D acquisition techniques, such as 3D-FLASH pulse sequence, multishot 3D EPI, and compressed sensing. They showed comparable diagnostic performance for the detection of enhancing intracranial lesions and sufficient image quality compared with standard 3D T1WI. Wave-controlled aliasing in parallel imaging (Wave-CAIPI; Siemens) is an advanced parallel imaging technique that combines a corkscrew gradient trajectory with CAIPI shifts in the ky and kz directions to efficiently encode the k-space and evenly spread the voxel aliasing in all dimensions. This feature takes better advantage of the 3D coil-sensitivity information to provide highly accelerated parallel imaging with negligible artifacts and SNR penalties.9
There have been several comparative studies9⇓⇓⇓⇓⇓-15 between Wave-CAIPI and standard MR images. However, there was only 1 study10 applying postcontrast wave-T1-sampling perfection with application-optimized contrasts by using different flip angle evolution (SPACE; Siemens) to the evaluation of brain metastasis. This study reported noninferiority and equivalent diagnostic performance of postcontrast wave-T1-SPACE compared with standard postcontrast 3D T1-SPACE for visualization of enhancing lesions. However, the authors did not perform quantitative comparison between the 2 sequences and included only a small number of brain metastases. To the best of our knowledge, no previous studies have evaluated the diagnostic performance of subcentimeter enhancing metastases using postcontrast wave-T1-SPACE. Therefore, we evaluated the diagnostic performance according to the lesion size and overall image quality of postcontrast wave-T1-SPACE and compared it with the commonly used standard high-resolution postcontrast 3D T1-SPACE sequence for the evaluation of brain metastases. We hypothesized that wave-T1-SPACE shows comparable diagnostic performance and sufficient image quality for the evaluation of brain metastasis compared with standard SPACE, according to the results of a previous study.9
MATERIALS AND METHODS
Patients
Patient Population.
This study was approved by the institutional review board of Inje University Busan Paik Hospital, and the need for informed consent was waived due to the retrospective nature of our study. Between August 2020 and July 2021, three hundred eighty-seven patients with histologically confirmed primary tumors (lung cancer, 45; breast cancer, 4; colorectal cancer, 2; renal cell carcinoma, 2; esophageal cancer, 1; hepatocellular carcinoma, 1; malignant melanoma, 1) underwent a brain MR imaging for the work-up or follow-up of brain metastasis. They underwent postcontrast 3D T1WI performed using standard SPACE with the delay alternating with nutation for tailored excitation (DANTE) sequences and wave-T1-SPACE in the same imaging session for the evaluation of brain metastases. Two experienced neuroradiologists with 21 and 6 years of experience in neuroimaging determined the brain metastases, according to the following criteria: 1) newly occurring enhancing lesions or morphologic change of the existing lesions on follow-up MR imaging after treatment; 2) not an artifact or normal enhancing structure (such as vascular structure); and 3) a brain parenchymal enhancing lesion. Determination of brain metastases was made by consensus on the basis of previous and follow-up MR imaging. Patients without enhancing lesions (n = 298), patients who had enhancing lesions but did not undergo follow-up MR imaging (n = 24), patients with suspected leptomeningeal metastasis (n = 8), or patients who presented with severe motion artifacts (n = 1) were excluded. Finally, 56 patients with a mean age of 64.7 years (age range, 45–88 years; 35 men and 21 women) were included. A total of 207 enhancing lesions were considered as brain metastases.
Imaging Acquisition
All studies were performed using a 3T MR imaging scanner (Magnetom Skyra; Siemens) with a 64-channel head coil. In addition to the postcontrast SPACE with DANTE and wave-T1-SPACE with fat suppression, standard imaging sequence with axial FLAIR, T2-weighted, T1-weighted, and gradient-echo sequences were obtained. A dose of 0.2 mL/kg body weight of gadoterate meglumine (Dotarem; Guerbet) was injected by a power injector (Spectris Solaris EP MR injector system; Medrad), followed by a saline flush of 10 mL. The 2 different postcontrast 3D SPACE sequences were obtained in a consistent order with standard SPACE followed by wave-T1-SPACE. The detailed technical parameters of the postcontrast 3D T1WI are described in Table 1.
Parameters of postcontrast wave-T1-SPACE and standard SPACE
Image Analysis
Two neuroradiologists with 7 and 3 years of experience independently evaluated both MR images for the presence of brain metastases in each patient. Two observers reviewed all images using a PACS and were blinded to the clinical diagnosis. However, the observers were not blinded to the type of sequences due to the distinctive characteristics of the MR images. Both observers were instructed to report every enhancing lesion in the brain parenchyma except for artifacts or normal anatomic structures. The metastatic lesions were classified according to the maximal diameter of the enhancing lesions: large (>5 mm) and small (<5 mm). Each MR image was reviewed at 2 different time points at least 4 weeks apart, to avoid recall bias.
For quantitative analysis, the contrast ratio (CR) and contrast-to-noise ratio (CNR) of lesions to normal parenchyma (CNRlesion/parenchyma) and CNR of white matter to gray matter (CNRwhite matter/gray matter) for wave-T1-SPACE and standard SPACE were estimated. We selected homogeneous, solid enhancing lesions of >5 mm in the largest diameter for the evaluation of CNRlesion/parenchyma and CRlesion/parenchyma, but we excluded the cystic portion or necrosis due to difficulty in drawing the ROI. The CR and CNR were calculated using the following formula, according to previous studies:2,16,17


SI is the mean signal intensity of the ROI, and SD is the standard deviation of the noise. One neuroradiologist (with 7 years of experience) tried to draw ROIs in the center of the enhancing lesion, and ROIs of each sequence were placed visually in a side-by-side comparison, trying to draw an identical size and location. ROIs for the SI and SD of the parenchyma were placed in the adjacent parenchyma, including both white matter and gray matter because of inhomogeneous noise distribution in parallel imaging.18 The corpus callosum and the head of caudate nucleus were selected for the ROIs of white matter and gray matter. Every ROI of normal parenchyma (white and gray matter) measured 23.41 mm2, but the areas of the ROIs of enhancing lesions were variable, depending on lesion size (from 9.83 to 32.01 mm2).
For qualitative analysis, we visually analyzed the overall diagnostic image quality for the different enhanced 3D T1WI sequences using a 5-point Likert scale: 5 = excellent image quality, 4 = slight blurring but not compromising the image assessment, 3 = moderate blurring that slightly compromised the evaluation, 2 = severe blurring resulting in a major limitation in evaluation, 1 = nondiagnostic image quality.1
Statistical Analysis
All statistical analyses were performed using statistical software packages (SPSS; Version 26.0, IBM; and MedCalc, Version 19.8; MedCalc Software). All data obtained from the qualitative and quantitative analyses are reported as the means. The Kolmogorov-Smirnov test was used to test the distribution of variables. CNRWM/GM, CNRlesion/parenchyma, and CRlesion/parenchyma had a normal distribution; the paired t test was used for the analyses. The Wilcoxon signed-rank test was used to compare the difference in the number of enhancing lesions and overall diagnostic image quality scores between the 2 different sequences. Interobserver agreement between the 2 readers was calculated by weighted κ statistics; 0–0.20, 0.21–0.40, 0.41–0.60, 0.61–0.80, and 0.81–1.00 were interpreted as slight, fair, moderate, substantial, and almost perfect agreement, respectively, on the basis of the method of Landis and Koch.19 Statistical significance was set at P < .05.
RESULTS
For the mean number of enhancing lesions of <5 mm, standard SPACE showed a significantly higher number of contrast-enhancing lesions than wave-T1-SPACE for both observers (2.84 [SD, 0.47] versus 1.61 [SD, 0.29] for observer 1, and 2.68 [SD, 0.43] versus 1.41 [SD, 0.19] for observer 2) (P < .001 for both observers) (Table 2 and Figs 1 and 2). Sixty-nine enhancing lesions were missed by observer 1, and 71 were missed by observer 2, using wave-T1-SPACE (Fig 3). Standard SPACE showed almost perfect agreement (weighted κ, 0.81; 95% CI, 0.74–0.88) and wave-T1-SPACE showed substantial agreement (weighted κ, 0.72; 95% CI, 0.59–0.84) between the 2 observers. However, there was no significant difference between standard SPACE and wave-T1-SPACE for the mean number of enhancing lesions of >5 mm (P = .66 for observer 1, and P = .26 for observer 2) (Fig 4). Only 1 enhancing lesion was missed by observer 1, and none of the enhancing lesions were missed by observer 2 using wave-T1-SPACE. Both MR images showed almost perfect agreement between the 2 observers (weighted κ, 0.95; 95% CI, 0.91–1.00 for wave-T1-SPACE and 1.00; 95% CI, 0.99–1.00 for standard SPACE) for the measurement of the number of enhancing lesions of >5 mm.

Brain MR imaging of a 62-year-old male patient with lung cancer. Postcontrast standard SPACE images (A, C, and E) show multiple variable-sized, enhancing lesions in both cerebral hemispheres. Multiple enhancing lesions are also well-visualized on postcontrast wave-T1-SPACE (B, D, and F), though more noise was present than in standard SPACE.

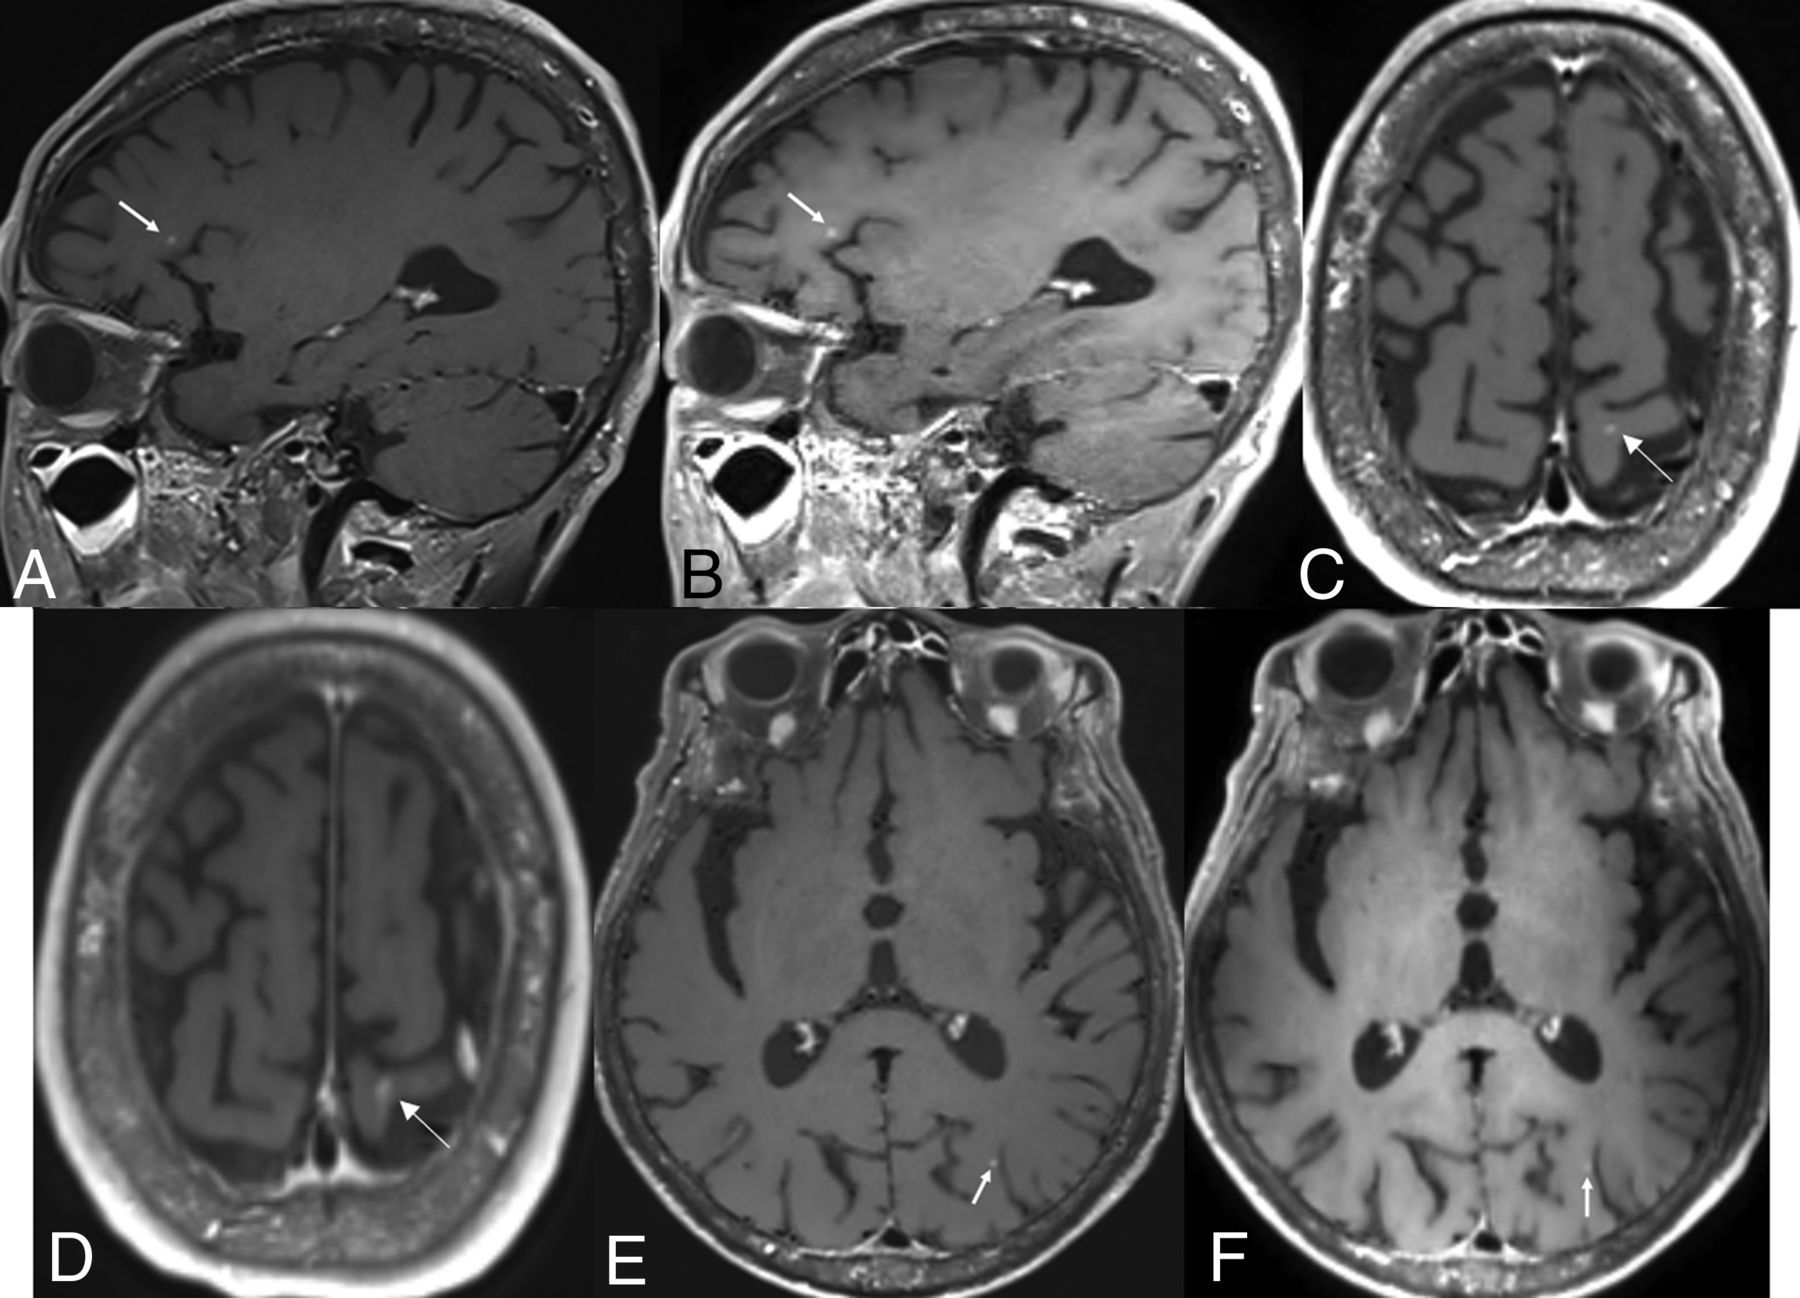
Brain MR imaging of a 68-year-old male patient with lung cancer. Postcontrast standard SPACE (A, C, and E) shows multiple tiny enhancing lesions in both cerebral hemispheres. Although these tiny enhancing lesions are also visible on postcontrast wave-T1-SPACE (B, D, and F), they are somewhat less pronounced (arrows).

Brain MR imaging of a 54-year-old male patient with lung cancer. Postcontrast standard SPACE (A, C, and E) shows a tiny enhancing lesion (arrows) in the right frontal lobe, but it is almost invisible on postcontrast wave-T1-SPACE (B, D, and F).

Brain MR imaging of a 77-year-old male patient with colorectal cancer. Postcontrast standard (A, C, and E) and wave-T1-SPACE (B, D, and F) show multiple large-sized, enhancing masses in both cerebral hemispheres, and there was no significant difference in the visualization of enhancing lesions, though more noise was observed in postcontrast wave-T1-SPACE.
Comparison of lesion detectability according to the types of MR images and enhancing lesion size
A total of 21 patients with homogeneous and solid, enhancing lesions larger than 5mm in size were evaluated for measurement of CNRlesion/parenchyma and CRlesion/parenchyma (Table 3). The mean CNRlesion/parenchyma and CRlesion/parenchyma of standard SPACE (53.74 [SD, 8.15], 99.75 [SD, 10.88], respectively) were significantly higher than those of wave-T1-SPACE (23.03 [SD, 3.63], 63.42 [SD, 8.68], respectively) (P < .0001). However, the mean CNRwhite matter/gray matter of standard SPACE (−0.99 [SD, 0.40] was significantly lower than wave-T1-SPACE (2.86 [SD, 0.47]) (P < .0001).
CNRlesion/parenchyma, CNRwhite matter/gray matter, and CRlesion/parenchyma and image quality of postcontrast wave-T1-SPACE and standard SPACE
Although the mean scores of overall diagnostic image quality were significantly lower with wave-T1-SPACE (4.27 [SD, 0.49]) than with standard SPACE (4.98 [SD, 0.13]) (P < .0001), wave-T1-SPACE showed sufficient image quality with an average image-quality assessment rating of more than grade IV (Table 3).
DISCUSSION
In this study, the number of measured, smaller enhancing lesions (<5 mm in maximal diameter) and CNRlesion/parenchyma of postcontrast wave-T1-SPACE was significantly lower than that of postcontrast standard SPACE. However, there was no significant difference in the evaluation of larger enhancing lesions (>5 mm in maximal diameter) between the 2 types of postcontrast SPACE sequences, and scan-time reduction was achieved using wave-controlled aliasing in parallel imaging (wave-CAIPI) compared with standard SPACE (2 minutes 2 seconds versus 3 minutes 55 seconds). Furthermore, 98.2% (55/56) of wave-T1-SPACE showed excellent image quality or slight blurring that did not compromise image quality, though the image quality of wave-T1-SPACE was significantly lower than that of standard SPACE.
Wave-T1-SPACE has been reported as not susceptible to imaging blurring and geometric distortion caused by the inhomogeneity of the main magnetic field.20,21 It has proved to be a promising, accelerated MR imaging technique that was noninferior to standard MR images for the evaluation of pathology, artifacts, and overall diagnostic quality with decreasing scan time and motion artifacts.12,13 Goncalves Filho et al15 reported that postcontrast wave-T1-SPACE further emphasizes the advantage of the SPACE sequence and causes the enhancing lesions to stand out more by decreasing the background signal intensity and removing signal from vascular flow-related artifacts. They showed noninferior visualization and diagnostic quality of postcontrast wave-T1-SPACE compared with standard SPACE for the evaluation of parenchymal and meningeal enhancing lesions without loss of clinically important information.
However, our study showed that postcontrast wave-T1-SPACE showed lower image quality and inferior visualization for smaller enhancing lesions than postcontrast standard SPACE. Although Goncalves Filho et al15 reported that postcontrast wave-T1-SPACE was noninferior to standard SPACE for visualization of enhancing pathology, both observers preferred more cases of standard SPACE over wave-T1-SPACE for diagnostic quality and less background noise and motion artifacts. Postcontrast standard SPACE was also preferred over wave-T1-SPACE for the background noise and motion artifacts in another study by these authors.10 These results were consistent with ours; however, they did not perform a quantitative comparison between the 2 types of postcontrast SPACE, and they did not evaluate the diagnostic performance for the subcentimeter enhancing lesions, unlike our study.
Recently developed other types of accelerated 3D acquisition techniques6⇓-8 have also shown lower image quality than standard postcontrast 3D T1WI. Postcontrast 3D-FLASH showed more reduced susceptibility and motion artifacts than standard MPRAGE.7 However, it showed inferior conspicuity of very small or mildly enhancing lesions than standard MPRAGE due to a lower SNR.7 Postcontrast ultrafast 3D-EPI also showed lower image quality than standard MPRAGE. In addition, it had pseudolesions due to susceptibility artifacts and inevitable geometric distortion of the EPI-derived sequence, though it can achieve postcontrast 3D T1WI with 30 seconds.8 Therefore, it is thought that there is a trade-off problem between scanning time and image quality in accelerated 3D acquisition techniques including wave-T1-SPACE.
Postcontrast 3D T1WI using wave-CAIPI has more noise than standard SPACE, and this result was consistent with those of previous studies.11,12,15 In previous studies,11,12,15 increased noise did not affect the diagnostic performance, and similarly, in our study, it did not affect the detection of larger enhancing lesions. The authors explained the cause of more noise being the interactions between the wave-CAIPI approach and motion/flow-related artifacts, free induction decay–related artifacts, other 3D spin-echo related artifacts, or imperfections of the wave-CAIPI acquisition and reconstruction process.15 Further evaluation of the accurate causes of noise and technical development of wave-CAIPI images in the future will improve diagnostic quality of wave-T1-SPACE.11
Our study has several limitations. First, there was an inevitable selection bias due to the single-center and retrospective nature of the study. Second, we could not randomize the order of the wave-T1-SPACE and standard SPACE because of the retrospective nature of the study. Thus, the timing bias between contrast injection and image acquisition might affect the difference between the 2 MR images. Further randomized studies on the order of image acquisition with a large number of patients are needed to further validate the results. Third, complete blindness of the sequence type was impossible due to the distinctive characteristics of each MR image. Fourth, pathologic confirmation of all metastatic lesions was not possible because patients with brain metastases usually do not undergo surgical intervention. Last, we did not apply the recommended time delay for obtaining enhanced T1WI in brain tumor imaging.3,2,2 Ellingson et al3 and Kaufmann et al22 suggested 4 and 8 minutes after contrast injection, respectively, but it was difficult to apply the recommended protocol in clinical practice due to the limited number of MR imaging resources.
CONCLUSIONS
Postcontrast wave-T1-SPACE could markedly decrease the scan time of postcontrast SPACE T1WI (2 minutes 2 seconds versus 3 minutes 55 seconds), and there was no significant difference in the evaluation of larger-sized enhancing lesions (>5 mm in maximal diameter). Furthermore, 98.2% of wave-T1-SPACE images showed excellent image quality or slight blurring without compromising image assessment. However, postcontrast wave-T1-SPACE showed underestimation of smaller enhancing lesions (<5 mm in maximal diameter) and more noise than standard postcontrast 3D SPACE. Therefore, it is necessary to recognize these limitations, and postcontrast wave-T1-SPACE should be interpreted with caution in clinical practice.
ACKNOWLEDGMENTS
The authors thank Kang Soo Kim and In Seong Kim (Siemens, South Korea) for applying and optimizing the wave-CAIPI and DANTE.
Footnotes
Disclosure forms provided by the authors are available with the full text and PDF of this article at www.ajnr.org.
References
- Received February 3, 2022.
- Accepted after revision March 24, 2022.
- © 2022 by American Journal of Neuroradiology


