
Abstract
BACKGROUND AND PURPOSE: The normal appearance of the vestibular aqueduct on postcontrast MR images has not been adequately described in the literature. This study set out to characterize the expected appearance of the vestibular aqueduct, with particular emphasis on the enhancement of the structure on both 3D FSE T1 and 3D-FLAIR sequences.
MATERIALS AND METHODS: All MR imaging examinations of the internal auditory canals performed between March 1, 2021, and May 20, 2021, were retrospectively reviewed. All studies included high-resolution (≤0.5-mm section thickness) pre- and postgadolinium 3D FSE T1 with fat-saturated and postgadolinium 3D-FLAIR sequences. Two neuroradiologists independently reviewed the MR images of the vestibular aqueduct for the presence or absence of enhancement on both T1 and FLAIR images and compared the relative intensity of enhancement between sequences. The presence or absence of an enlarged vestibular aqueduct was also noted.
RESULTS: Ninety-five patients made up the patient cohort, of whom 5 did not have postcontrast FLAIR images available (50 women [55.6%]). On both sides, enhancement was significantly more commonly seen on postgadolinium FLAIR (76/180, 42.2%) than on T1 fat-saturated images (41/190, 21.6%) (P < .001). The intensity of enhancement was significantly greater on postgadolinium FLAIR images than on T1 fat-saturated images (38.9% versus 3.7%, respectively; P < .001).
CONCLUSIONS: Enhancement within the vestibular aqueduct is an expected finding on MR imaging and is both more common and more intense on postgadolinium 3D-FLAIR than on T1 fat-saturated sequences. Such enhancement should not be confused with pathology on MR imaging unless other suspicious findings are present.
ABBREVIATIONS:
- FS
- fat-saturation
- IAC
- internal auditory canal
- postgad
- postgadolinium
- VA
- vestibular aqueduct
The vestibular aqueduct (VA) is a J-shaped bony canal measuring approximately 5–17 mm in length.1 It extends from the medial side of the vestibule to the petrous portion of the temporal bone and contains the endolymphatic duct, which is lined with cuboidal or low-columnar epithelial cells.1 Along its course, the duct progressively narrows until it becomes the endolymphatic sac.1 The endolymphatic duct serves to connect the endolymphatic sac, inner ear vestibule, and cochlea. It functions as 1 of the 3 communication pathways between the intracranial space and inner ear and is thought to provide inner ear pressure equilibrium and fluid homeostasis.1 The endolymphatic duct also acts as an intracranial pressure buffer via the connection between the cochlea aqueduct and CSF.2
Accurate evaluation of the VA is of utmost importance because abnormalities of the aqueduct can be associated with pathologic conditions, most notably enlarged VA syndrome and endolymphatic sac tumors. The anatomy of the VA and its appearance on MR cisternogram sequences have been previously described. Multiple studies have demonstrated high sensitivity in diagnosing an enlarged VA on MR imaging. McKinney3 has reported that enhancement within the VA can be a normal finding in 20%–30% of asymptomatic patients on MR imaging. Little, however, is known about the expected appearance of the VA on postcontrast MR imaging T1 and FLAIR sequences. Thus, this study set out to characterize the expected appearance of the VA in a cohort of patients being evaluated for asymmetric sensorineural hearing loss, with particular emphasis on enhancement within the structure on both T1 and FLAIR sequences.
MATERIALS AND METHODS
Patient Selection
Institutional review board approval was obtained for this study. A retrospective review was completed of all internal auditory canal (IAC) protocol MR imaging examinations performed between March 1, 2021, and May 20, 2021, in patients being evaluated for asymmetric sensorineural hearing loss. We included MRIs with findings that were considered normal on both the initial interpretation and our subsequent review as part of this study. Included patients had 3T MR examinations (Verio, Skyra, Prisma; Siemens) that included high-resolution (≤0.5-mm section thickness) pre- and postgadolinium (postgad) sequences completed for IAC protocol imaging with 3D sampling perfection with application-optimized contrasts by using different flip angle evolution (SPACE; Siemens) FSE T2, 3D SPACE FSE T1 pre- and postgad (with fat-saturation [FS]), and 3D SPACE FLAIR. As part of the standard IAC MR imaging protocol of our institution, pre- and postgad T1-FS images and postgad FLAIR images are routinely obtained.
Imaging and Clinical Review
Two neuroradiologists independently reviewed MR images of the VA for the following: 1) the presence or absence of T1 postcontrast enhancement, 2) the presence or absence of postgad FLAIR enhancement, 3) comparison of enhancement intensity between T1 postcontrast and postgad FLAIR (ie, whether enhancement was subjectively greater on T1-FS or FLAIR sequences), and 4) the presence or absence of VA enlargement. To ensure that we were observing real enhancement, we coregistered pre- and postcontrast T1-weight images. All discrepancies were resolved by consensus.
Statistical Analysis
The frequency of enhancement in T1 postcontrast and FLAIR postcontrast images was compared. Two group proportions were compared using 2 group binomial tests. Additionally, the intensity of enhancement of both sequences was compared. Agreement for the left and right sides for both MR imaging sequences was compared using the χ2 test. The α level of <.05 was used as the significance level. All the statistical analyses were performed by BlueSky Statistics (Commercial server edition, Version 7.40; https://www.blueskystatistics.com/category-s/118.htm).
RESULTS
Of the 100 patients who met the inclusion criteria for this study, 5 were excluded due to incomplete MR imaging sequences. Five patients did not have postgad FLAIR sequence performed but were included in the remainder of the study. Hence, 95 patients made up the patient cohort, allowing a total of 190 VAs for analysis on postgad T1-FS images and 180 VAs for analysis on postgad FLAIR images. Fifty (55.6%) of the included subjects were women. The average patient age was 58 years, ranging from 18 to 84 years of age.
Enhancement was observed in 76/180 (42.2%) VAs on postgad FLAIR images, and in 41/190 (21.6%) VAs on postgad T1-FS images. VA enhancement was observed in significantly greater frequency on postgad FLAIR than on T1-FS sequences (P < .0001). In patients who had enhancement on both sequences, the intensity of enhancement was subjectively greater on a larger proportion of postgad FLAIR than on T1-FS sequences (38.9% versus 3.7%, respectively; P < .0001). There was no significant difference in the incidence of VA enhancement between the left and right sides (P < .0001). Only 1 VA was noted to be enlarged, which did not demonstrate enhancement on either sequence.
DISCUSSION
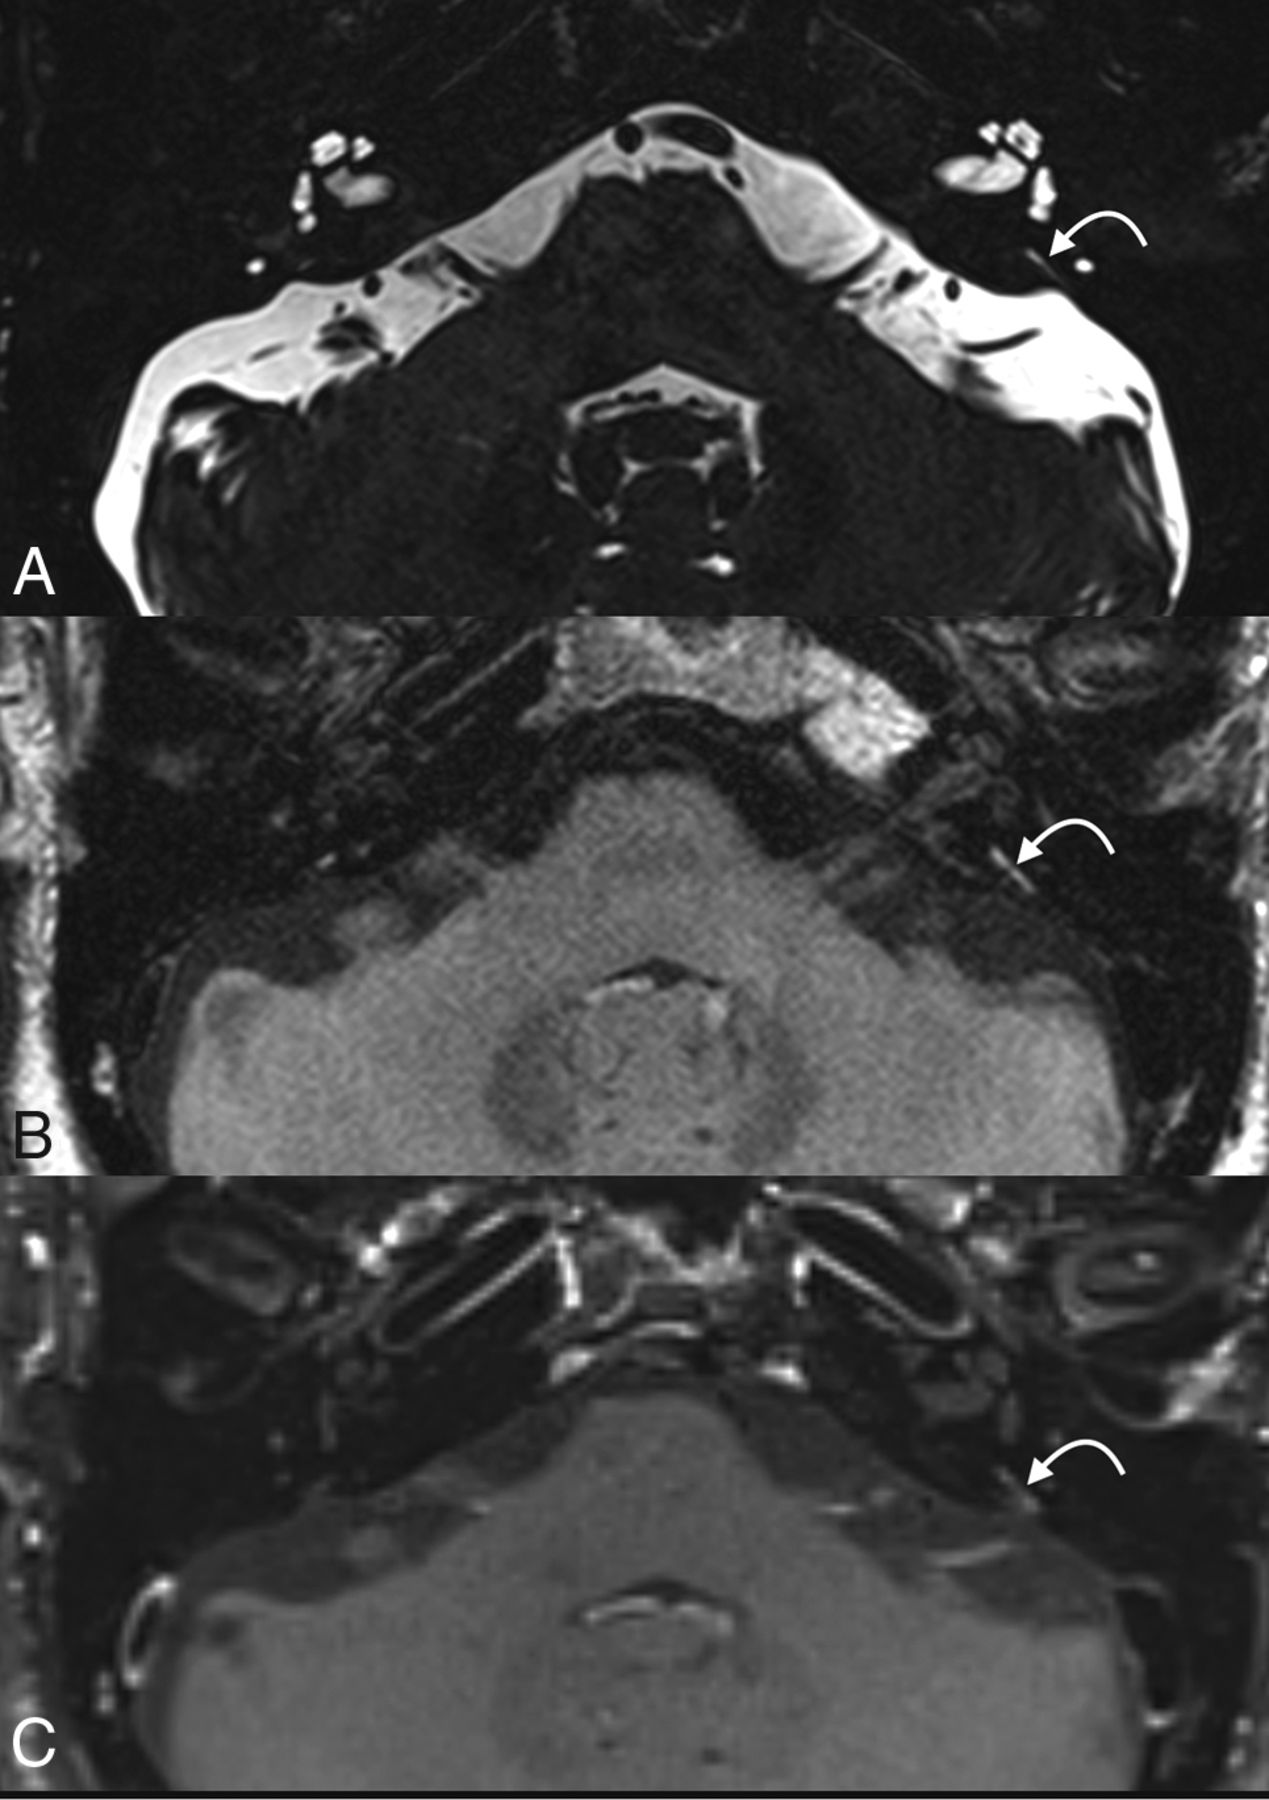
This study sought to characterize the prevalence of enhancement within the VA in healthy patients on high-resolution MR imaging. Our findings indicate that VA enhancement is an expected finding and is both more commonly observed and subjectively intense on postcontrast 3D-FLAIR sequences than on T1-FS sequences, as seen in Figure 1. The observed enhancement was present in patients with a normal-appearing VA on MR imaging. Only 1 VA was found to be enlarged on MR imaging, which did not demonstrate enhancement. For example, Figure 2 demonstrates a case of nonenhancing VA. Thus, unless other suspicious findings are present to raise concern for a pathologic process such as associated osseous abnormalities, endolymphatic duct or sac enlargement, or VA enlargement, the results indicate that enhancement of the VA should not be confused with pathology on MR imaging. Like all anatomic descriptions in radiology, this finding should serve as a foundation for many types of imaging interpretations. For example, if an examination is performed to assess leptomeningeal disease, isolated enhancement within the vestibular aqueduct should not be considered pathologic because we have shown that it frequently occurs in healthy patients. Thus, these findings can be used to prevent inaccurate interpretation of enhancement in the VA as a pathologic abnormality.

An example of VA enhancement. The VA is visible on thin-section 3D SPACE FSE T2 image (A), which demonstrates a normal-caliber aqueduct. Prominent enhancement is seen on postgad FLAIR image (B), while less prominent enhancement is seen on postgad T1-FS image (C). The curved arrow points to the vestibular aqueduct.

An example of a nonenhancing VA. The VA is faintly visible on axial postgad FLAIR (A) image but does not demonstrate enhancement. The structure cannot convincingly be seen on postgad T1-FS image (B). The curved arrow points to the vestibular aqueduct.
While CT is better at visualizing the osseous VA, multiple studies have demonstrated that CT is not necessary to exclude a pathologically enlarged VA. In 1 study, MR imaging had a 97% sensitivity in diagnosing an enlarged VA.4 Another study demonstrated that there is diagnostic agreement of 93% on CT and MR imaging if applying the Valvassori criterion, which determined that the VA is enlarged when measuring >1.5 mm at the midpoint.5 The advantages of using MR imaging include better visualization of the cochlear nerve and lack of radiation,4 especially valuable in the pediatric population to reduce exposure.
Although it is uncertain why enhancement within the VA was observed with such frequency, the most likely explanation is that the enhancement is related to normal vasculature within or immediately adjacent to the aqueduct. This hypothesis fits with what is known about the anatomy of the VA. An accessory canal, called the paravestibular canal, runs parallel to the VA, which usually contains 1 or 2 paravestibular veins.1,6 A micro-CT study by Nordström et al6 demonstrated the proximity of the VA to the vein of the VA. These form a rich vascular plexus containing the vein of the VA, which provides the main venous outflow of the vestibule, endolymphatic walls, and endolymphatic sac.1
FLAIR is an inversion recovery sequence that is heavily T2-weighted with nulled CSF signals and a component of mild T1-weighted contrast.7 Therefore, any enhancement on postcontrast T1-weighted images will also be demonstrated on postcontrast FLAIR imaging.7 Many studies have shown contrast-enhanced FLAIR images to be better at detecting enhancement in comparison with T1-weighted imaging, such as identification of inflammatory leptomeningeal disease,8 disruption of blood-CSF barrier,9 infectious meningitis,10 and so forth. A probable explanation for this phenomenon may be that postcontrast FLAIR is more sensitive to the T1-shortening agent in comparison with T1-weighted imaging.9 Additionally, suppression of the CSF signal on FLAIR postcontrast imaging could demonstrate better contrast of enhancement.11 Thus, the observations of this study—that contrast was more readily seen on FLAIR than T1-FS—fit with the known sensitivity of the postgad FLAIR sequences to detect subtle enhancement.
To our knowledge, there have been only a few studies on enhancement within the VA on MR imaging in the past. A 2001 study by Naganawa et al12 using a mixed cohort of patients with hearing loss and Menière disease and age-matched controls found that enhancement of the endolymphatic sac was seen in similar frequency among patients with Menière disease and age-matched controls, though it was noted in higher frequency in patients with sudden hearing loss. A 2003 study by Sugiura et al,13 however, found that the frequency of endolymphatic sac enhancement was similar among patients with hearing loss and control subjects. Our study has a much larger sample size and hence more statistical power.
Our study has a few limitations. First, this was a single-institution study, which may limit the generalizability of our results, particularly because differences in MR imaging sequences between institutions may affect the observed findings. Second, this was a retrospective, observational study that cannot provide definite information on cause-and-effect relationships. Further studies will be needed to evaluate any relationships between VA enhancement and pathology.
CONCLUSIONS
Enhancement within the VA is frequently present on high-resolution MR imaging and should be considered a normal finding unless other suspicious findings are present. The observed enhancement is more common and more intense on FLAIR images than on T1-FS sequences.
Footnotes
Disclosure forms provided by the authors are available with the full text and PDF of this article at www.ajnr.org.
References
- Received March 29, 2022.
- Accepted after revision June 28, 2022.
- © 2022 by American Journal of Neuroradiology


Jump to section
Related Articles
Cited By...
- No citing articles found.