
Abstract
BACKGROUND AND PURPOSE: BRAF and type 1 neurofibromatosis status are distinctive features in pediatric low-grade gliomas with prognostic and therapeutic implications. We hypothesized that DWI metrics obtained through volumetric ADC histogram analyses of pediatric low-grade gliomas at baseline would enable early detection of BRAF and type 1 neurofibromatosis status.
MATERIALS AND METHODS: We retrospectively evaluated 40 pediatric patients with histologically proved pilocytic astrocytoma (n = 33), ganglioglioma (n = 4), pleomorphic xanthoastrocytoma (n = 2), and diffuse astrocytoma grade 2 (n = 1). Apart from 1 patient with type 1 neurofibromatosis who had a biopsy, 11 patients with type 1 neurofibromatosis underwent conventional MR imaging to diagnose a low-grade tumor without a biopsy. BRAF molecular analysis was performed for patients without type 1 neurofibromatosis. Eleven patients presented with BRAF V600E-mutant, 20 had BRAF-KIAA rearrangement, and 8 had BRAF wild-type tumors. Imaging studies were reviewed for location, margins, hemorrhage or calcifications, cystic components, and contrast enhancement. Histogram analysis of tumoral diffusivity was performed.
RESULTS: Diffusion histogram metrics (mean, median, and 10th and 90th percentiles) but not kurtosis or skewness were different among pediatric low-grade glioma subgroups (P < .05). Diffusivity was lowest in BRAF V600E-mutant tumors (the 10th percentile reached an area under the curve of 0.9 on receiver operating characteristic analysis). There were significant differences between evaluated pediatric low-grade glioma margins and cystic components (P = .03 and P = .001, respectively). Well-defined margins were characteristic of BRAF-KIAA or wild-type BRAF rather than BRAF V600E-mutant or type 1 neurofibromatosis tumors. None of the type 1 neurofibromatosis tumors showed a cystic component.
CONCLUSIONS: Imaging features of pediatric low-grade gliomas, including quantitative diffusion metrics, may assist in predicting BRAF and type 1 neurofibromatosis status, suggesting a radiologic-genetic correlation, and might enable early genetic signature characterization.
ABBREVIATIONS:
- AUC
- area under the curve
- GG
- ganglioglioma
- MAPK
- mitogen-activated protein kinase pathway
- NF1
- type 1 neurofibromatosis
- pLGG
- pediatric low-grade glioma
- rADC
- relative ADC
- RAS
- rat sarcoma virus
- ROC
- receiver operating characteristic
Pediatric low-grade gliomas (pLGGs) are the most frequent brain tumors in children.1 pLGGs are defined as World Health Organization grade I or II malignancies and include a wide array of histologies, such as juvenile pilocytic astrocytoma, ganglioglioma (GG), dysembryoplastic neuroepithelial tumor, and pleomorphic xanthoastrocytoma.2 The components of treatment for pLGGs have historically been surgery, radiation, and multiagent chemotherapy. Surgical resection may be curative in the case of gross total resection. However, most children cannot undergo complete resection due to the location of the tumor. Ten-year progression-free survival drops significantly if a radiologically visible residual tumor is evident.3 In such patients, adjuvant focal radiation therapy was performed in the past. However, due to the long-term adverse effects of radiation, adjuvant chemotherapy has been the main treatment technique for patients with pLGG.
BRAF is a serine/threonine-protein kinase that has a key role in growth signal transduction. In the past decade, emerging molecular data have suggested that in pLGGs, there is near-universal up-regulation of the rat sarcoma virus (RAS)-mitogen-activated protein kinase pathway (MAPK),4 most commonly due to somatic alterations involving the BRAF proto-oncogene or germline type 1 neurofibromatosis (NF1) alterations.5 The 2 major BRAF gene alterations in pLGG are BRAF rearrangement (duplication of the BRAF oncogene, followed by its insertion into 1 of several fusion targets, most often the KIAA1549 gene) and BRAF V600E point mutation (V600E).4 These molecular alterations in the BRAF gene lead to constitutive activation of the kinase and downstream signaling pathways that drive uncontrolled cell proliferation and tumorigenesis.
NF1 is a common autosomal dominant disorder that results in the most frequent tumor predisposition syndrome. Neurofibromin, the protein product of the NF1 gene that is mutated in patients with NF1, has been shown to function as a tumor-suppressor gene, acting as a negative regulator of RAS. Loss of neurofibromin increases RAS activity and induces downstream activity of the MAPK pathway as well as the PI3K-Akt-mammalian target of rapamycin (mTOR) pathway.5 Approximately 15% of children with NF1 develop low-grade optic pathway gliomas. Therefore, optic pathway gliomas in these patients are primarily diagnosed via germline NF1 alteration and imaging rather than a biopsy.6
Exploring the BRAF status of pLGGs improves risk-stratification and tailored targeted therapies in patients with residual disease in whom additional therapy is needed.7 Whereas patients with BRAF fusion and NF1 have a favorable outcome, those with the BRAF V600E mutation, particularly associated with cyclin-dependent kinase inhibitor 2A (CDNK2A) deletion, are at increased risk of progression with shorter progression-free survival rates and worse response to chemotherapy.7,8 Furthermore, molecularly targeted therapies have been shown to be effective in patients with residual pLGGs; for instance, type I BRAF inhibitors for BRAF V600E pLGG and mitogen-activated protein kinase inhibitors for pLGGs driven by NF1, BRAF-KIAA rearrangement, or BRAF V600E mutation. Most important, type I BRAF inhibitors have been shown to result in paradoxical activation and accelerating growth of pLGGs driven by the BRAF-KIAA fusion.9 Therefore, identifying the exact molecular alteration is crucial.
Radiogenomic techniques, which have emerged as valuable imaging tools to characterize brain tumors noninvasively, have a pivotal role in making treatment decisions in patients with pLGGs. Recently, a few studies have described imaging features of pLGGs in correlation with their BRAF status.10,11 Ramaglia et al11 found lower ADC values in V600E-mutant pLGGs, though no morphologic imaging characteristics were found to have discriminative power from wild-type BRAF. More advanced ADC metrics (such as histogram analysis) found to be of diagnostic value in pediatric tumors12,13 have not been evaluated in the genetic characterization of pLGG (BRAF or NF1 status). We hypothesized that ADC metrics obtained through volumetric ADC histogram analyses of pLGGs at baseline would enable early detection of BRAF and NF1 status.
MATERIALS AND METHODS
The institutional review board of the Sheba Medical Center approved this retrospective study.
Study Design and Population
Patients with pLGG, diagnosed and treated in our tertiary pediatric neuro-oncology clinics, were included. Inclusion criteria were the following: 1) available baseline presurgical MR imaging, and 2) biopsy and characteristics of BRAF status or a diagnosis of germling NF1. Exclusion criteria included a markedly degraded MR imaging study, pure optic nerve involvement, and spinal location.
Brain MR Imaging
MR imaging studies were performed in multiple centers on 1.5T or 3T magnets across various vendors. All patients had routine clinical MR imaging scans, including precontrast and postcontrast T1-weighted images, T2-FLAIR, and T2-weighted images. These sequences were performed with variable section thickness ranging from 1 to 5 mm. Heme-sensitive sequences, such as T2* gradient recalled-echo or SWI, were available in 33 patients. On each scanner, the DWI acquisition consisted of a diffusion-sensitized axial 2D spin-echo sequence with an EPI readout, with 2 b values of 0 and 1000 s/mm2. Section thickness ranged from 3 to 4 mm, with interslice gaps of 0–1 mm.
Image Analysis
We analyzed the following tumoral morphologic imaging features: the presence of well-defined margins, a cystic component, contrast enhancement, and hemorrhagic components or calcifications, which were evaluated only in cases with available heme-sensitive MR imaging sequences (T2* or SWI) or CT scans. These were recorded as binary variables. As for location, classification was according to the epicenter of the tumor (cerebral hemispheres, cerebellum, brainstem, or diencephalon). All images were assessed in consensus by 2 board-certified neuroradiologists (J.B. and S.S.) with 3 and 6 years of experience, respectively, blinded to the pathologic diagnosis.
DWI Measurements
Tumor segmentation was performed by a board-certified radiologist (A.K.) and was confirmed in consensus by a board-certified neuroradiologist with 6 years of neuroradiology experience (S.S.) using 3D Slicer (Version 4.11.2; http://www.slicer.org14). Semiautomated tumor segmentation was performed on T2-FLAIR images in all respective MR imaging sections on noncystic, noncalcified, or hemorrhagic tumor areas using the level tracing effect tool. All ROIs were then copied to the automatically coregistered corresponding ADC maps via 3D Slicer. The transposed volumetric ROI was evaluated and manually corrected on the ADC maps, if necessary, by A.K. and S.S. in consensus. DWI metrics and histogram analysis of the selected volumetric whole-lesion ROIs were performed using the module SlicerRadiomics extension.15 For normalization of ADC values, a circular ROI was drawn on the right eye and left thalamus. Relative ADC (rADC) ratios were calculated by dividing each ADC metric of the lesion by the mean ADC value of the right eye and the normal-appearing thalamus. This step was performed to adjust ADC values across MR imaging vendors and magnetic field strengths.
Statistical Analysis
Descriptive statistics included mean and SD of continuous parameters; in the case of categoric factors, number and percentage distribution were used. The χ2 test was used to analyze the differences in the categoric parameters and qualitative features among the various molecular tumor groups. DWI histogram analysis included 10th and 90th percentiles, mean, median, skewness, and kurtosis. The Kruskal-Wallis test with the post hoc Dunn-Bonferroni method was used to compare diffusivity metrics among genetic subgroups. P values have been adjusted by the Bonferroni correction for multiple comparisons. Receiver operating characteristic (ROC) curve analysis was performed, and the respective area under the curve (AUC) was calculated to assess the accuracy of ADC histogram features in differentiating various pLGG subgroups. The ROC curve plots the true-positive rate against the false-positive rate at various threshold settings. The DeLong test was used for the comparison of various AUCs. A 2-tailed P <.05 was considered statistically significant. Analyses were performed with SPSS (Version 27.0, 2021; IBM).
RESULTS
Study Population
The study cohort (Fig 1) included 51 patients in whom histologically proved tumors included pilocytic astrocytoma (n = 33), GG (n = 4), pleomorphic xanthoastrocytoma (n = 2), and diffuse astrocytoma grade II (n = 1). Of patients with NF1, 11 underwent imaging with a diagnosis of a low-grade tumor without a biopsy. One patient with NF1 underwent a biopsy with a histology of GG. BRAF molecular analysis was performed for patients without NF1. Eleven patients presented with the BRAF V600E mutation; 20 patients had BRAF-KIAA rearrangement, and 8 had BRAF wild-type tumors. pLGG was diagnosed at a younger age in patients with BRAF-KIAA rearrangement and NF1 groups than in BRAF V600E-mutant or wild-type BRAF groups (P = .03). The major demographic data are presented in Table 1.

Study flow chart. Bx indicates biopsy.
Major clinical characteristics and tumor histology in various pLGG subgroups
Morphologic MR Imaging Findings
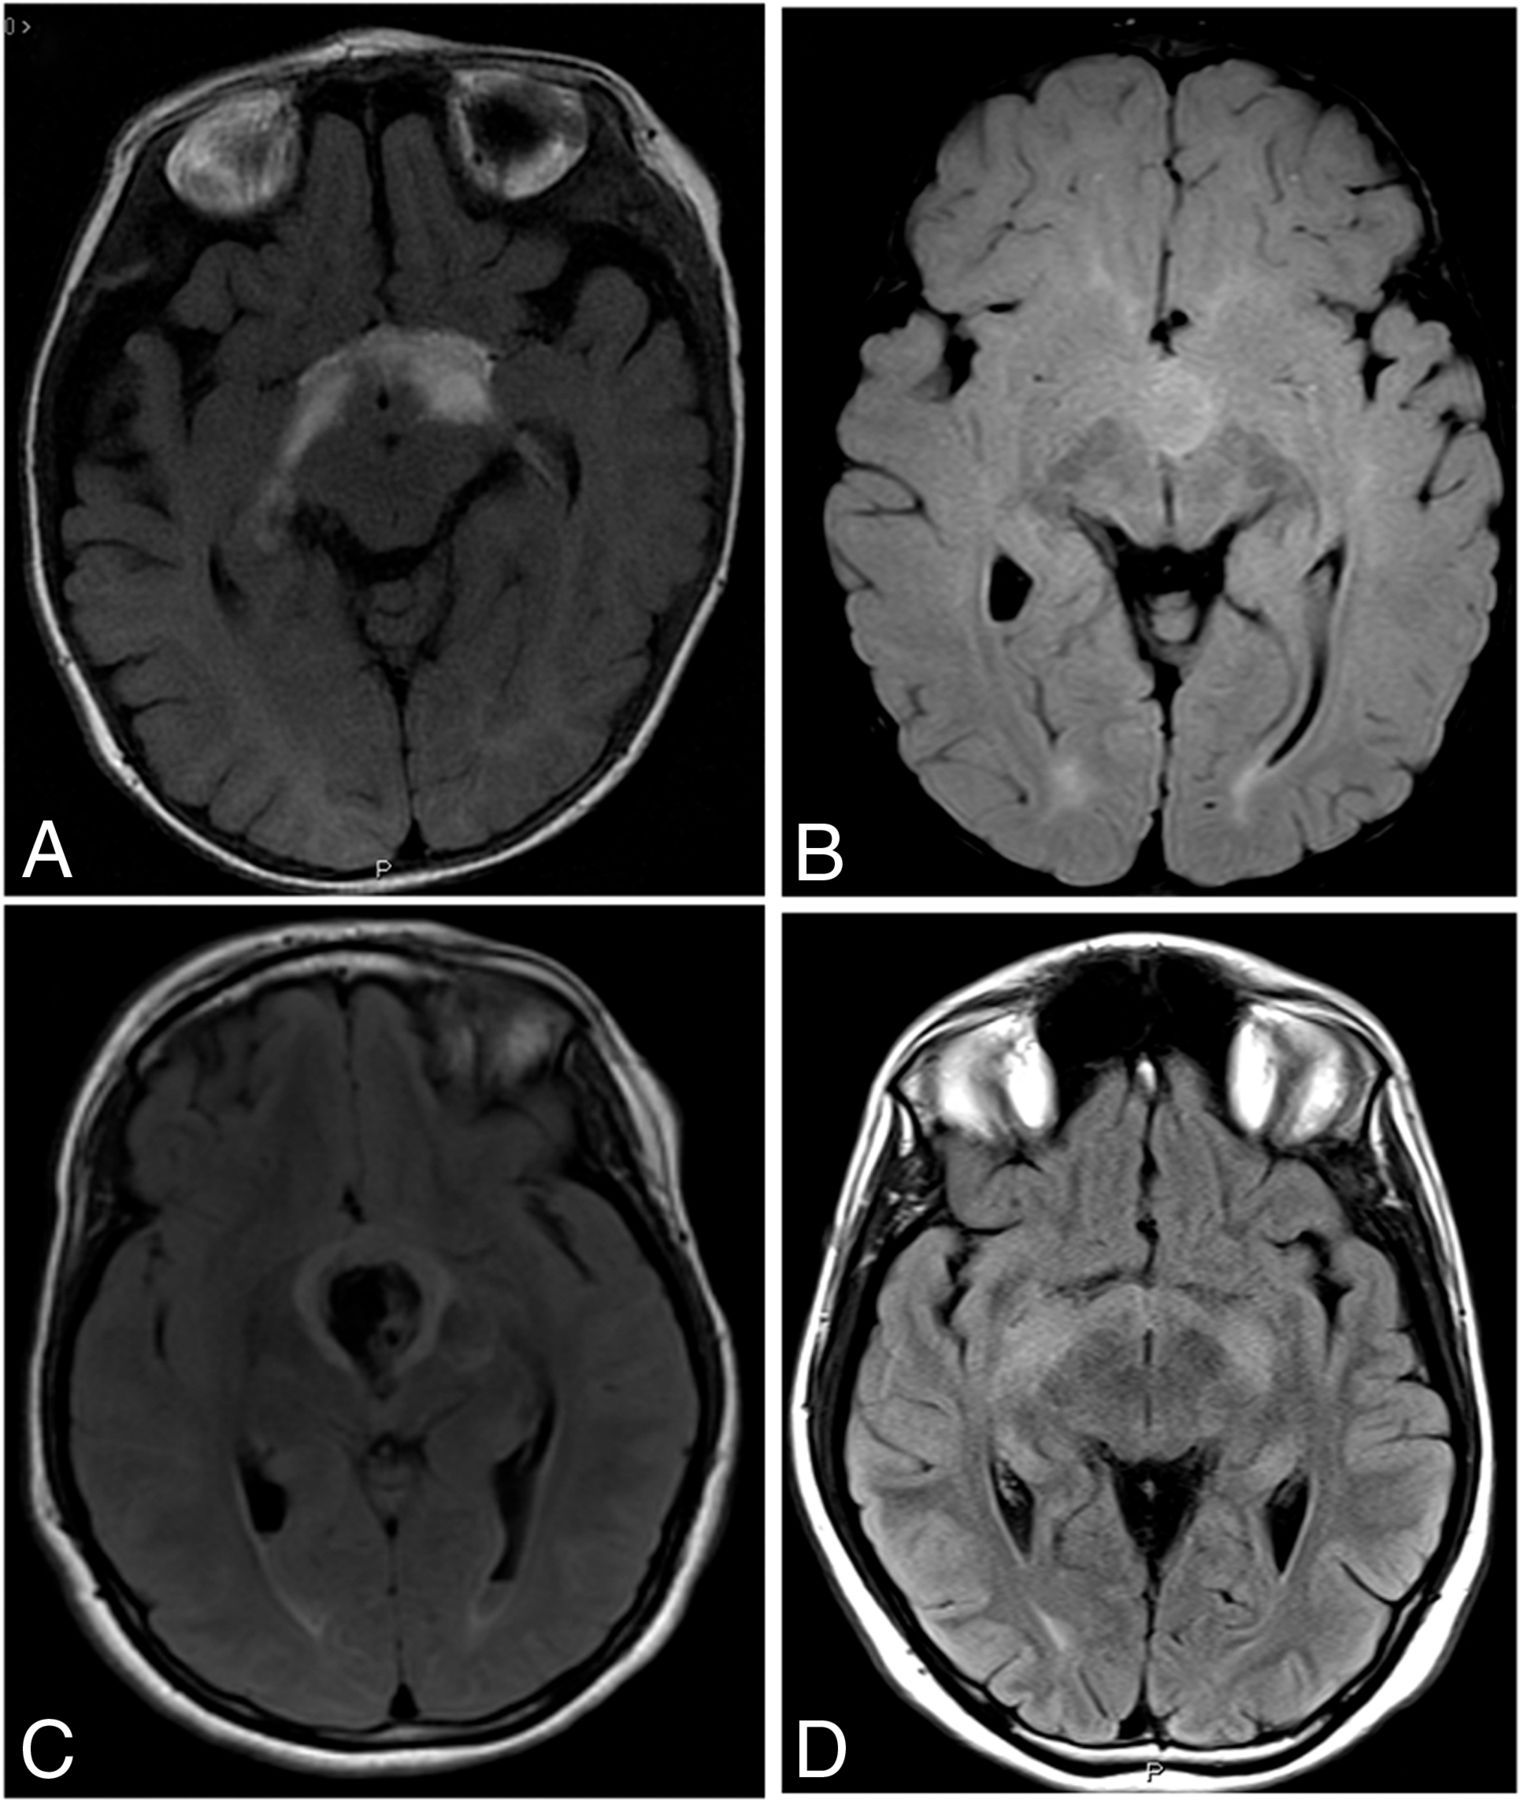
Ill-defined borders were more characteristic of BRAF V600E-mutant tumors rather than in BRAF-KIAA rearrangement or wild-type BRAF pLGGs. Examples of MR images of pLGGs are shown in Fig 2. Hemorrhagic components or calcifications were seen in wild-type BRAF tumors compared with BRAF alterations of NF1 tumors. Lack of a cystic component characterized NF1 tumors compared with BRAF alteration of wild-type BRAF tumors. No significant differences were found among study groups in terms of tumor location. A summary of the morphological imaging findings is presented in Table 2.

Representative T2-FLAIR images of pLGGs of various molecular subgroups. A, A 5-month-old boy with a diencephalic pLGG infiltrating the optic tracts (BRAF-mutant). B, A 15-year-old boy with a well-defined diencephalic pLGG (BRAF-KIAA rearrangement), C, A 20-year-old woman with well-defined diencephalic pLGG (wild-type BRAF), associated with a large central hemorrhagic area. D, A 16-year-old boy with a typical diencephalic glioma infiltrating the optic tracts (NF1).
Diffusion Metrics
Significant differences were found in evaluated diffusion metrics between pLGG subgroups, except for kurtosis and skewness (Online Supplemental Data). These results were similar when ADC measurements were normalized to the thalamus or the eye globe. For most diffusivity metrics, rADC measurements were lower in BRAF V600E-mutant tumors than in the BRAF-KIAA rearrangement subgroup (representative metrics are presented in Fig 3). rADCmean and rADCmedian (relative to the thalamus) were significantly lower in NF1 tumors compared with BRAF-KIAA rearrangement or wild-type BRAF subgroups (P < .001). Differences in diffusion histogram metrics among pLGG subgroups were also significant when excluding NF1 tumors (Online Supplemental Data).

Boxplots comparing rADC10 and rADCmean, relative to the mean ADC values of the right thalamus (A and B, respectively) or the right eye globe (C and D, respectively). Group differences were significant (P < .001, Kruskal-Wallis test). Significant pair-wise differences are indicated in the figure (Dunn-Bonferroni post hoc analysis, Double asterisks indicate P < .005).
Morphologic MR imaging characteristics
According to ROC curve analyses, the rADC10 values had the highest AUC values for differentiating BRAF V600E-mutant from the BRAF-KIAA rearrangement group (AUC = 0.895 and 0.905, relative to the thalamus or eye globe, respectively). rADC10 values also had high diagnostic performances for differentiating BRAF V600E-mutant from BRAF-KIAA rearrangement or wild-type BRAF (AUC = 0.873 and 0.864, relative to the thalamus or eye globe, respectively). However, the high performance of rADC10 did not reach statistical significance compared with other diffusivity metrics. For differentiating NF1 tumors from wild-type or altered BRAF, the performance of diffusivity metrics was relatively low, except for rADCmin (AUC = 0.803 and 0.746, relative to the thalamus or eye globe, respectively). Overall, diagnostic performances were similar when comparing the normalization of ADC values with that of the thalamus or eye globe. In NF1 tumors, except for rADCmin, there was higher discriminative power for normalization to the globe over the thalamus (P < .001–.02), even though absolute AUC values were relatively low. The diagnostic performance of rADCmin, rADC10, rADC90, rADCmean, and rADCmedian for differentiating various pLGG subgroups is summarized in the Online Supplemental Data.
DISCUSSION
In the past decade, there has been increasing evidence of the importance of BRAF status, which has major therapeutic and prognostic implications in pLGGs, especially if these tumors are unresectable.7 Currently, most non-NF1 pLGGs undergo surgical biopsy for genetic analysis, even if curative resection is not possible. Our results suggest that in pLGGs, morphologic MR imaging features show significant differences according to BRAF and NF1 status, which might improve the early prediction of the genetic alterations of pLGGs. Quantitative diffusion metrics from cumulative ADC histograms based on the T2-FLAIR imaging abnormalities were found to be promising for differentiating pLGG subgroups. However, other parameters of histogram distribution, particularly kurtosis and skewness, have limited diagnostic value.
The ill-defined border of the pLGG, radiographically suggesting infiltration, was found in our cohort to be more characteristic for BRAF V600E-mutant pLGGs (10/11) compared with wild-type BRAF (5/13) or BRAF-KIAA rearrangement (11/20). Ho et al10 have described peritumoral T2 abnormality, suggesting infiltration in half the BRAF V600E-mutant pLGGs compared with a minority (∼8%) of wild-type BRAF tumors. Most interesting, such infiltration is a well-known feature of NF1 tumors, also found in our cohort (10/12). In our cohort, hemorrhagic components or calcifications were characteristic of wild-type BRAF pLGG over other BRAF alterations or NF1 tumors.
Nevertheless, there is usually an overlap of qualitative imaging characteristics, limiting their use in defining the pLGG subgroup signature. Studies describing quantitative imaging features differentiating pLGG molecular subgroups are even more sparse than descriptive imaging studies. To our knowledge, there have been only a limited number of reports regarding genetic profiling of pLGG using DWI and no literature reports investigating the usefulness of the ADC histogram for such analysis. In our study, BRAF V600E-mutant pLGGs showed decreased diffusivity on various diffusion histogram metrics (ADC10, ADC90, mean and median ADC values) compared with BRAF-KIAA rearrangement pLGGs. Similar results were also reported by Ramaglia et al11 for BRAF V600E-mutant pLGG, compared with wild-type BRAF, though BRAF-KIAA rearrangement or NF1 pLGG were not included in their study.
In a small case series, Ishi et al16 described a lower T2 signal and a larger T2/contrast-enhanced T1 mismatch to be more suggestive of BRAF V600E-mutation in optic pathway gliomas. Recently, Wagner et al described using a machine learning scheme to differentiate pLGG genetics subgroups according to their T2-FLAIR features.17 Although machine learning–based approaches might detect differences in neuroimaging data that might not be identified with conventional approaches, such as multiple T2-FLAIR features, traditional statistical approaches, such as used in the current study, might improve our understanding of the different radiologic-pathologic correlations in various pLGGs. Although isocitrate dehydrogenase (IDH) mutations are rare among pLGGs,18 diffusion metrics were also found to assist in differentiating IDH status in adult LGGs.19,20 Most ADC percentiles were found to be lower in IDH-negative compared with IDH-mutated gliomas.
DWI reflects the free motion of water molecules in biologic tissue.21 Highly cellular tumors, ie, with a high nuclear-to-cytoplasmic ratio, typically show diffusion restriction with decreased ADC values.22 Ho et al10 have described a distinctive histologic pattern in BRAF V600E-mutant pLGG of a monophasic dense, compact architecture resembling the compact, fiber-rich regions previously described in pilocytic astrocytomas, which might explain the decreased diffusivity found in these tumors in our cohort compared with wild-type BRAF pLGG. For ADC measurements, most studies used ROI analysis to evaluate brain lesions. Such analysis is based on the representative part of the lesion.23,24 However, selecting a representative location is subjective and may be difficult, especially when the lesion is heterogeneous and includes atypical imaging features. ADC histogram analysis was found to be useful for grading gliomas and predicting the treatment response and progression-free survival rates in patients with high-grade gliomas.25-27 Given that histogram analysis includes an entire lesion, it may reveal the heterogeneity of lesions and thus ensure more accurate tissue characteristics.
NF1 is a tumor-predisposition genetic disorder, usually diagnosed using a clinical phenotype indicative of a germline NF1 mutation.6 The most common CNS tumors in NF1 are low-grade gliomas, with the optic pathway glioma being the hallmark lesion. Surgery is not the first treatment choice in NF1-associated gliomas, which are commonly nonresectable and have a relatively benign course. However, infiltrative optic pathway pLGG, typical of patients with NF1, might have a BRAF alteration rather than an NF1 mutation, a difference that has major clinical consequences.28 A biopsy is often performed in such cases, especially if NF1 cannot be diagnosed clinically or genetically. Our results might also assist in identifying the imaging signature of NF1 pLGG relative to other BRAF-altered gliomas.
The reproducibility of lesional ADC measurements over various field strengths, different vendors, and acquisition parameters is critical for the applicability of our results. Multiple in vivo studies have reported near-identical ADC measurements on 1.5T and 3T scanners.29,30 However, other phantoms and in vivo studies have demonstrated a significant ADC difference among different magnet fields.31,32 Therefore, Sasaki et al31 have suggested using rADC values because they might be more suitable than absolute ADC values for evaluating diffusion abnormalities acquired in different scanners and field strengths. ROIs drawn on the normal-appearing white matter33 or gray matter11 are commonly used for ADC normalization. We have calculated the rADC values normalized to the normal-appearing thalamus and the eye globe to minimize the differences among absolute ADC values across various platforms. Both references have shown similar reproducible and discriminative results among various pLGG subgroups. Such rADCs are robust across MR imaging vendors and platforms and may be considered reliable.11,34 The ADC histogram analysis technique used in the current study is a promising method that can be used on clinically acquired diffusion MR imaging data for subsequent analysis, allowing comparison at different institutions and use in multicenter clinical trials.
There are several limitations to our study. First, our study was a retrospective investigation of a relatively small patient cohort. More pLGGs will be required to strengthen the statistical power and generalize our results in future studies. Due to the small cohort, obtaining ADC thresholds from ROC-AUC, which can be used in clinical settings, is limited. Second, accurately defining the imaging borders of infiltrative lesions is suboptimal, with relatively high interobserver variability. Given the large volumetric data included in the histogram analysis of an entire lesion, the nonperfect delineation of the lesion boundaries is relatively acceptable compared with ROI analysis. Last, tumor delineation was performed on T2-FLAIR images, and coregistration of T2-FLAIR imaging with the ADC map was required in our study. Although the tumor was carefully delineated, there is still the possibility of misregistration and the inclusion of erroneous ADC values at the tumor boundaries.
In the current study, diffusion metrics have improved radiologic-genetic correlation in pLGGs. Such tumoral quantitative features have the potential for better characterizing tumor structure and evaluating early treatment-related changes. Diffusion metrics have been shown to correlate and even predict the response to radiation or biologic treatment in high-grade gliomas.35,36 Moreover, Poussaint et al37 described a significant correlation between diffusion metrics and survival in patients with diffuse intrinsic pontine gliomas. In the current study, due to the small number of patients and heterogenicity of treatment protocols, such correlation between diffusion metrics and response to treatment could not be assessed.
CONCLUSIONS
Our results suggest that ADC histogram analysis based on an entire pLGG could help to discriminate various pLGG genetic subgroups, thus expanding and refining the correlation between clinically acquired imaging, including DWI, and the pLGG genetic signature. Such radiologic-genetic correlation has a critical role in the early detection of molecular subgroups and early clinical stratification of children with pLGGs.
Footnotes
Disclosure forms provided by the authors are available with the full text and PDF of this article at www.ajnr.org.
References
- Received February 28, 2022.
- Accepted after revision June 28, 2022.
- © 2022 by American Journal of Neuroradiology


