
Abstract
BACKGROUND AND PURPOSE: Chondrosarcoma and synovial chondromatosis of the temporomandibular joint share overlapping clinical and histopathologic features. We aimed to identify CT and MR imaging features to differentiate chondrosarcoma from synovial chondromatosis of the temporomandibular joint.
MATERIALS AND METHODS: The CT and MR images of 12 and 35 patients with histopathologically confirmed chondrosarcoma and synovial chondromatosis of the temporomandibular joint, respectively, were retrospectively reviewed. Imaging features including lesion size, center, enhancement, destruction/sclerosis of surrounding bone, infiltration into the tendon of the lateral pterygoid muscle, calcification, periosteal reaction, and osteophyte formation were assessed. A comparison between chondrosarcoma and synovial chondromatosis was performed with a Student t test for quantitative variables and the Fisher exact test or linear-by-linear association test for qualitative variables. Receiver operating characteristic analysis was performed to determine the diagnostic performance for differentiation of chondrosarcoma and synovial chondromatosis based on a composite score obtained by assigning 1 point for each of 9 imaging features.
RESULTS: High-risk imaging features for chondrosarcoma were the following: lesion centered on the mandibular condyle, destruction of the mandibular condyle, no destruction/sclerosis of the articular eminence/glenoid fossa, infiltration into the tendon of the lateral pterygoid muscle, absent or stippled calcification, periosteal reaction, internal enhancement, and size of ≥30.5 mm. The best cutoff value to discriminate chondrosarcoma from synovial chondromatosis was the presence of any 4 of these high-risk imaging features, with an area under the curve of 0.986 and an accuracy of 95.8%.
CONCLUSIONS: CT and MR imaging features can distinguish chondrosarcoma from synovial chondromatosis of the temporomandibular joint with improved diagnostic performance when a subcombination of 9 imaging features is used.
ABBREVIATIONS:
- AUC
- area under the curve
- CBCT
- conebeam CT
- CS
- chondrosarcoma
- LPM
- lateral pterygoid muscle
- MDCT
- multidetector row CT
- NPV
- negative predictive value
- PPV
- positive predictive value
- ROC
- receiver operating characteristic
- SC
- synovial chondromatosis
- TMJ
- temporomandibular joint
Chondrosarcoma (CS) and synovial chondromatosis (SC) are tumor or tumorlike lesions of the temporomandibular joint (TMJ) that are characterized by cartilaginous neoplasia or metaplasia with variable calcification associated with a mass that causes bony changes of the mandibular condyle and/or the articular eminence/glenoid fossa complex.1⇓⇓⇓⇓⇓-7 CS is a malignant neoplasm generating a variably calcified cartilage matrix, which accounts for ∼20%–27% of all primary malignant bone tumors.1,8 CS usually arises in the pelvis, humerus, and/or femur, with only 12% originating in the head and neck region.2,8 Even in the head and neck region, CS is rare in the TMJ, with only about 49 cases reported through 2020.2 SC is a benign tumorlike arthropathy characterized by formation of nodular cartilage in the synovial joints.3,5 These cartilaginous nodules can detach from the synovium and produce intra-articular loose bodies6 that are nourished by synovial fluid and can be calcified.4 SC predominantly manifests in the knee, hip, and elbow and is uncommon in the TMJ.5 Approximately 400 cases of TMJ involvement have been reported through 2021.7
Differentiating CS from SC is essential because they require different therapeutic approaches. The criterion standard for CS treatment is surgical resection.9 Resection for CS must be as wide as possible, and a large healthy tissue margin of ≥2 cm seems to positively affect prognosis.9,10 In contrast, treatment of SC, if indicated, generally includes open joint surgery to remove all affected synovium and loose bodies but usually conserves the mandibular condyle. If the lesion causes damage to the mandibular condyle, then high condylectomy can be considered.11
Clinicians, radiologists, and even pathologists may have difficulty differentiating CS from SC of the TMJ.12⇓⇓-15 Presenting symptoms such as pain, trismus, and/or swelling are similar,2,3 and their imaging features have not been systematically compared in previous studies. Moreover, because low-grade CS and SC share some histopathologic features such as binucleated chondrocytes and considerable cellularity, problems have been raised with a definitive histopathologic diagnosis.16⇓⇓-19 Histopathologic discrimination between CS and SC is especially difficult in cases of secondary CS, which develops from a pre-existing cartilaginous tumorlike arthropathy such as SC, compared with primary CS, which arises de novo.14 Thus, differentiation between CS and SC based on imaging is very important. Recently, certain imaging features of CS, such as outward growth from the mandibular condyle and infiltration into the tendon of the lateral pterygoid muscle (LPM) attachment, were reported, and the possibility of differentiation from other lesions of the TMJ was suggested.2 Comparisons using consistent imaging parameters for CS and SC of the TMJ have not, however, been reported.
The aim of this study was to assess the diagnostic performance of a series of specific CT and MR imaging parameters for differentiation of CS from SC of the TMJ.
MATERIALS AND METHODS
This retrospective study was approved by the institutional review board of Seoul National University Dental Hospital (ERI19009), and informed consent was waived.
The histopathologic database of our institution between January 2001 and October 2020 was searched for patients who had a proved diagnosis of CS or SC of the TMJ. Patients with secondary SC due to degenerative change were excluded.
Clinical information was obtained from the electronic medical record. Demographic characteristics, affected side, and chief symptom were analyzed.
Image Acquisition
For all patients with CS, both multidetector row CT (MDCT) and MR imaging were performed. For patients with SC, MDCT, conebeam CT (CBCT), and MR imaging were performed on 27, 13, and 24 patients, respectively. All patients with SC underwent either an MDCT or MR imaging examination for soft-tissue evaluation and MDCT or CBCT examination for hard-tissue evaluation. All patients with CS and 12 patients with SC underwent either MDCT and/or MR imaging with contrast media.
Contrast-enhanced CT was performed using an MDCT scanner (Somatom Sensation 10; Siemens) from the orbit to the bottom of the sternum. The scan parameters used were 150 mAs, 120 kV, and 1- to 2-mm section collimation. After scanning the scout image, contrast media (1.5 mL/kg, iopromide, Ultravist 370; Bayer HealthCare Pharmaceuticals) was injected intravenously at a rate of 2.0–3.0 mL/s. A 3T MR imaging system (Magnetom Skyra; Siemens) and a 1.5T MR imaging system (Signa HDxt; GE Healthcare) were used on 20 and 16 of 47 patients, respectively. Thirty-two- and 16-channel phased array coils were used for the 3T and 1.5T scanners, respectively. Section thickness of 4–6 mm, 320 × 240 or 320 × 192 matrix size, and 19 × 19 or 22 × 22 cm FOV were used. Axial and coronal non-fat-suppressed or fat-suppressed T2-weighted fast spin-echo (TR, 3000–5600 ms; TE, 60–110 ms); axial and coronal non-fat-suppressed T1-weighted spin-echo (TR, 500–600 ms; TE, 10–15 ms); axial, coronal, and sagittal gadolinium-enhanced fat-suppressed T1-weighted spin-echo (TR, 500–700 ms; TE, 9–15 ms) images were acquired. For contrast-enhanced fat-suppressed T1-weighted sequences, a contrast agent (0.1 mmol/kg, gadopentetate dimeglumine, Magnevist; Schering) was injected intravenously via a power injector with a flow rate of 1.5 mL/s. CBCT imaging was performed using a DINNOVA3 scanner (HDXWILL), with an FOV of 20 × 19 cm for men and 20 × 14 cm for women, 9 mAs, 100 kV(peak), and isotropic voxels of 0.3 mm.
Analysis of Imaging Features
Imaging features assessed were lesion center, destruction or sclerosis of the mandibular condyle or articular eminence/glenoid fossa, infiltration into the tendon of the LPM in the pterygoid fovea, calcification, periosteal reaction, presence or absence of osteophytes, enhancement pattern, and lesion size. Each imaging feature was reviewed through a multiplanar assessment of axial, coronal, and sagittal images.
The lesion center was assessed as mandibular condyle or joint space origin of the lesion on MR imaging and/or MDCT images. The presence of bone destruction or sclerosis was assessed on CBCT or MDCT images. Infiltration into the tendon of the LPM was defined as replacement of the LPM attachment by a mass in the pterygoid fovea (Fig 1) and was assessed as present or absent. According to the World Health Organization classification scheme and previous studies,7,20,21 the pattern of calcification was classified on MDCT or CBCT images as absence of calcification, stippled type (punctate) (Figs 2 and 3), flocculent type (irregularly shaped), ring-and-arc type (curvilinear, comma-shaped, or annular) with or without a stippled and flocculent type (Fig 4), or popcorn type (amorphous calcifications often with a ring-and-arc type). The presence of a periosteal reaction and/or osteophytes of the mandibular condyle was assessed on MDCT or CBCT images. “Osteophyte” was defined as a beaklike exophytic structure emanating from the cortical surface of the mandibular condyle. The enhancement pattern was assessed as peripheral enhancement or internal enhancement, including septalike, heterogeneous solid, and focal solid. The presence of internal enhancement was evaluated only on contrast-enhanced MDCT or MR images. Lesion size on MR or MDCT images was quantitatively assessed as the longest diameter (X) on an axial plane, the longest diameter (Y) perpendicular to the longest diameter on the axial plane, and the longest diameter (Z) in the craniocaudal direction on a coronal or sagittal plane. The lesion size was calculated by dividing the sum of X, Y, and Z by 3. To evaluate whether the shape of the lesion was a long saddle, analogous to the shape of the synovium, which is the origin of SC, or a sphere, analogous to the shape of the mandibular condyle, which is the origin of most of CSs, we calculated the ratio of X to Z (X/Z).

Schematic drawings of the degree of infiltration into the tendon of the LPM by a mass in the pterygoid fovea. Complete and partial infiltration is shown in A and B, respectively. For such cases, a score of 1 is assigned. No infiltration with an intact LPM attachment is shown in C, in which case a score of zero is assigned. MC indicates mandibular condyle.

CS of the right TMJ in 54-year-old woman. Axial MDCT with bone and soft-tissue windows (A and B). T2-weighted MR (C) and contrast-enhanced T1-weighted MR (D) images demonstrate a large mass infiltrating the tendon of the lateral pterygoid muscle (asterisk) in the pterygoid fovea and show septalike internal enhancement. Stippled calcification and severe destruction of the mandibular condyle with a spiculate periosteal reaction are revealed (A and B). Note the lesion center on the mandibular condyle. Sagittal MDCT (E) and T2-weighted MR images (F) show the eroded mandibular condyle and the intact articular eminence. Note the disc (arrow) located between them. This mass showed all 9 high-risk imaging features for CS and received a composite score of 9.

CS of the left TMJ in 44-year-old woman. Axial MDCT (A), fat-suppressed T2-weighted MR (B), and contrast-enhanced T1-weighted MR (C) images reveal a mass surrounding the mandibular condyle. Sagittal MDCT (D) and contrast-enhanced T1-weighted MR images (E) demonstrate the mass center in the joint space. Lesion centered on the superior joint space (arrows), destruction and sclerosis of the articular eminence/glenoid fossa, absence of periosteal reaction, and the relatively small lesion size favor SC. On the other hand, destruction of the mandibular condyle, infiltration into the tendon (arrowhead) of the lateral pterygoid muscle (asterisk), stippled calcification, and internal enhancement favor CS. A histopathologic examination after mass resection resulted in a diagnosis of CS. This TMJ mass revealed 4 high-risk imaging features and a composite score of 4. It was not easy to differentiate CS from SC by imaging features.

SC of the left TMJ in 52-year-old man. Axial MDCT (A and B) and fat-suppressed T2-weighted MR images (C) show a mass surrounding and eroding the mandibular condyle. Sagittal MDCT (D) and contrast-enhanced T1-weighted MR images (E) reveal the mass to be centered on the joint space. Ring-and-arc calcification, intact attachment of tendon (blue arrowheads) of the lateral pterygoid muscle (red asterisk), lesion center on the joint space, and a relatively small lesion size favor an imaging diagnosis of SC. The result of a preoperative incisional biopsy was CS, but the final histopathologic diagnosis was changed to SC after mass resection. This TMJ mass showed 3 high-risk imaging features and received a composite score of 3.
Two oral and maxillofacial radiologists with 20 and 15 years of experience, respectively, analyzed all CT and MR imaging scans for imaging analyses while blinded to the histopathologic and clinical information. In addition, they were blinded to the purpose of this study as well. In cases of disagreement between the 2 radiologists, discrepancies were resolved by consensus.
Statistical Analysis
Interobserver agreement was assessed by calculation of the Cohen κ coefficient for qualitative variables and the intraclass correlation coefficient for quantitative variables. The strength of the Cohen κ coefficient was considered as follows: >0.80, almost perfect reliability; and 0.60–0.80, substantial reliability.22 The strength of the intraclass correlation coefficient was considered as follows: >0.90, excellent reliability; and 0.75–0.90, good reliability.23 Comparisons of each clinical and imaging feature between the CS and SC groups were performed using the Fisher exact test, χ2 test, or a linear-by-linear association test for qualitative variables and a Student t test for quantitative variables, all at a .05 significance level.
For statistically significant imaging variables, receiver operating characteristic (ROC) analysis with determination of the Youden index was performed to identify the best discriminating value to differentiate between the 2 diseases. Sensitivity, specificity, accuracy, positive predictive value (PPV), negative predictive value (NPV), and area under the curve (AUC) for differentiation were calculated using the best discriminating value. An AUC of 0.5–0.7 was defined as poor discrimination; 0.7–0.8, as acceptable; 0.8–0.9, as excellent; and >0.9 as outstanding.24
Finally, for statistically significant variables, a score of 1 or 0 was assigned to each on the basis of the cutoff value. A point of 1 indicates a high-risk feature for CS, while zero indicates a favorable feature for SC. A composite score for differentiating CS from SC was created by summing the points of all variables. ROC analysis with determination of the Youden index was performed to evaluate the best cutoff value of the composite score to differentiate CS from SC.
SPSS Statistics 23 (IBM) was used for all statistical analyses.
RESULTS
Analysis of Clinical Features
No statistically significant difference was found in age, male-to-female ratio, right-to-left ratio, or chief symptom of swelling, pain, and/or trismus between CS and SC (Table 1).
Clinical features of CS and SCa
Analysis of Imaging Features
All imaging features of CS and SC are summarized in Table 2. The interobserver agreement between the 2 readers was almost perfect and excellent for imaging variables, respectively (P < .001).
Imaging features for CS and SCa
Imaging features that were statistically significant for differentiating CS from SC were as follows: 1) lesion center (P < .001), 2) destruction of the mandibular condyle (P = .037), 3) destruction of the articular eminence/glenoid fossa (P = .012), 4) sclerosis of the articular eminence/glenoid fossa (P < .001), 5) infiltration into the tendon of the LPM (P < .001), 6) pattern of calcification (P = .008), 7) periosteal reaction (P = .001), 8) internal enhancement (P < .001), and 9) lesion size (P < .001).
The presence of calcification showed no statistical significance. When a calcification pattern was considered as a dimensional continuum from the absence of calcification to popcorn calcification, however, a significant difference in pattern was observed by the linear-by-linear association test (P = .008).
Diagnostic Performance of Each Imaging Feature and Composite Scoring Model
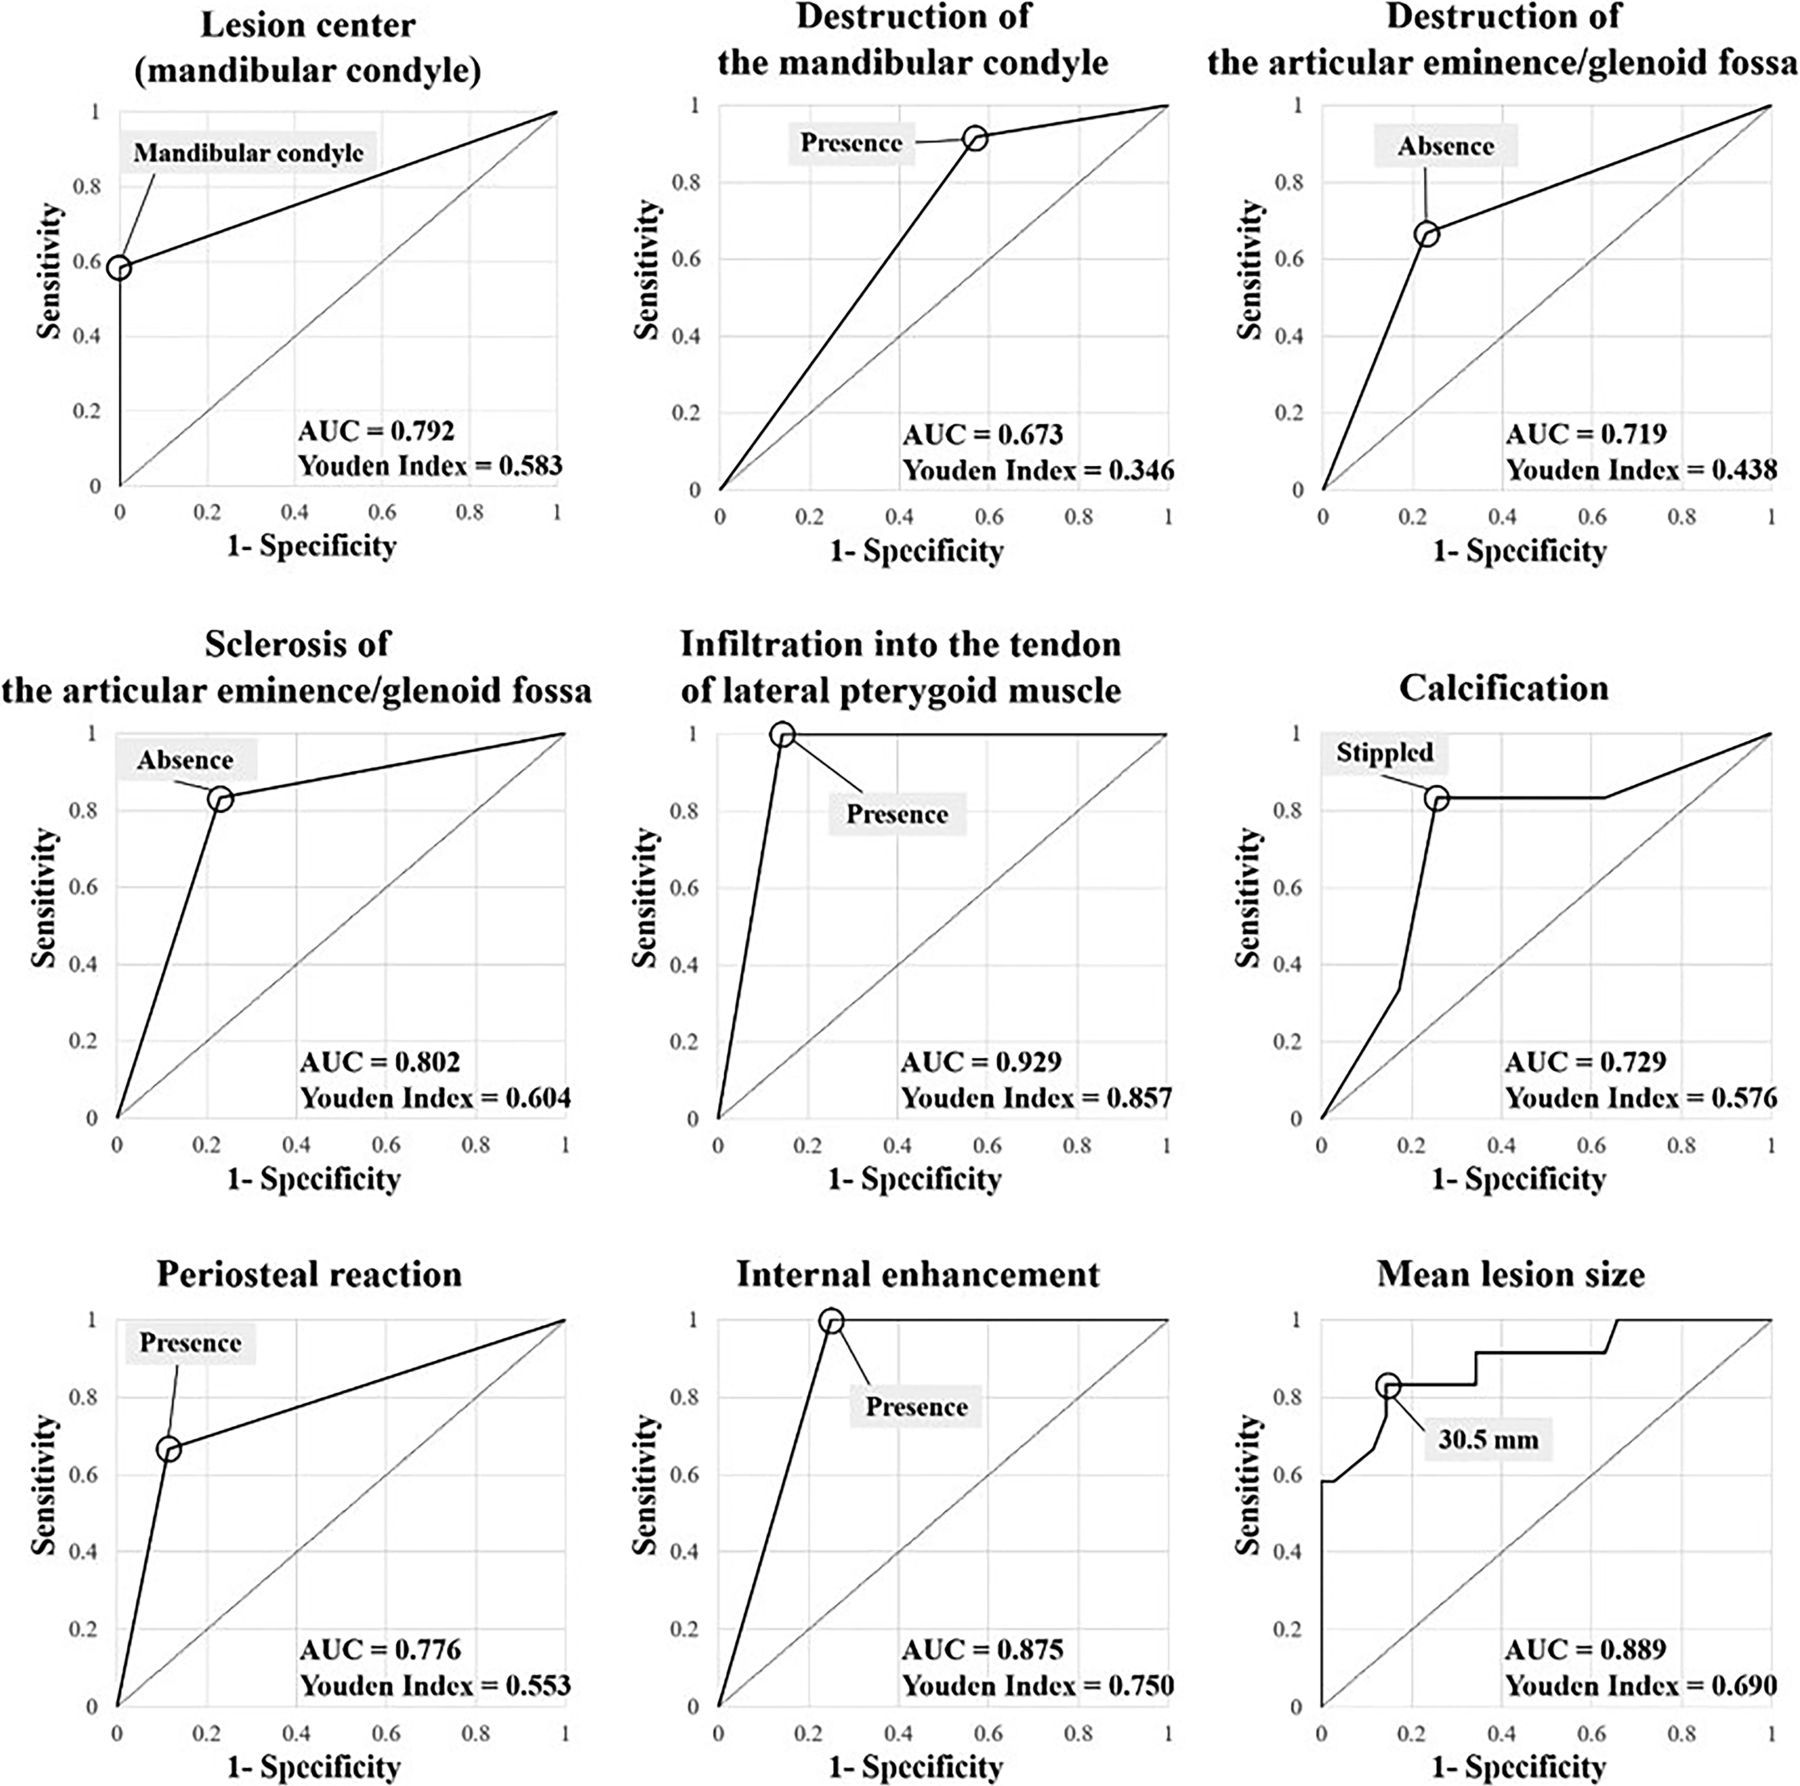
The discriminating values for each imaging feature to differentiate CS from SC were as follows: 1) “Mandibular condyle” for lesion center, 2) “Presence” for destruction of the mandibular condyle, 3) “Absence’” for destruction of the articular eminence/glenoid fossa, 4) “Absence” for sclerosis of the articular eminence/glenoid fossa, 5) “Presence” for infiltration into the tendon of LPM, 6) “Stippled calcification” for pattern of calcification, 7) “Presence” for periosteal reaction, 8) “Presence” for internal enhancement, and 9) “30.5 mm” for lesion size (Fig 5).

ROC curves for qualitative and quantitative variables show that the best discriminating values for differentiating CS from SC are the following: Mandibular condyle for lesion center, Presence for destruction of the mandibular condyle, Absence for destruction of the articular eminence/glenoid fossa, Absence for sclerosis of the articular eminence/glenoid fossa, Presence for infiltration into the tendon of lateral pterygoid muscle, Stippled pattern of calcification, Presence for periosteal reaction, Presence for internal enhancement, and 30.5 mm for lesion size. Of the 9 variables, except for pattern of calcification and mean lesion size, the remaining 7 variables were dichotomous qualitative variables with discriminating values determined at 1 of the 2 characteristics. On the other hand, mean lesion size was a quantitative variable, and the discriminating value was determined at the point of 30.5 mm, which revealed the maximum Youden index among multiple points. Last, the pattern of calcification, the 5 patterns, namely absence, stippled, flocculent, ring-and-arc, and popcorn, were considered as a dimensional continuum in ascending order and converted into an ordinal quantitative variable. The ROC curve was then constructed, and the discriminating value was derived at the point of stippled calcification, which indicates that CS showed a higher prevalence in absence or stippled calcification, and SC, in the other calcification patterns.
Sensitivity, specificity, accuracy, PPV, NPV, and AUC for each imaging feature for differentiating CS from SC are listed in Table 3. The maximum value of sensitivity (100%) was obtained for infiltration into the tendon of the LPM and internal enhancement, while the maximum value of specificity (100%) was revealed for the lesion center. The single imaging feature that showed outstanding performance (AUC = 0.929; 95% CI, 0.855–1.000) was infiltration into the tendon of the LPM.
Table 3: Diagnostic performance of each qualitative and quantitative parameter that showed a statistically significant difference for differentiating CS from SCa
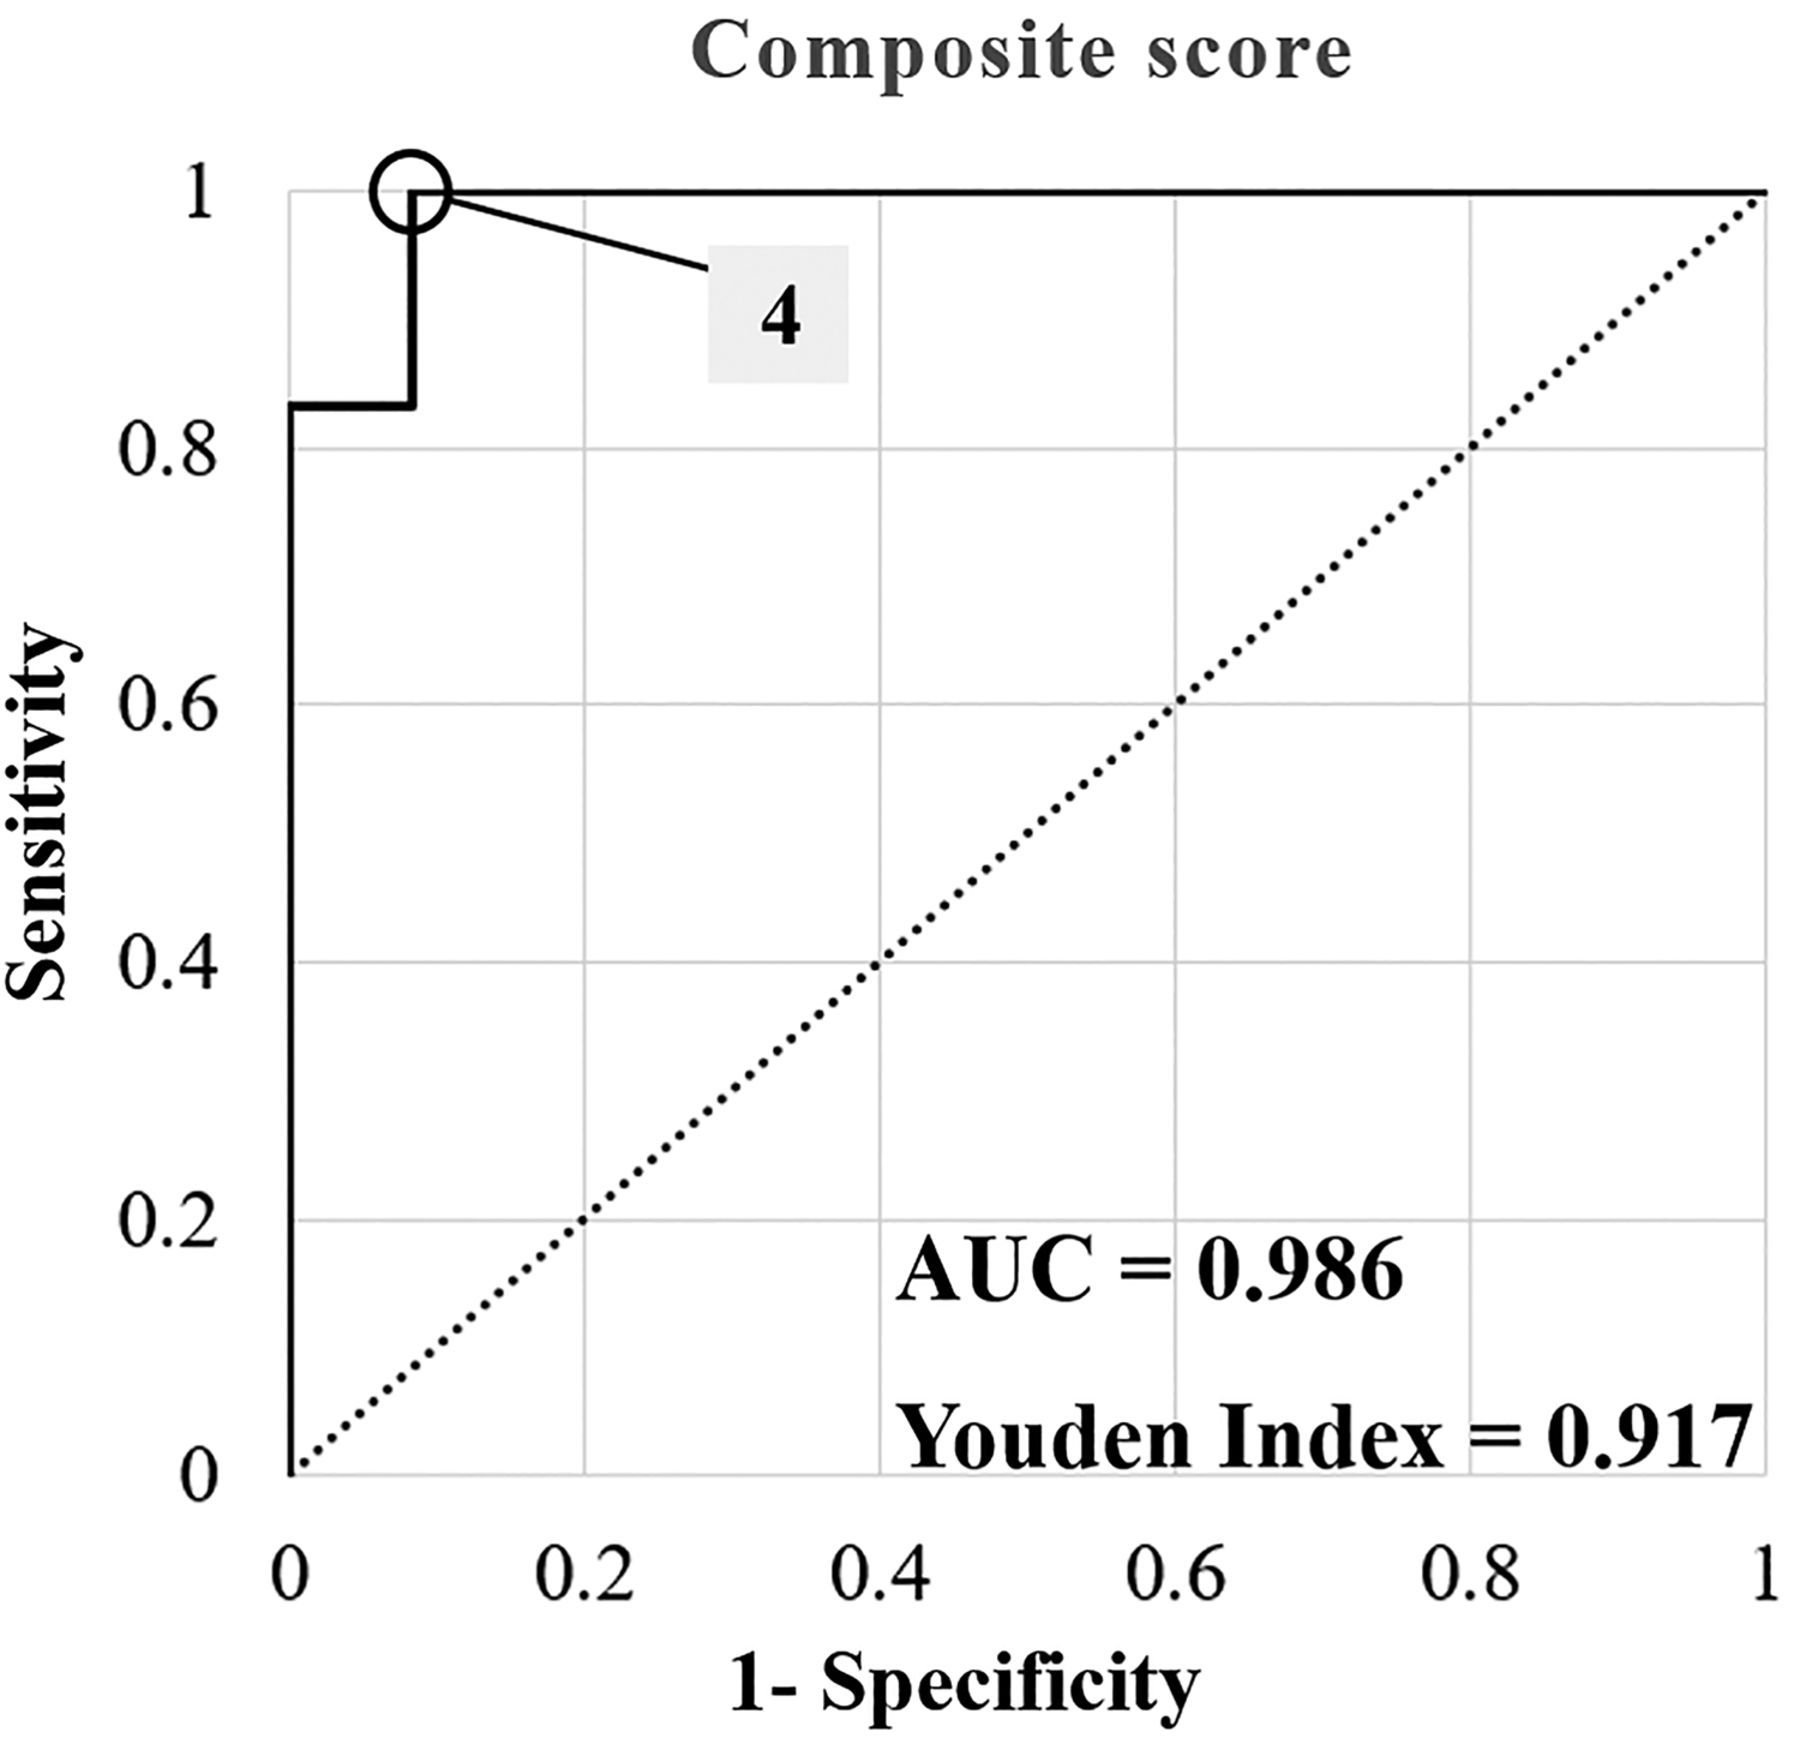
ROC analysis for the composite score based on the presence of each high-risk feature for CS is presented in Fig 6, and a scoring rubric for each imaging feature is provided in the Online Supplemental Data. The best cutoff value to distinguish CS from SC was observed for the presence of ≥4 high-risk features (Youden index = 0.917; AUC = 0.986; 95% CI, 0.950–1.000). This cutoff value showed 100.0%, 91.7%, 95.8%, 92.3%, and 100.0% values for sensitivity, specificity, accuracy, PPV, and NPV, respectively.

The ROC curve of the composite score for distinguishing CS from SC. The score was assessed by assigning 1 point for each of the following high-risk imaging features for chondrosarcoma: lesion center on the mandibular condyle, destruction of the mandibular condyle, no destruction of the articular eminence/glenoid fossa, no sclerosis of the articular eminence/glenoid fossa, infiltration into the tendon of the lateral pterygoid muscle, absence or stippled calcification, periosteal reaction, internal enhancement, and ≥30.5 mm lesion size. The ROC analysis demonstrated that the best cutoff value for differentiating CS from SC was +4 points (Youden index = 0.917, AUC = 0.986; 95% CI, 0.950–1.000).
DISCUSSION
The present study investigated CT and MR imaging features to differentiate between CS and SC of the TMJ. The imaging distinction between these 2 entities is important because a preoperative histopathologic examination can yield low rates of a correct differential diagnosis between CS and SC.2,14 The present study analyzed 9 imaging features to differentiate between CS and SC. The single imaging feature with the highest performance for the differential diagnosis was infiltration into the tendon of the LPM, followed by lesion size, internal enhancement, and sclerosis of the articular eminence/glenoid fossa. If at least 1 of 4 imaging features showing the 4 highest AUCs is observed, CS should be included in the differential diagnosis. Moreover, with a combination of the 9 imaging features, the diagnostic performance is improved.
Infiltration into the tendon of the LPM, an imaging feature for CS, was first reported in a previous study2 and demonstrated the highest AUC and sensitivity (100%) for the prediction of CS. The lesion center on the mandibular condyle and resultant infiltration into the tendon of the LPM in CS could be explained by the conventional intramedullary type of most cases of CS.8 All SC in the present study showed a lesion center in the joint space, which can be understood by the joint synovium as the origin of the SC.25 We think that benign tumorlike arthropathies arising in the synovium rarely infiltrate the tendon of the LPM; thus, this imaging feature might be a strong discriminator between other benign and malignant tumors of the TMJ, though further study is required.
The lesion size of CS was significantly larger than that of SC, with a cutoff value of ≥30.5 mm. According to the Milgram classification of SC, which divides SC into onset phase I (intrasynovial involvement), transitional phase II (intrasynovial involvement and free bodies), and resolution phase III (multiple free bodies), the onset phase I represents an inflammatory intrasynovial process.25 CS with a malignant nature can show more rapid growth and a resultant larger size compared with SC. In the body, CSs tend to be large tumors, and most exceed 4 cm in maximal lesion size.8,26 The average lesion size of 25 cases of SC anywhere in the whole body, including large joints such as shoulder and knee, was 3.9 × 1.7 cm.27 The larger lesion size in CS than in SC is consistent with findings in previous studies.8,26,27
The presence of internal enhancement was significantly more frequent in CS than in SC and showed high sensitivity (100%) for CS in the present study. Heterogeneous solid and focal solid enhancement in CS might represent malignant cells rather than cartilaginous tissue.2 On the other hand, septalike enhancement in cartilaginous tumors or cartilaginous tumorlike conditions such as SC are thought to be fibrovascular tissue caused by a lobulated growth pattern.27⇓-29 Thus, various patterns of internal enhancement might allow differentiation of CS from other benign tumors.
Destruction of the mandibular condyle and no destruction/sclerosis of the articular eminence/glenoid fossa were significantly more commonly observed in CS than in SC. These significant differences could be explained by the lesion center on the mandibular condyle in most CS, while SC has a lesion center in the joint space, especially the superior joint space.7,30,31 The articular disc can protect the articular eminence/glenoid fossa from the mass of CS arising from the mandibular condyle and might protect the mandibular condyle from the mass of SC if it is centered at the superior joint space.
The present study has some limitations. First, this was a retrospective study with a small number of patients, so the possibility of overfitting cannot be avoided. A prospective multicenter study with a larger number of patients is needed to validate the diagnostic performance of the imaging features in the present study. Second, multivariate regression analysis is desired to determine the most impactful independent variables and how those variables interact with each other. In the present study, though the number of imaging parameters was large, and the number of patients was relatively small. This feature prevented regression analysis, and 1 or 0 point was assigned to each imaging variable for calculating the composite score. Third, MR imaging is better than CT for evaluating infiltration into the tendon of the LPM, but not all the patients with SC underwent MR imaging. For 11 of 35 patients, the infiltration into the tendon of the LPM was assessed on MDCT images, and calcifications throughout the SC lesions made it possible to evaluate the extent of the lesion relative to the tendon of the LPM. Fourth, the type of imaging performed was not consistent between patients with CS and those with SC. The fact that MR imaging and contrast-enhanced images were obtained for all patients with CS but not for patients with SC might have influenced the evaluation of the readers. In other words, absence of MR imaging or a contrast image could indicate a low suspicion for CS.
CONCLUSIONS
On the basis of our small case series, we suggest that CT and MR imaging features can differentiate CS and SC. Single imaging features with the highest performance for a differential diagnosis were infiltration into the tendon of the LPM, followed by lesion size and internal enhancement. A combination of imaging features showed very good performance for the differential diagnosis, so that a TMJ mass with ≥4 high-risk imaging features can be considered likely CS. Further validation with additional data sets will be informative.
Acknowledgments
This study was submitted as a doctoral dissertation at Seoul National University and has not been published elsewhere.
Footnotes
Disclosure forms provided by the authors are available with the full text and PDF of this article at www.ajnr.org.
References
- Received February 21, 2023.
- Accepted after revision August 3, 2023.
- © 2023 by American Journal of Neuroradiology


Jump to section
Related Articles
Cited By...
- No citing articles found.