
Abstract
BACKGROUND AND PURPOSE: The diagnosis of active MS lesions is often based on postgadolinium T1-weighted MR imaging. Recent studies suggest a risk of IV gadolinium to patients, predominantly based on gadolinium deposition in tissue. Noncontrast sequences have shown promise in MS diagnosis, but none differentiate acute from chronic MS lesions. We hypothesized that 3D T2 sampling perfection with application-optimized contrasts by using different flip angle evolution (SPACE) MR imaging can help detect and differentiate active-versus-chronic MS lesions without the need for IV contrast.
MATERIALS AND METHODS: In this single-center retrospective study, 340 spinal MR imaging cases of MS were collected in a 24-month period. Two senior neuroradiologists blindly and independently reviewed postcontrast T1-weighted sagittal and T2-SPACE sagittal images for the presence of MS lesions, associated cord expansion/atrophy on T2-SPACE, and enhancement on postcontrast T1WI. Discrepancies were resolved by consensus between the readers. Sensitivity, specificity, and accuracy of T2-SPACE compared with postcontrast T1WI were computed, and interobserver agreement was calculated.
RESULTS: The sensitivity of lesion detection on T2-SPACE was 85.71%, 95% CI, 63.66%–96.95%; with a specificity of 93.52%, 95% CI, 90.06%–96.05%; and an accuracy of 92.99%, 95% CI, 89.58%–95.56. Additionally, 16/21 (84.2%) acute enhancing cord lesions showed cord expansion on T2-SPACE. The interobserver agreement was 92%.
CONCLUSIONS: Our study shows that T2-SPACE facilitates noncontrast detection of acute MS lesions with high accuracy compared with postcontrast T1WI and with high interobserver agreement. The lack of gadolinium use provides an advantage, bypassing any potential adverse effects of repetitive contrast administration.
ABBREVIATIONS:
- AP
- anterior-posterior
- MOGAD
- MOG antibody-associated disease
- NPV
- negative predictive value
- PPV
- positive predictive value
- SPACE
- sampling perfection with application-optimized contrasts by using different flip angle evolution
MS is a neurologic autoimmune disorder marked by the demyelination of neurons in the brain and spinal cord.1,2 MS diagnosis is based on the McDonald criteria, which require the detection of at least 1 lesion by neuroimaging, often via MR imaging T2-weighted sequences and postcontrast T1-weighted sequences.3⇓⇓-6 The use of gadolinium-based contrast agents for MS diagnosis is ubiquitous but adds extra cost, time, and potential contrast reactions to the imaging studies. Additionally, studies have shown tissue accumulation of gadolinium despite renal function after multiple doses of gadolinium-based contrast agents, notably with linear contrast agents, though the clinical significance of this is not fully understood.7⇓⇓⇓⇓⇓-13 For patients with MS, this constellation of concerns regarding gadolinium is relevant because >70% will receive at least 25 doses of IV gadolinium in their lifetimes, making the search for noncontrast imaging modalities crucial in MS lesion evaluation.14
Many gadolinium-free MR imaging sequences have shown promise in the diagnosis of MS, such as 3D phase-sensitive inversion recovery, double-inversion recovery, and FLAIR.4⇓-6 Yet, none of these techniques have been capable of discerning the different types of MS lesions without the use of a gadolinium-based contrast, a critical step needed to define the disease and its progression.3 Generally, MS lesions are divided into 2 categories: acute and chronic. Acute MS lesions are characterized by inflammation, demyelination, and vasogenic edema. With time, as the acute active lesion resolves, it becomes chronic, inactive, or nonenhancing, and the associated inflammation and edema resolve.1
In this study, we examine the role of the 3D T2 sampling perfection with application-optimized contrasts by using different flip angle evolution (SPACE sequence; Siemens) in MS spinal cord lesion detection and differentiation. Generally, the T2-SPACE sequence is good for evaluation of the anatomy/pathology of the spinal cord and nearby structures due to its excellent spatial resolution.15 Although this sequence tends to have relatively low sensitivity for detecting intramedullary cord lesions, it can demonstrate intramedullary lesions with high water content.16 This latter property of T2-SPACE is of interest to us in evaluating MS lesions. Acute MS lesions are characterized by vasogenic edema with a high water-diffusion coefficient, whereas chronic lesions have significant regression of this edema with a low diffusion coefficient.17⇓-19 As a result, we hypothesized that the T2-SPACE sequence can differentiate active, edematous MS lesions from chronic lesions without the need for IV gadolinium administration.
MATERIALS AND METHODS
Patient Selection
This retrospective study was approved by the Medstar Georgetown University Hospital institutional review board via an expedited review process. We searched the institutional PACS database for studies performed between January 2017 to December 2018, with the following as inclusion criteria: 1) older than 18 years of age; 2) having undergone cervical and/or thoracic MR spine imaging; and 3) had a diagnosis of MS. From this group of studies, any noncontrast studies were excluded, as were any studies with significant motion artifacts or those not including a sagittal T2-SPACE sequence.
Image Acquisition
All MR imaging examinations were performed on either 1.5T or 3T magnets (Siemens, Erlangen, Germany; Aera & Verio). All studies consisted of the following set of sequences: T1 sagittal 3 mm, T2 sagittal 3 mm, STIR sagittal 3 mm, T2-SPACE sagittal 1 mm, axial T2 3 mm, and postcontrast T1 sagittal and axial 3 mm. For this study, only postcontrast T1 sagittal (3-mm matrix = 256/0/0/230; TR = 701 ms; TE = 11 ms), and T2-SPACE sagittal (1-mm matrix = 256/0/0/261; TR = 1200 ms; TE =132 ms) stacks were examined. T2-SPACE images were acquired before the administration of gadolinium contrast in all cases. No reconstructions were reviewed for this study.
Lesion Detection
The entirety of the spinal cord imaged on T1 postcontrast sagittal and T2-SPACE sagittal sequences from each study was evaluated separately and in a blinded fashion by 2 attending neuroradiologists, one with 23 years of experience (E.V.M.) and the second with 11 years of experience (E.-C.C.L.) in the field postfellowship. T1 postcontrast images were evaluated for contrast-enhancing lesions in the spinal cord. Later, T2-SPACE sequences were reviewed for hyperintense cord lesions as well as cord dimensions at the level of the lesions. To determine focal cord dimensions, we evaluated the anterior-posterior (AP) length of the cord and each lesion. If the AP dimension was larger than that of the normal-appearing cord on the same study, the lesion was recorded with increased cord volume. If there was no difference in the AP dimension between the abnormal lesion and the normal cord, the lesion was recorded with no change in volume. Accordingly, if the lesion demonstrated an AP dimension lower than that of the normal cord, it was recorded as low volume. Results were collected via an Excel (Microsoft) spreadsheet by each of the investigators. Data values from the 2 readers were merged if nondiscrepant; any discrepancies in lesion enhancement, T2 hyperintensity, or cord volume between the readers were resolved by consensus between the 2 readers.
Statistical Analysis
Interreader reliability between the 2 neuroradiologists was computed as the percentage agreement between the raters. Using contrast enhancement on T1-weighted sequences as the criterion standard for active MS lesions, we computed the sensitivity, specificity, negative predictive value (NPV), positive predictive value (PPV), and accuracy for signal hyperintensity on T2-SPACE sequences. Each of these measures is reported with a 95% CI. We computed the same measures for hyperintense lesions on T2-SPACE with increased focal cord parenchymal volume, again using enhancement as the criterion standard. Statistical analyses were performed using MedCalc for Windows, Version 20 (MedCalc Software).
RESULTS
Of the 338 cases identified for this study, 314 met the inclusion criteria. Of the 24 studies excluded, 19 had no IV contrast administration, 2 did not include T2-SPACE imaging, 2 were dismissed due to motion artifacts, and one had imaging findings related to compressive myelopathy. The remaining 314 cases were from unique patients. The prevalence of acute MS lesions in this study was 6.69% (95% CI, 4.19%–10.04%). The percentage agreement between the raters for this study was 92%.
The first test evaluated the efficacy of T2-SPACE hyperintensity to detect acute MS lesions on the basis of postcontrast T1 as the criterion standard. Of the 314 total cases, 18 lesions from 18 separate studies showed both contrast enhancement on T1-weighted imaging and hyperintensity on T2-SPACE imaging. Nineteen lesions from 19 studies were hyperintense on T2-SPACE and had no enhancement on postcontrast T1 imaging; 3 lesions from 3 studies showed contrast enhancement without T2 hyperintensity; and 274 cases showed neither contrast enhancement nor T2 hyperintensity (the latter is depicted in Fig 1). When the presence of lesion hyperintensity on T2-SPACE was used as a diagnostic tool to detect acute MS lesions, the sensitivity was 85.71% (95% CI, 63.66%–96.95%); specificity, 93.52% (95% CI, 90.06%–96.05%); PPV, 48.65% (95% CI, 37.22%–60.22%); NPV, 98.92% (95% CI, 96.97%–99.62%); and accuracy, 92.99% (95% CI, 89.58%–95.56%).

MR imaging of 2 patients with MS. A 62-year-old woman in the top row (A–C) and a 52-year-old woman in the bottom row (D–F). The first panel (A and D) shows a sagittal STIR image of an MS lesion (arrow) in the cervical spine in both patients, which is not conspicuous on sagittal T2-SPACE (B and E) or sagittal postcontrast T1WI (C and F).
To further evaluate findings from the T2-SPACE sequence, we next tested the presence of signal hyperintensity within lesions combined with an increased AP dimension of the cord against enhancement. Among all lesions that were T2-hyperintense, 16 lesions had an increased focal cord AP dimension, all of which had corresponding enhancement on postcontrast T1 sequences (Figs 2 and 3). Combining both T2 hyperintensity and increased lesional volume on T2-SPACE imaging yielded a sensitivity of 88.89% (95% CI, 65.29%–98.62%), a specificity of 100.00% (95% CI, 82.35%–100.00%), a PPV of 100.00% (95% CI, 80.64%–100%), an NPV of 99.21% (95% CI, 97.14%–99.78%), and an accuracy of 99.26% (95% CI, 89.12%–100.00%). Furthermore, of 21 lesions with T2 hyperintensity and normal or atrophied focal cord parenchymal volume, 19 of them showed no lesional enhancement on postcontrast T1 (Fig 4).

MR imaging of a 38-year-old woman with MS. Sagittal T2-SPACE (left) shows focal T1–T3 hyperintensity (arrow) with focally increased volume corresponding to an active cord lesion on sagittal T1 postcontrast (right).

MR imaging of a 25-year-old man with relapsing-remitting MS. Sagittal T2-SPACE (left) shows focal C2–C3 hyperintensity (arrow), with focal increased cord volume corresponding to an enhancing, active lesion on sagittal T1 postcontrast (right) image.

MR imaging of a 32-year-old woman with relapsing-remitting MS. Sagittal T2-SPACE (left) shows focal T2 hyperintensity (arrow) with normal/decreased cord volume. No active lesion/enhancement is seen on the sagittal T1 postcontrast image (right).
DISCUSSION
Our findings suggest that hyperintensity of an MS lesion on T2-SPACE, best used in addition to increased lesional cord volume, is a strong indicator of the presence of an active MS spinal cord lesion without the need for IV gadolinium. These findings are compatible with the known pathophysiology of active MS lesions. In the early stages of an acute MS attack, an abundant amount of T-cells disrupt the BBB20 and break down myelin.21 They release chemotactic factors and inflammatory mediators and recruit cytokines, plasma cells, macrophages, and destructive proteins further breaking down the BBB.21 This process results in leakage of extracellular fluid into the lesion and focal vasogenic edema and cord swelling.22 Furthermore, biophysical studies have demonstrated that active MS lesions have a higher water ADC compared with chronic lesions and normal-appearing white matter.17⇓-19
Comparison of hyperintensity on T2-SPACE and enhancement on postcontrast T1 in MS lesions suggests that the former finding provides precise detection of active MS lesions with high sensitivity (85.71%), high specificity (93.52%), and high accuracy (92.99%). Furthermore, when combining the presence of increased cord volume of the lesion with T2 hyperintensity, the specificity, sensitivity, and accuracy increase to 100%, 88.89%, and 99.26%, respectively. The sensitivity of 89% for this evaluation still leads to about 11% of active lesions being incorrectly labeled as chronic and is a limitation in the use of a noncontrast-only evaluation of MS lesions (Fig 5). On further review of these instances, we found that the lesions were relatively small in comparison with others in the subset. We postulate that lesion size may affect the sensitivity of noncontrast evaluations and could be examined in future studies.

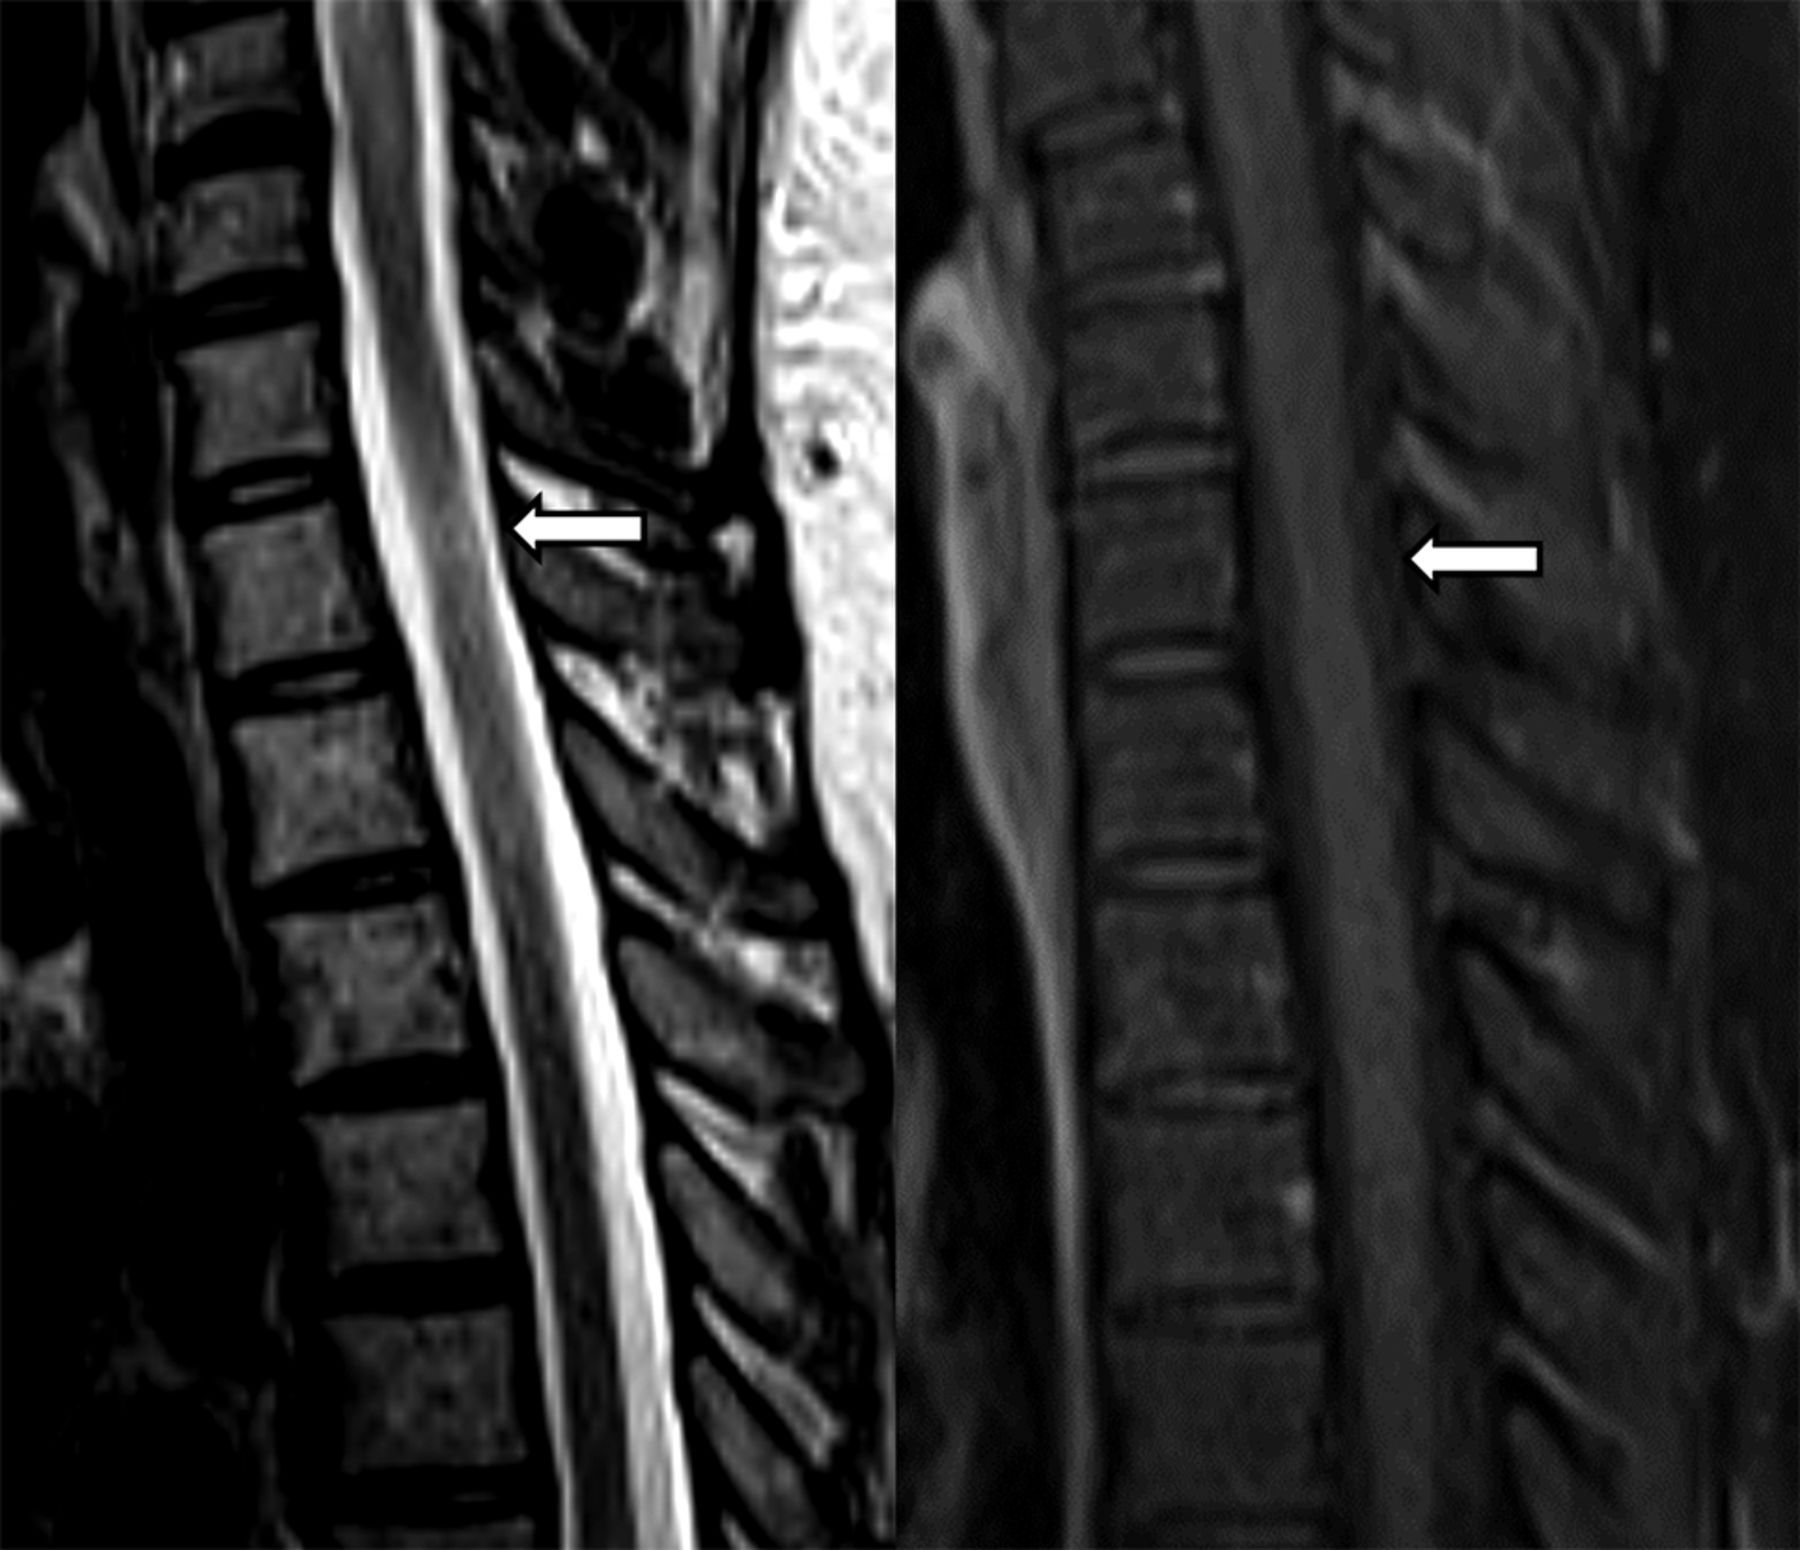
MR imaging of a 51-year-old woman with MS. Sagittal T1 postcontrast imaging shows an enhancing lesion (arrow) in the C3-C4 cord (left) without associated hyperintensity on T2-SPACE (right).
Further ad hoc investigation into the prior and subsequent images of patients in our study with acute MS plaques did show a progression of imaging findings with time. We observed that lesions with enhancement on postcontrast T1 and hyperintensity and cord expansion on T2-SPACE later progressed across months to years into lesions that were nonenhancing and isointense on T2-SPACE with normal-to-decreased cord volume (Fig 6). This observation supports the findings in our current study but certainly needs further investigation for validity.

Observational imaging progression of an active MS lesion in the C6 spinal cord across time to a chronic lesion in a 36-year-old woman with MS. Sagittal T2-SPACE (A) and sagittal postcontrast T1WI (B) show a T2-hyperintense lesion with cord expansion and enhancement compatible with an active lesion. Follow-up T2-SPACE (C) and postcontrast T1 (D) after 2 years demonstrate no T2 hyperintensity at the same site, with mild cord volume loss, and no enhancement, suggestive of a chronic lesion.
Additionally, not all acute MS lesions may have gadolinium enhancement and have been described as “chronic active” or “smoldering” lesions with ongoing disease activity in the absence of enhancement.23 Thus, lesions in our study that were T2-positive but negative on postgadolinium sequences (n = 19) could still represent active lesions. In this case, if this scenario is suspected, serial noncontrast T2-SPACE imaging could be performed to show reduction in the size of such lesions as a sign of decreased disease activity in clinical practice.
The high NPV of 98.92% for T2-SPACE hyperintensity in determining an active plaque presents imaging centers with the opportunity to screen patients with MS via noncontrast protocols, in that this offers the option to subsequently add IV contrast in patients with T2-SPACE hyperintense lesions either in real-time or on return imaging. This option could significantly reduce the amount of IV gadolinium to which patients with MS are exposed and mitigate the risk of potential adverse effects, including entities such as nephrogenic systemic fibrosis in patients with impaired kidney function.24,25 Additionally, our findings of high interreader reliability suggest that this sequence could provide consistent results among readers for this purpose in clinical practice.
Our study has several limitations. Although many examinations were entered into this study, the percentage of acute lesions identified was low. A larger sample size with increased power would provide stronger statistical significance to our results. This study was retrospective, and all cases were from a single center, leading to inherent bias in the group/patient population and, therefore, in the data analyzed. The studies were performed on 1.5T or 3T magnet strengths, which could contribute to inconsistency in lesion characterization, though studies have shown that 1.5T and 3T yield comparable results.26 Of note, every study included T2-SPACE and T1 postcontrast sequences acquired from the same MR imaging machine; no one sequence should have a Tesla strength advantage within the same case. Lesions were not pathologically correlated—an impractical expectation in this clinical evaluation but introduces a confounding variable because lesions could have an etiology other than MS. All studies were from patients with documented clinical diagnoses of MS. Finally, the neuroradiologists in this study could not be blinded to the sequence type they were assessing (T2-SPACE versus T1 postcontrast), possibly having added inherent bias in the reads.
Future directions in the use of this noncontrast protocol include differentiating various demyelinating diseases from one another. For example, a higher proportion of active lesions may suggest myelin oligodendrocyte glycoprotein antibody-associated disease (MOGAD) over MS, because MOGAD often only manifests with acute lesions, with older lesions resolving with time.27 Additionally, using noncontrast imaging to understand the active disease burden in MS may impact future treatment decisions, including the use of more aggressive therapies earlier in the disease. Prospectively, in case the determination of active lesions becomes incorporated into the diagnostic MS criteria, having a noncontrast method to evaluate these lesions will be crucial. Other promising directions in the use of noncontrast imaging for the detection of active MS plaques include application of DWI and quantitative susceptibility mapping protocols currently studied in the brain.28,29
CONCLUSIONS
The purpose of this study was to evaluate the use of T2-SPACE MR imaging for the detection of active MS plaques without IV gadolinium. We found high sensitivity, specificity, and accuracy for the presence of hyperintensity on T2-SPACE in diagnosing active plaques, which improved further when combined with focal cord expansion at the level of the lesions. These findings suggest that sagittal T2-SPACE imaging could play a role in routine follow-up spine MR imaging of patients with MS without the need for the routine use of IV gadolinium, with high correlation among interpreting readers.
Footnotes
Disclosure forms provided by the authors are available with the full text and PDF of this article at www.ajnr.org.
References
- Received March 28, 2023.
- Accepted after revision October 6, 2023.
- © 2023 by American Journal of Neuroradiology


Jump to section
Related Articles
Cited By...
- No citing articles found.