
Abstract
BACKGROUND AND PURPOSE: The detection rate of premortem MR imaging endolymphatic hydrops is lower than that of postmortem endolymphatic hydrops in Ménière disease, indicating that current MR imaging techniques may underestimate endolymphatic hydrops. Therefore, we prospectively investigated whether a novel high-resolution MR imaging technique, the 3D zoomed imaging technique with parallel transmission real inversion-recovery (3D-ZOOMit real IR), would improve the detection of endolymphatic hydrops compared with conventional 3D TSE inversion-recovery with real reconstruction.
MATERIALS AND METHODS: Fifty patients with definite unilateral Ménière disease were enrolled and underwent 3D-ZOOMit real IR and 3D TSE inversion-recovery with real reconstruction 6 hours after IV gadolinium injection. The endo- and perilymph spaces were scored separately. The contrast-to-noise ratio, SNR, and signal intensity ratio of the 2 sequences were respectively calculated and compared. The presence of endolymphatic hydrops was evaluated.
RESULTS: The endolymphatic space in the cochlea and vestibule was better visualized with 3D-ZOOMit real IR than with conventional 3D TSE inversion-recovery with real reconstruction (P < .001). There were differences between the 2 sequences in the evaluation of no cochlear hydrops and cochlear hydrops (both, P < .017). All contrast-to-noise ratio, SNR, and signal intensity ratio values of 3D-ZOOMit real IR images were statistically higher than those of conventional 3D TSE inversion-recovery with real reconstruction (all, P < .001).
CONCLUSIONS: The 3D-ZOOMit real IR sequences are superior to conventional 3D TSE inversion-recovery with real reconstruction sequences in visualizing the endolymphatic space, detecting endolymphatic hydrops, and discovering contrast permeability.
ABBREVIATIONS:
- CNR
- contrast-to-noise ratio
- 3D real IR
- 3D inversion-recovery with real reconstruction
- EH
- endolymphatic hydrops
- FOV
- field of view
- MD
- Ménière disease
- SI
- signal intensity
- SPACE
- sampling perfection with application-optimized contrasts by using different flip angle evolution
- SIR
- signal-intensity ratio
- t-3D real IR
- 3D TSE inversion-recovery with real reconstruction
- ZOOMit
- zoomed imaging technique with parallel transmission
- zs-3D real IR
- 3D ZOOMit SPACE real inversion-recovery
Ménière disease (MD) is a chronic disease characterized by spontaneous attacks of vertigo, fluctuating hearing loss, tinnitus, and aural fullness.1 However, the clinical symptoms are assessed by the patients themselves with poor objectivity, and consequently, MD is often misinterpreted and confused with other pathologies mimicking MD clinically, such as vestibular migraine.2 Accordingly, it is difficult and unreliable to diagnose MD solely on the basis of the clinical symptoms, especially when the symptoms are unusual. Additionally, endolymphatic hydrops (EH) is a pathologic manifestation of MD.3 A 100% correlation between MD and EH has been reported in the literature on the basis of histopathologic analysis of human temporal bones. Therefore, the 2020 revised diagnostic criteria of Japan4 emphasized the importance of MR imaging for identifying EH for the differential diagnosis between certain MD and definite MD.5⇓-7
The current standards for EH MR imaging are either 3D inversion-recovery with real reconstruction (3D real IR) or 3D FLAIR. Naganawa et al8 reported that 3D TSE inversion-recovery with real reconstruction (t-3D real IR) was superior to 3D FLAIR for the assessment of EH; 3D FLAIR can only differentiate endolymph from perilymph, but not from the surrounding bone, while 3D real IR can better separate them (producing a negative signal for endolymphatic space, a near-zero signal for surrounding bone, and a high signal for perilymphatic space). Unfortunately, conventional t-3D real IR imaging after IV gadolinium–based contrast media occasionally results in an insufficient contrast-to-noise ratio (CNR) to separately visualize the endolymph, perilymph, and surrounding bony structures when evaluating EH in the cochlea.9,10 Consequently, >90% but not 100% of patients with MD showed EH by premortem MR imaging in at least 1 ear,11,12 indicating that the current MR imaging technique may underestimate EH. Additionally, detecting slight hydrops at early stages is important to investigate longitudinal changes of EH in MD and understand their relationship. Therefore, a more sensitive and accurate MR image in identifying EH is needed.
An improved 3D real IR imaging technique called 3D zoomed imaging with parallel transmission technique (ZOOMit) sampling perfection with application-optimized contrasts by using different flip angle evolution (SPACE; Siemens) real IR (zs-3D real IR), which allows localized excitation using parallel transmission, was proposed with a higher CNR. The ZOOMit technique powered by parallel transmission architecture can create a zoom effect during MR imaging to shape images, which can be faster compared with the t-3D real IR sequence, and the image quality in the selected zoom area is considerably improved.13 The SPACE sequence can avoid the blurring effect caused by the long echo chain and can be modified and optimized according to the T2 value of the tissue to be examined.14 The zs-3D real IR technique, a combination of ZOOMit and the SPACE sequence, can minimize the negative effects of folding artifacts and provide high image quality, decreasing distortion and blurring, and increasing spatial resolution, resulting in faster screening.13⇓-16 This use leads to the detection and evaluation of smaller lesions, especially in areas prone to susceptibility artifacts, such as the temporal bone,17,18 for increased diagnostic confidence.
However, the usefulness of this sequence for evaluating EH in MD has not yet been reported. We, therefore, propose the hypothesis that zs-3D real IR is superior to t-3D real IR for the evaluation of EH in MD. To achieve this goal, we compared the differences between these 2 sequences in the CNR, SNR, and signal-intensity ratio (SIR); the scores of endo- and perilymph space; and EH in patients with MD.
MATERIALS AND METHODS
Patients
Fifty patients with definite unilateral MD (according to the 2015 revised diagnostic criteria of the Balance Society3) who visited our outpatient department (Shandong Provincial ENT Hospital) from December 2020 to October 2021 were recruited consecutively. The exclusion criteria were as follows: 1) trauma or neoplasm of the temporal bone; 2) prior ear surgery or treatment with chemotherapeutic agents or other immunosuppressive drugs; and 3) MR imaging–related contraindications. This prospective study was approved by the ethics committee of our institution, and all patients provided informed consent.
MR Imaging Experiments
All scans were performed on a 3T MR imaging system (Magnetom Prisma; Siemens) with parallel transmission technology (TimTX TrueShape; Siemens) and a 64-channel array head and neck coil. We used 2 MR images: conventional t-3D real IR image and zs-3D real IR. All patients had an IV injection of a double dose (0.4 mL/kg body weight) of gadoteridol (ProHance; Bracco Diagnostics).19,20 All 50 patients with unilateral definite MD underwent conventional t-3D real IR and zs-3D real IR 6 hours after the IV administration of gadolinium.21 The order of zs-3D real IR and t-3D real IR image acquisitions was randomized. Referring to the previous study,22 we obtained the optimal scanning parameters on the basis of the initial experimental scanning in some volunteers who were not included in the study. Details of the optimal parameters on 3D real IR are listed in Table 1.
Pulse sequence parameters
Data Collection and Analysis
All data were processed at the ADW 4.7 workstation (GE Healthcare). MR images were evaluated by 2 independent radiologists with 10 and 15 years of working experience, respectively, who were blinded to the clinical data in different sessions. The interval between reading sessions for t-3D real IR and zs-3D real IR was >1 week. To avoid reading and measuring bias, we enlarged the display field of view (FOV) for both the conventional t-3D real IR and zs-3D real IR images to 50 ×50 mm.
Qualitative Analysis
Two radiologists independently reviewed the images, scored the separation of endo- and perilymph, and graded the degree of cochlea and vestibule hydrops on zs-3D real IR and t-3D real IR in the same session.
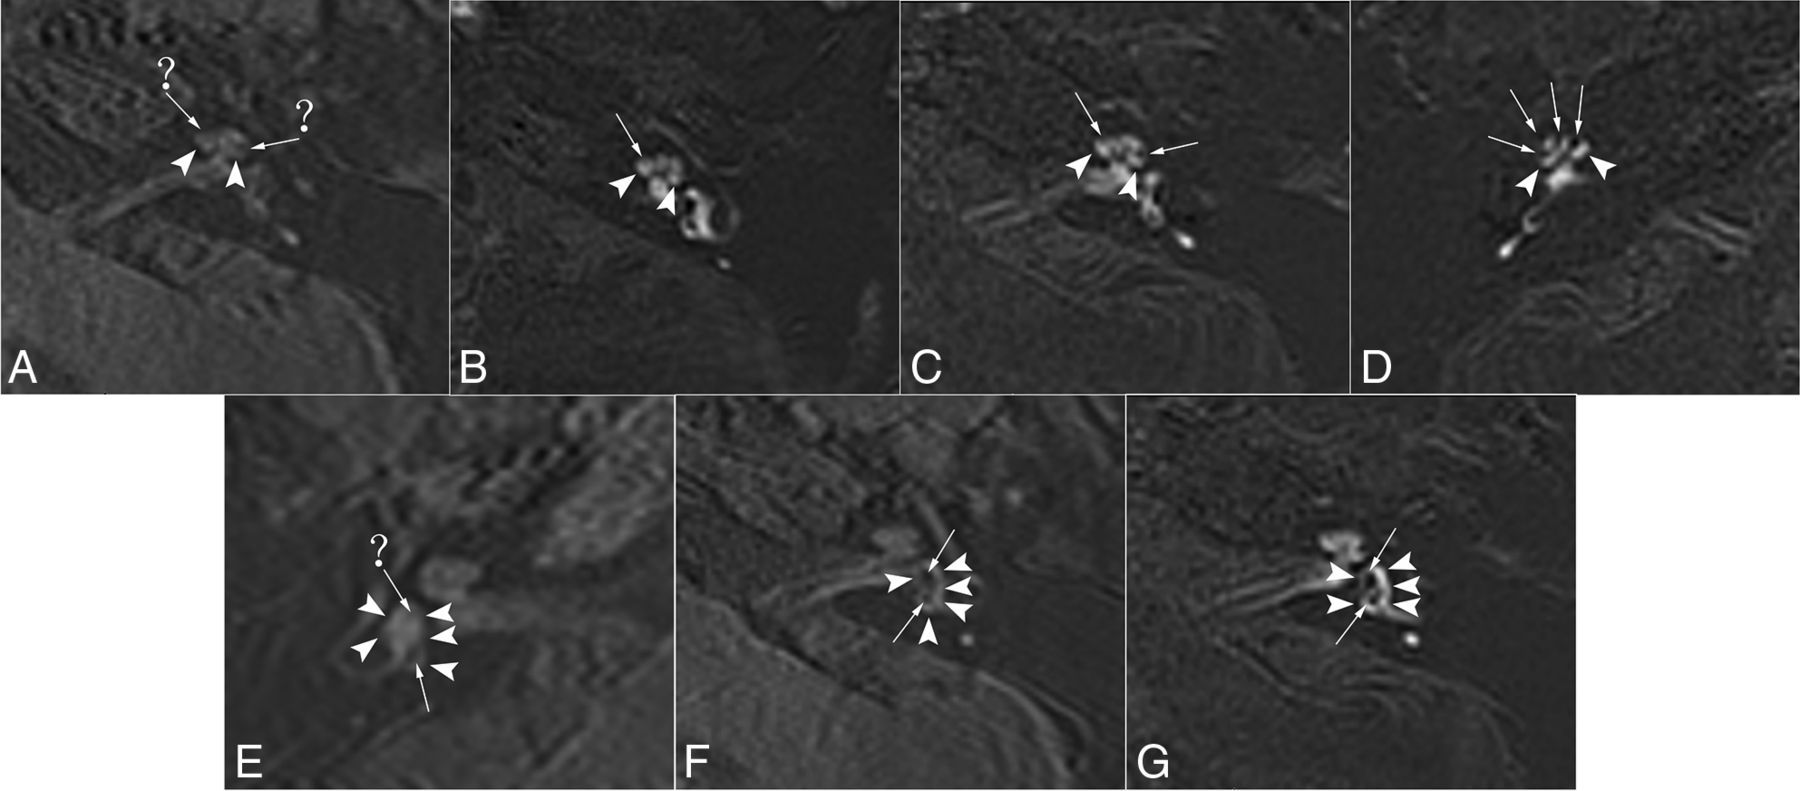
Scores for the separate visualization of the cochlear and vestibular endolymph were as follows: 1, impossible to recognize; 2, some can be recognized; 3, most can be recognized; and 4, all can be recognized.23 The corresponding specific scoring for cochlear and vestibular endolymph is demonstrated in Fig 1.

The images of different scores for the separate visualization of the cochlear and vestibular endolymph in patients with MD. A, E, and F, 3D TSE real IR images. The perilymph is slightly enhanced (arrowheads). B, C, D, and G, ZOOMit SPACE real IR images. The perilymph is markedly enhanced (arrowheads). A, Score 1 for the cochlea. It is impossible to recognize the cochlear duct (endolymph, arrows and question marks). B, Score 2 for the cochlea. The cochlear duct (endolymph, arrow) was recognized only in the basal turn of the cochlea. C, Score 3 for the cochlea. The cochlear duct (endolymph, arrows) was recognized in the basal and middle turns of the cochlea. D, Score 4 for the cochlea. The cochlear duct (endolymph, arrows) was recognized in the basal, middle, and apical turns of the cochlea. E, Score 2 for the vestibule. A small part of the boundary for the utricle (arrow) was clearly displayed (≤ one-half of vestibular endolymph), and the edge could be clearly delineated, while the rest of the boundary was blurred (saccule, arrow and question mark). F, Score 3 for the vestibule. Most of the boundary of the saccule and the whole utricle (arrows) was clearly displayed (> one-half and <1 of vestibular endolymph), and the edge could be clearly delineated. G, Score 4 for the vestibule. The boundary of the saccule and utricle (endolymph, arrows) was clearly displayed (the whole vestibular endolymph).
The grading of vestibular and cochlear hydrops was assessed separately. The degree of cochlear hydrops was graded as none, grade I, or grade II according to the criteria previously proposed by Baráth et al.11 To determine the degree of vestibular hydrops, we used a modified 4-stage grading system (Fig 2) based on Bernaerts et al.24 In this modified 4-stage grading system, we redefined vestibular EH (II) as the confluence of the saccule and utricle with a continuous peripheral rim enhancement and vestibular EH (III) as the confluence in which the perilymphatic enhancement is no longer continuous (Fig 2). In our experience, some patients with vestibular EH (II) were categorized as having serious EH according to the grading criteria for EH reported by Nakashima et al.25

ZOOMit SPACE real IR images of different degrees of cochlear and vestibular EH in patients with MD. A, Normal cochlea (none). The scala media is minimally visible (solid arrow). B, Cochlear EH (I). The scala media becomes indirectly visible (solid arrows) as a nodular black cutout of the scala vestibuli, which was partially obstructed. C, Cochlear EH (II) and vestibular EH (III). The scala vestibuli is fully obliterated owing to the distended scala media (solid arrows). There is major or full obliteration of the bony vestibule; occasionally, only a few vestibular perilymphatic spaces near the cochlea remained (arrowhead). D, Normal vestibule. The saccule (solid arrow) and utricle (dotted arrow) are visibly separated and take less than one-half of the area of the vestibule. E, Vestibular EH (I). The saccule (solid arrow), normally smaller than the utricle, has become equal or larger than the utricle but is not yet confluent with the utricle (dotted arrow). F, Vestibular EH (II). There is a confluence of the saccule and utricle (solid arrow), with a continuous peripheral rim enhancement of the perilymphatic space (arrowheads).
Next, the evaluation results of the 2 radiologists were collected. If there were any discrepancies between the 2, those images were evaluated again by a third radiologist with 20 years of experience and the results were regarded as the final results. All radiologists graded the degree of cochlea and vestibule hydrops according to the criteria previously proposed by Baráth et al11 and the modified 4-stage grading system based on Bernaerts et al.24
Quantitative Analysis
Referring to method of Naganawa et al,23 the signal intensity (SI) in all patients with MD was measured. The method (Fig 3) was as follows: We set a 1-mm2 circular ROI on the center of the scala tympani of the cochlear basal turn (SIperi) at the best-enhanced section (Fig 3A).23 For the SI of the endolymph (SIendo), we set a 1-mm2 circular ROI on the utricle (Fig 3B), where a larger ROI can usually be drawn than in other endolymphatic spaces and the utricle is most consistently recognized even in subjects without EH. Two oblique sagittal reference slices were obtained using multiplanar reconstructions from coronal and axial slices in the cochlear basal turn and vestibular plane, respectively. When we combined the 2 reference slices, the ROIs in the scala tympani and utricle were accurately delineated on axial images. A 10-mm2 circular ROI was set in the left middle cerebellar peduncle of the image (SIlmcp) (Fig 3C).12 Noise was defined as the SD of the ROI with 6 mm2 in the artifact-free air area (SDnoise) of the ipsilateral external auditory canal (Fig 3D).

A, ROI image of zs-3D real IR at the level of the lower cochlear basal turn. Circle 1 of 1 mm2 indicates the ROI for the perilymph in the scala tympani in the basal turn of the cochlea. B, Zs-3D real IR image at the middle level of the vestibule. Circle 1 of 1 mm2 indicates the ROI for the endolymph in the utricle. C, The zs-3D real IR image at the level of the left middle cerebellar peduncle. Circle 1 of 10 mm2 indicates the ROI for SI in the left middle cerebellar peduncle. D, The zs-3D real IR image at the level of the artifact-free air area of the ipsilateral external auditory canal. Circle 1 of 6 mm2 indicates the ROI for the SD in the artifact-free air area of the ipsilateral external ear.
The ROI was first drawn on the zs-3D real IR image for the right side and then copied to the left side. It was then drawn on the corresponding t-3D real IR image. In the case of any misregistration between the zs-3D real IR and t-3D real IR images, the ROI placement was manually adjusted. The average SI or SD values of the ROI automatically generated by the workstation were recorded. Blinding to the 2 sequences performed in the present study was not feasible because their FOVs were different. Two radiologists determined each ROI twice for each patient and averaged the SI of the 2 measurements for analysis. Finally, the CNR, SNR, and SIR values were dependent on the average value and were calculated using the following equations:


 We then compared the CNR, SNR, and SIR values of zs-3D real IR and t-3D real IR and further compared the SIR values in the affected and asymptomatic sides by zs-3D real IR or t-3D real IR.
Statistical Analyses
Statistical analyses were performed using SPSS (Version 25.0; IBM). Interobserver agreement between the first 2 radiologists was tested using κ statistics. For quantitative and qualitative analyses, we used the paired samples t test or the Wilcoxon signed-ranked test. Statistical significance was set at P < .05.
RESULTS
Population
Fifty consecutive patients with definite unilateral MD (right side = 21 and left side = 29) were included in our study. Additionally, there were 22 men and 28 women with a mean age of 53.06 (SD, 13.28) years (ranging from 16 to 81 years of age).
Qualitative Analysis
The 2 radiologists completely agreed on the final grading and scoring of all evaluated cochleae and vestibules. κ values evaluating interobserver agreement for cochlear endolymph recognition and cochlear hydrops were 0.58 and 0.56 for t-3D real IR and 0.97 and 0.96 for zs-3D real IR. Moreover, those for the vestibule were 0.98 and 0.97 for t-3D real IR and 1.0 and 1.0 for zs-3D real IR.
Separate visualization of the endolymphatic space in the cochlea and vestibule of 50 patients with MD was evaluated using zs-3D real IR and t-3D real IR images, and the scores are listed in Table 2. For recognition of endolymphatic space in the cochlea, none of the 50 ears scored 1 on the affected side on zs-3D real IR, but 2 of the 50 ears scored 1 on t-3D real IR. None of the asymptomatic ears scored 1 on the zs-3D real IR, while 3 asymptomatic ears scored 1 on the t-3D real IR. Meanwhile, for the recognition of the endolymphatic space in the vestibule, 9 ears scored 3 on the affected side on zs-3D real IR, but 22 ears scored 3 on t-3D real IR; similarly, one of the asymptomatic ears scored 3 on the zs-3D real IR, while 23 asymptomatic ears scored 3 on the t-3D real IR. Obviously, among all patients, we recognized the endolymphatic space for both the cochlea and vestibule better on zs-3D real IR than on t-3D real IR on both affected and asymptomatic sides (all P < .001).
Scores for separate visualization of endolymphatic space in the cochlea and vestibule by 2 pulse sequences in 50 patients with MD
The percentages of inner ear EH on zs-3D and t-3D real IR in the 50 affected ears were 98.0% and 96.0%, respectively. Consequently, there was no difference between the 2 sequences in the evaluation of the inner ear EH (P = 1.000). Furthermore, the grading of vestibular and cochlear hydrops of 50 patients with MD by the 2 sequences is detailed in Table 3. The percentages of no cochlear EH, cochlear EH (I), and cochlear EH (II) on affected side were 14.0%, 24.0%, and 62.0% in zs-3D images and 30.0%, 8.0%, and 62.0% in t-3D real IR images, respectively (Table 3). Consequently, there were differences between the 2 sequences in evaluating cochlear EH of the affected sides (Z = −2.83, P = .005), but not in vestibular EH (Z = 0.00, P = 1.000). By means of the α-segmentation method post hoc test, significant differences were observed between the 2 sequences in evaluating no cochlear EH and cochlear EH (I) (P < .017). There were no differences between the 2 sequences in evaluating cochlear or vestibular EH of asymptomatic sides.
Number and percentage distribution of cochlear and vestibular EH grading by 2 pulse sequences in 50 patients with MD
Quantitative Analysis
The mean CNR, SNR, and SIR values of the affected side on zs-3D real IR were 1.51, 1.56, and 8.19 times higher than those of t-3D real IR (Online Supplemental Data). Obviously, the CNR, SNR, and SIR values of zs-3D real IR images were statistically higher than those of t-3D real IR images on both the affected and asymptomatic sides (all, P < .001) (Fig 4). Additionally, there was a significant interaural difference in SIR in patients with definite unilateral MD by zs-3D real IR (Z = −5.266, P < .001) and t-3D real IR (Z = − 5.063, P < .001).

Differences in the CNRs (A), SNRs (B), and SIRs (C) of the affected and asymptomatic sides are found between the 2 sequences (P < . 001).
DISCUSSION
In our study, CNR, SNR, and SIR values; endo- and perilymph scores; and EH grading by zs-3D real IR were higher than those by t-3D real IR.
Our results suggest that visualization of the endolymphatic space by IV gadolinium–based contrast media might be higher by zs-3D real IR compared with t-3D real IR, especially in the cochlea. The possible reasons might be as follows: 1) Owing to the morphologic differences in the utricle, saccule, and cochlear duct, the cochlear endolymph was smaller than the vestibular endolymph on axial MR images. 2) The ZOOMit SPACE with an independent parallel transmission (pTX; Siemens Healthcare) system prevents the appearance of folds over artifacts and uses dynamic excitation pulses to achieve selective FOV (zoomed) imaging, thus reducing the acquisition time without introducing aliasing artifacts.26,27 Reduced FOV images negated the need to increase the number of phase-encoding steps and the penalty of an increased minimum measurement time,14 which leads to further improvement in image quality in terms of markedly reduced susceptibility artifacts. Less image blur and artifacts, higher spatial resolution, and faster screening were observed with zs-3D real IR compared with t-3D real IR. Thus, the zs-3D real IR images provided better separation of endo- and perilymph space in most cases.
The improved image quality with zs-3D real IR could potentially help more precisely identify mild EH in MD, especially for detecting cochlear EH (I). There were differences between zs-3D and t-3D real IR sequences in evaluating cochlear EH in MD. In a previous animal study, 1 of the 14 guinea pigs with apical turns of the cochlea EH was not found using t-3D real IR images.9 Similar to findings in this study, 7 patients with MD showed no evident cochlear EH by conventional t-3D real IR, but an exact cochlear EH (I) was found by zs-3D real IR. The better sensitivity shown by the zs-3D real IR sequence makes it preferable to the t-3D real IR for the detection of mild cochlear EH. This preference is of particular interest in early disease, when symptoms and signs normalize after a crisis stops. Moreover, the 2020 revised diagnostic criteria of Japan4 emphasized the importance of MR imaging for identifying EH to differentially distinguish certain MD and definite MD. Therefore, for suspicious MD with atypical clinical manifestations, the presence or absence of EH determined by MR imaging is very helpful for clinical diagnosis and treatment.
Furthermore, the present study found that the CNRs on both sides using the zs-3D real IR sequence were higher than those using the t-3D real IR sequence. The former sequence was more beneficial for visualizing EHs because it primarily reflected the differences in signals between the endo- and perilymphatic spaces. Similar to the CNR values, the SNR and SIR values of both sides were significantly higher on zs-3D real IR than on t-3D real IR because the zs-3D real IR sequence used a reduced FOV and more average times. The cochlea, endo- and perilymphatic spaces, and surrounding bone were differentiated well in images of the zs-3D real IR sequence compared with images of the t-3D real IR sequence.
Most interesting, the affected ears of 50 patients with MD showed higher perilymphatic enhancement compared with asymptomatic ears, consistent with the results of previously published studies.28⇓⇓⇓-32 SIR was a good indicator for the quantitative evaluation of contrast permeability, which can give hints about blood-labyrinth barrier damage.29 Meanwhile, the blood-labyrinth barrier may play a role in the process of EH in MD.33 Moreover, the progression of MD may be monitored using SIR. In this study, the perilymph in the images obtained by the zs-3D real IR sequence demonstrated an obviously higher signal compared with the images obtained by the t-3D real IR sequence. A previous study revealed that in 1 case with faint enhancement of the cochlea, the image quality was inadequate with t-3D real IR.10 Therefore, compared with t-3D real IR imaging, zs-3D real IR imaging may be more sensitive to contrast permeability, indicating possible blood-labyrinth barrier damage, which may be of great significance for the treatment choice of patients with MD.
This study has some limitations. The ROIs for the endolymph and perilymph were small. To ensure the reliability of the SI measured in the small ROI of the endolymph and perilymph and to diminish the measurement error, 2 radiologists determined every ROI twice for each patient and averaged the SIs of the 2 measurements for analysis. In addition, the oblique sagittal reference slices were obtained to enable the ROIs in the scala tympani and utricle to be accurately delineated on axial images.
CONCLUSIONS
The zs-3D real IR sequence provides higher CNR, SNR, and SIR values and is superior to conventional t-3D real IR sequences in reliably visualizing the endolymphatic space, precisely detecting EH, and sensitively revealing contrast permeability. The zs-3D real IR sequence may potentially replace conventional t-3D real IR sequences for the diagnosis of MD in the future.
Footnotes
Disclosure forms provided by the authors are available with the full text and PDF of this article at www.ajnr.org.
References
- Received December 6, 2022.
- Accepted after revision March 8, 2023.
- © 2023 by American Journal of Neuroradiology


