
Abstract
BACKGROUND AND PURPOSE: Identification of new MS lesions on longitudinal MR imaging by human readers is time-consuming and prone to error. Our objective was to evaluate the improvement in the performance of subject-level detection by readers when assisted by the automated statistical detection of change algorithm.
MATERIALS AND METHODS: A total of 200 patients with MS with a mean interscan interval of 13.2 (SD, 2.4) months were included. Statistical detection of change was applied to the baseline and follow-up FLAIR images to detect potential new lesions for confirmation by readers (Reader + statistical detection of change method). This method was compared with readers operating in the clinical workflow (Reader method) for a subject-level detection of new lesions.
RESULTS: Reader + statistical detection of change found 30 subjects (15.0%) with at least 1 new lesion, while Reader detected 16 subjects (8.0%). As a subject-level screening tool, statistical detection of change achieved a perfect sensitivity of 1.00 (95% CI, 0.88–1.00) and a moderate specificity of 0.67 (95% CI, 0.59–0.74). The agreement on a subject level was 0.91 (95% CI, 0.87–0.95) between Reader + statistical detection of change and Reader, and 0.72 (95% CI, 0.66–0.78) between Reader + statistical detection of change and statistical detection of change.
CONCLUSIONS: The statistical detection of change algorithm can serve as a time-saving screening tool to assist human readers in verifying 3D FLAIR images of patients with MS with suspected new lesions. Our promising results warrant further evaluation of statistical detection of change in prospective multireader clinical studies.
ABBREVIATIONS:
- PPV
- positive predictive value
- SDC
- statistical detection of change
Detection of new lesion activity on serial MR imaging is important for the disease diagnosis, monitoring, and evaluation of treatment response in patients with MS.1 In most clinical workflows, expert readers manually view baseline and follow-up brain MR images side-by-side on a PACS monitor to look for voxels with sufficiently large changes in image intensity and size to be considered a potentially clinically relevant new MS lesion.2 The state-of-the-art 3D T2-weighted FLAIR images, acquired in a routine clinical MS imaging protocol1 as recommended by the most recent clinical consensus,3 provide high 1-mm isotropic resolution and excellent soft-tissue contrast for lesion detection. However, native images obtained at 2 different time points are often imperfectly aligned due to differences in patient positioning and acquisition technique. Therefore, detecting new lesions by visual matching on the unregistered longitudinal images (when image registration tools are not readily available on the reading workstation) in the presence of noise is a time-consuming, error-prone, and highly observer-dependent task, even for human experts.4
A number of automated and semiautomated algorithms have been developed to overcome these challenges.5⇓-7 In the classic approach, serially acquired images are intensity-normalized and coregistered, from which a dissimilarity map (eg, obtained by subtraction) is calculated and then automatically segmented (eg, by thresholding or statistical inference methods) or reviewed by humans to yield the final lesion change mask.2,8⇓⇓⇓⇓⇓⇓-15 More recently, supervised deep learning–based convolutional neural network models have become the predominant approach.16⇓⇓⇓-20 Despite rapid advances in research, the detection sensitivity and specificity remain moderate on a voxel or lesion level (sensitivity and specificity; <0.8).4,7 We previously introduced the statistical detection of change (SDC) algorithm as an automated lesion-change detection tool to visually assist human readers. This algorithm applies an optimal binary change detector to the subtraction of 2 longitudinally registered FLAIR images to delineate brain areas with potential new lesions.14 The purpose of this study was to evaluate the improvement in the performance of subject-level detection by human readers when assisted by SDC, in comparison with the benchmark of human readers operating in the clinical workflow.
MATERIALS AND METHODS
Study Cohort
This was a retrospective longitudinal study conducted in a cohort of 200 patients with MS (145 women [72.5%], 55 men [27.5%]; mean age, 47.6 [SD, 10.9] years; range, 18.5–75.8 years) who were enrolled in an ongoing prospective imaging and clinical database for MS research. The database was approved by the local institutional review board (Judith Jaffe Multiple Sclerosis Center clinical and MR imaging database, IRB No. 0711009544; Weill Cornell Medicine), and written informed consent was obtained from all participants before their entry into the database. Consecutive patients who underwent 2 MR imaging scans between September 20, 2017, and July 7, 2021, with a mean follow-up interval of 13.2 (SD, 2.4) months (range, 7.5–24.8 months) were included. The final cohort consisted of 6 patients with clinically isolated syndrome, 181 with relapsing-remitting MS, 6 with primary-progressive MS, and 7 with secondary-progressive MS. The mean disease duration was 14.7 (SD, 7.4) years (range, 2.6–54.9 years), and the mean Expanded Disability Status Scale score was 1.3 (SD, 1.6) (range, 0.0–7.0; median, 1.0; interquartile range, 2.0). A total of 183 patients (91.5%) were treated with disease-modifying therapies. Of these, 88 (48.1%) received treatment by injection; 60 (32.8%), orally; and 35 (19.1%), by infusion.
MR Imaging Examinations
All patients were scanned on 3T MR imaging scanners (Magnetom Skyra and Vida; Siemens) using a product 20-channel head/neck coil. The scanning protocol included pre- and postgadolinium 3D T1-weighted MPRAGE sequences for anatomic definition and detection of active lesions, respectively, and 3D T2-weighted FLAIR and a sampling-perfection with application optimized contrasts by using different flip angle evolution (SPACE; Siemens) sequence for lesion identification, using the following imaging parameters: 1) 3D sagittal T1-weighted MPRAGE: TR/TE/TI = 2300.0/2.3/900 ms, flip angle = 8°, bandwidth = 200 Hz/pixel, acquired voxel size = 1.0-mm isotropic, number of slices = 176, parallel imaging factor = 2.0, scan time = 5 minutes 21 seconds; 2) 3D sagittal T2-weighted FLAIR SPACE: TR/TE/TI = 7600/448/2450 ms, flip angle = 90°, bandwidth = 781 Hz/pixel, echo spacing = 3.42 ms, turbo factor = 284, acquired voxel size = 1.0-mm isotropic, number of slices = 176, parallel imaging factor = 4.0, scan time = 5 minutes 6 seconds.
Image Postprocessing
At each time point, T1-weighted and FLAIR images were brain-extracted using the FMRIB Software Library (FSL) BET command (FSL Brain Extraction Tool (http://fsl.fmrib.ox.ac.uk/fsl/fslwiki/BET)21 and corrected for spatial inhomogeneity and segmented into gray matter, white matter, and CSF masks using the FSL FAST command (https://fsl.fmrib.ox.ac.uk/fsl/fslwiki/FAST).22 The FLAIR image was then linearly registered to the T1-weighted structural image using the FSL FLIRT command (Linear Image Registration Tool; FLIRT; http://www.fmrib.ox.ac.uk/fsl/fslwiki/FLIRT)23 with 6 df (rigid body transformation). For longitudinal registration, the baseline and follow-up brain-extracted T1-weighted images were first linearly aligned to a half-way space9 using the Advanced Normalization Tools algorithm (http://stnava.github.io/ANTs/) with 12 df (rigid body and affine transformation),24 followed by registration of the corresponding FLAIR images into the same half-way space using the concatenated transformation matrices obtained from the previous steps. The purpose of spatially aligning longitudinal images to the half-way space was to ensure that the degree of blurring introduced by the registration algorithm was similar among images, which improves image subtraction.
Next, the SDC algorithm,14 implemented in Matlab R2020 (MathWorks) on a Linux Ubuntu 18.04 computer equipped with a 64-bit Intel Core i9-9940X 3.30 GHz CPU and 128 GB of RAM, was applied to the registered and intensity-normalized FLAIR images in the half-way space to detect brain voxels with positive signal change (indicating new lesions or growth of existing lesions). Briefly, for each voxel, the SDC test statistic was calculated from the FLAIR subtraction image over a 3-voxel connected neighborhood and compared with a threshold (chosen to achieve a false-positive rate of 0.0001) to generate a binary positive change mask. Additional constraints were imposed on the minimum lesion volume (15 mm3) and location (lesions located within 2 voxels of the CSF border and the GM/WM tissue border had to be part of a larger lesion that extended outside this border) to reduce the number of false-positives. The constraint on the lesion location was useful for eliminating the thin layer of bright voxels lining the ventricles on the FLAIR image and also for dealing with spurious voxels at the tissue edge on the FLAIR difference image due to imperfect subtraction.
Finally, the detected changed voxels were registered back to the follow-up FLAIR image. A binary mask was generated by the SDC algorithm, which was overlaid on the baseline and follow-up FLAIR image pair to delineate potential new lesions with a red box (Fig 1) to facilitate subsequent visual confirmation of the detected new lesions by human readers. The processing time of the SDC algorithm was recorded in 5 randomly chosen subjects.

Longitudinal axial FLAIR images acquired from a patient with MS approximately 10.5 months apart, showing an example of 3 new lesions detected by human readers who were assisted visually by the SDC algorithm, which delineates brain areas containing potential new lesions for human confirmation (red boxes) (referred to as Reader + SDC method).
Visual Identification of New Lesions
The registered baseline and follow-up FLAIR images, along with the red boxes marking the potential new lesions detected by SDC (Fig 1), were displayed side-by-side in the axial plane using ITK-SNAP Version 3.8 software (www.itksnap.org).25 Two expert readers, a board-certified neuroradiologist with 16 years of experience and an MR imaging physicist with 20 years of experience, both of whom were blinded to clinical and other imaging information, jointly reviewed the FLAIR images with visual assistance from SDC-detected areas of lesion growth to identify new lesions on the basis of consensus (Reader + SDC method). The readers assessed all available FLAIR images both inside and outside the areas of change detected by SDC algorithm. A lesion was considered as new if it could be seen on the follow-up FLAIR image but could not be ascertained on the baseline FLAIR image.
For comparison, the official radiology reports created by board-certified neuroradiologists at the time of the clinical encounters were retrieved from the EPIC electronic medical record system (Epic Systems) and manually parsed for the mention of at least 1 new lesion. In our clinical workflow occurring in the context of a routine outpatient imaging practice affiliated with a large academic health system, new lesions are detected on the basis of the visual interpretation of baseline and follow-up native brain images acquired with FLAIR as well as T1-weighted, T2-weighted, and gadolinium-enhanced T1-weighted sequences (hereafter referred to as the Reader method). In this setting, faculty neuroradiologists, all of whom are board-certified, reviewed these brain MR imaging studies as they appeared in real time on a clinical worklist. Cases were variably interpreted alongside radiology clinical trainees (diagnostic radiology residents and/or neuroradiology fellows) with the benefit of full access to the electronic health record and all patient records. During the time period of this study (approximately 4 years), all image interpretation was performed on a PACS system. The total number of new lesions and their precise anatomic locations were variably recorded in the reports, subject to the clinical scenario and preferences of the interpreting radiologist. Therefore, in this study, lesion detection outcome for the 3 methods (Reader, SDC, and Reader + SDC) was defined at a subject level as a binary indicator of having at least 1 new lesion.
Statistical Analysis
All statistical analyses were performed in R statistical and computing software, Version 4.1.2 (http://www.r-project.org).26 We were interested in the detection of ≥1 new lesion at a subject level. A change in size of existing lesions (growth or shrinkage) and lesions of <15 mm3 was excluded from the analysis. This minimum lesion volume cutoff was calculated assuming a spherical lesion shape with a diameter of 3 mm (3 voxels on our FLAIR image) using the formula Vmin = πd3 / 6 = 14.1 mm3, which is in accordance with the currently accepted minimum lesion dimension on MR imaging.1 For each subject and each method (Reader, SDC, and Reader + SDC), a binary indicator of the incidence of new lesions was created. Contingency tables at a subject level were investigated, and sensitivity, specificity, and positive predictive value (PPV) were assessed using the Reader + SDC method as a reference. Exact binomial 95% CIs were calculated for these measures.27 Agreement among all the methods was calculated with nonparametric bootstrapped 95% CIs.28 For the Reader and SDC methods, the Breslow-Day test29 was used to test whether the OR was the same for the subject group imaged on the same scanner versus the group imaged on 2 different scanners.
RESULTS
All 200 pairs of baseline and follow-up FLAIR scans were interpretable. Of these, 80 pairs (40.0%) were acquired on the same MR imaging scanner. The fully-automated SDC algorithm detected 86 subjects (43.0%) with at least 1 potential new lesion. The semiautomated Reader + SDC method, in which 2 readers identified new lesions by comparing the 2 longitudinally registered FLAIR images with visual assistance from SDC showing potential new lesions (Fig 1), detected 41 subjects (20.5%) with at least 1 new lesion. After excluding lesions of <15 mm3, Reader + SDC found 30 individuals (15.0%) with new lesions. In comparison, the traditional Reader method, performed by radiologists in the routine clinical workflow, identified 20 subjects (10.0%) with at least 1 new lesion.
Table 1 shows the contingency table for subject-level detection of new lesions on FLAIR images obtained by the Reader and SDC methods using the Reader + SDC method as a reference (note that lesions of <15 mm3 were excluded from the statistical analysis for SDC and Reader + SDC methods, while the Reader method did not provide information on lesion size). In 200 cases of MS, Reader failed to detect new lesions in 14/30 individuals, resulting in a moderate sensitivity of 0.53 (95% CI, 0.34–0.72), with an excellent specificity of 0.98 (95% CI, 0.94–0.99) and a good PPV of 0.80 (95% CI, 0.56–0.94). Of these 14 cases, 13 (92.9%) had only 1 new lesion and one (7.1%) had 2 new lesions. Most of these lesions were either periventricular (9/15, 60%) or in the central semiovale (5/15, 33%). The 4 subjects who were identified as having at least 1 new lesion by Reader but not by Reader + SDC in Table 1 were all found to have new lesions less than the 15-mm3 cutoff. In comparison, SDC was able to detect all 30/30 patients with at least 1 new lesion, achieving a perfect sensitivity of 1.00 (95% CI, 0.88–1.00), though at the cost of a lower specificity of 0.67 (95% CI, 0.59–0.74) and a lower PPV of 0.35 (95% CI, 0.25–0.46). The agreement on a subject level was found to be 0.91 (95% CI, 0.87–0.95) between Reader + SDC and Reader; 0.72 (95% CI, 0.66–0.78) between Reader + SDC and SDC; and 0.64 (95% CI, 0.57–0.71) between Reader and SDC.
Contingency table comparing the subject-level detection of new lesions obtained from longitudinal FLAIR images of 200 patients with MS using the Reader (manual), SDC (fully automated), and Reader + SDC (semiautomated) methodsa
Table 2 shows the contingency tables for subject-level detection of new FLAIR lesions in the 2 groups of subjects who were imaged on the same scanner (80/200) and on 2 different scanners (120/200). Reader was found to perform better on FLAIR images acquired on the same scanner compared with those acquired on different scanners (sensitivity, 0.67; 95% CI, 0.38–0.88, versus 0.40; 95% CI, 0.16–0.68; specificity, 1.00; 95% CI, 0.94–1.00, versus 0.96; 95% CI, 0.91–0.99; and PPV 1.00; 95% CI, 0.69–1.00, versus 0.60; 95% CI, 0.26–0.88). While SDC detected 15/15 patients with at least 1 new lesion (sensitivity, 1.00; 95% CI, 0.78–1.00) in both groups, SDC correctly detected 49/65 patients without a new lesion (specificity, 0.75; 95% CI, 0.63–0.85) in the group scanned on the same scanner but only 65/105 patients without a new lesion (specificity, 0.62; 95% CI, 0.52–0.71) in the group scanned on 2 different scanners. Using the Breslow-Day test, we found that the OR for Reader versus Reader + SDC differed across the group imaged on the same scanner and the one imaged on 2 different scanners (P = .036), indicating a different performance. On the other hand, we did not find a statistically significant difference in the OR for the SDC versus Reader + SDC case with regard to scanner change (P = .762).
Contingency table comparing the subject-level detection of new lesions obtained from longitudinal FLAIR images acquired on the same MR imaging scanner from 80 patients with MS and those acquired on 2 different scanners from 120 patients with MS using the Reader (manual), SDC (fully automated), and Reader + SDC (semiautomated) methods
Figure 2 shows examples of 4 new lesions of various sizes and locations from 4 different subjects with MS that were identified by SDC and confirmed by Reader + SDC but were not detected by Reader according to the radiology report. Figure 3 shows examples of 2 new punctate lesions, both of which were gadolinium-enhancing, that were identified by Reader in the clinical workflow but were not detected by SDC and Reader + SDC after applying a minimum lesion volume threshold of 15 mm3.

Examples of new lesions varying in size and location on longitudinal FLAIR images obtained from 4 different subjects with MS. These lesions were initially identified by SDC (marked by red boxes) and later confirmed by the Reader + SDC method but were not detected by the Reader method using the conventional radiology workflow.

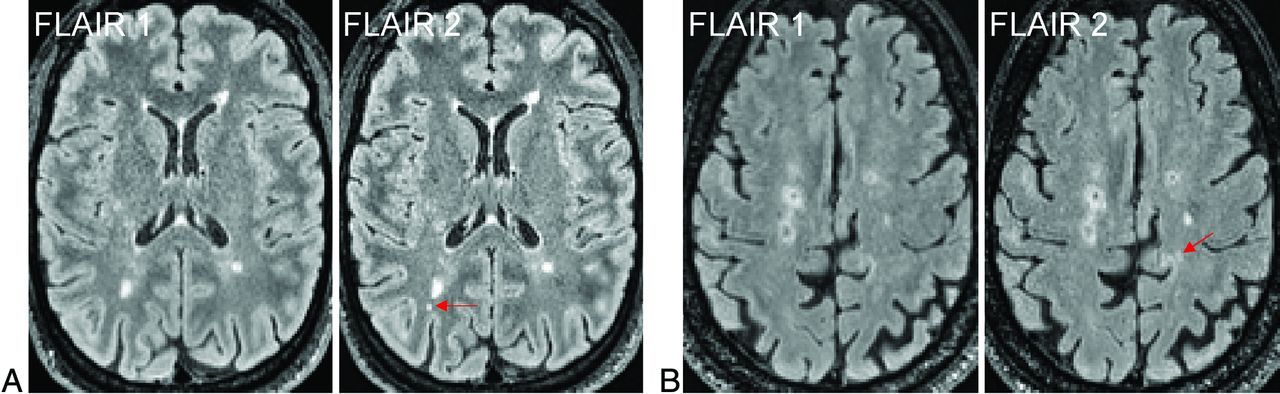
Examples of new punctate lesions (arrows) on longitudinal FLAIR images acquired from 2 different subjects with MS, identified by the Reader method in the clinical workflow but not detected by the SDC and Reader + SDC methods after applying a minimum lesion volume cutoff of 15 mm3. Both lesions were enhancing on the postgadolinium T1-weighted images.
On average, the longitudinal FLAIR registration took 120.6 (SD, 10.7) seconds, and the SDC new lesion detection took 2.5 (SD, 0.3) seconds per case.
DISCUSSION
In this single-center study evaluating the utility of the automated SDC algorithm in assisting human readers to detect new lesions on longitudinal FLAIR images, we found that SDC was able to provide a perfect new lesion-detection sensitivity on a subject level. SDC achieved this excellent level of detection sensitivity while providing a moderate subject-level specificity of 0.67 (meaning about 2 of every 3 subjects without new lesion activity were correctly classified). These operating characteristics allow SDC to be used as a valuable screening tool and could accelerate the interpretation time of cases in which no new lesions are identified by SDC. In our study, for example, 114 of 200 patients had no new lesions on follow-up confirmed by SDC, suggesting that a more rapid expert human review of these cases (57% of our entire cohort) may be feasible. Such an increase in efficiency may enable expert human readers to allocate more time to interpret MR imaging cases flagged by SDC as being potentially positive for new lesions.
In the conventional radiology workflow, detecting new lesions that formed between 2 longitudinal scans of patients with MS is often performed by radiologists and other clinicians manually on a PACS monitor by comparing a large number of paired-but-imperfectly aligned FLAIR images. This approach is often time-consuming, mentally demanding, and error-prone, especially if there is a substantial image misalignment due to the difference in head orientation between the 2 scans. SDC overcomes these challenges by providing an automated detection of potential new lesions, which are then visually indicated to the reader on a pair of longitudinally registered images (Fig 1). Conceptually, SDC is formulated as an optimal change detector applied to the subtraction image, which can be proved mathematically by the Neyman-Pearson lemma to provide the best detection power for a given false-positive rate.30
By design, SDC mimics a human reader in 2 key aspects: First, it applies an adaptive intensity threshold to the subtraction image on the basis of the level of noise in the image. For example, the threshold for the longitudinal signal change is automatically increased by SDC for more noisy images, which can be regarded as equivalent to setting a higher level of trust as often performed by a human reader when dealing with noise. Second, SDC uses signal from voxels in a local neighborhood to calculate the test statistic, helping to increase the detection reliability. Similar to change detection by humans, spatially spurious signals on the subtraction image are encoded by the algorithm to have a lower likelihood of being identified as true change. By virtue of being capable of operating at a very high sensitivity and a reasonable specificity, SDC enables the new lesion identification problem to be shifted from the traditionally difficult task of locating new lesions on unmarked images to a much easier task of confirming true-positives and eliminating false-positives in areas already marked by SDC. Therefore, SDC has a great potential to shorten new-lesion detection time while reducing reader fatigue.
Several studies have demonstrated the benefits of detecting new lesions on a subject level on longitudinally registered or subtracted standard 1-mm isotropic 3D FLAIR images. A study by Galletto Pregliasco et al,15 performed in 94 patients with MS, showed that using an automated coregistration-fusion method improved the detection rate of subjects with at least 1 new lesion from 46% to 59%. In another study conducted by Eichinger et al,13 in 106 patients with MS, 58% of subjects were identified as having at least 1 new lesion on the FLAIR subtraction image, with a similar proportion (59%) identified using the conventional reading method. In this study of 200 patients with MS, we saw an improvement from 8% by Reader to 15% by Reader + SDC in the subject-level detection rate using a minimum lesion volume threshold of 15 mm3. The observed relatively rare event of a new lesion occurring in our cohort is likely related to different patient characteristics.
Compared with the emerging neural network–based deep learning approaches for new lesion detection, the SDC algorithm does not require data labeling and specialized hardware (such as a powerful graphics processing unit) for network training. SDC can also be used as a computer-assisted detection and segmentation tool to help humans create labeled image data for network training more efficiently. In addition to the ease of implementation, SDC provides relatively fast processing of the subtraction image, taking only a few seconds per case using our Matlab implementation, which can be further improved for interactive use by a C/C++ implementation. However, the longitudinal registration step to generate the subtraction image takes about 2 minutes per case in our processing pipeline. The development of rapid image registration algorithms31⇓-33 will, therefore, be essential for a successful deployment of SDC in a routine interactive workflow. Alternatively, SDC can be implemented as part of the image-reconstruction process, assuming that images from the prior study are available on the scanner. Further studies are needed to evaluate the clinical feasibility of these approaches.
The coregistration steps involved in the SDC processing pipeline are key elements of the SDC approach and offer a highly precise registration not possible in routine image-interpretation software solutions embedded in clinical PACS systems. In our pipeline implementation, we chose to perform longitudinal FLAIR image registration by registering the image to the T1-weighted half-space for 2 reasons: 1) The T1-weighted image has the same resolution (1-mm isotropic) but much better GM/WM contrast than the FLAIR image, and 2) in our data, the T1-weighted image has less noise than the FLAIR image because T1-weighted imaging was acquired with an acceleration factor of 2, while FLAIR was acquired with an acceleration factor of 4 (to keep the scan time reasonable). Consequently, the longitudinal registration was found to be generally more accurate when using T1-weighted images rather than FLAIR images. While a 1-mm isotropic 3D T1-weighted sequence is part of the MS brain MR imaging protocol recommended by the most recent clinical consensus,3 performing direct registration between the 2 longitudinal FLAIR images is a viable option when such T1-weighted images are not available.
This study has several limitations. First, the ground truth was determined on the basis of expert readings from only 1 experienced board-certified neuroradiologist in consensus with an MR imaging physicist with expertise in MS brain image analysis. Furthermore, because these readers were aware of the use of SDC, our study design was unable to fully eliminate the possibility of reader bias. While this study design is appropriate for the current early-stage evaluation of SDC technology development, the diagnostic performance metrics such as sensitivity and specificity reported in this study require further clinical validation in future multireader multicase studies34 involving multiple board-certified radiologists and using a clinical consensus as the criterion standard. This is a key validation step to ensure that image-analysis techniques are ready for regulatory approval and clinical adoption.
Second, intracortical and subpial GM lesions were not considered because these lesions are difficult to visualize reliably with existing routine 3T imaging sequences, including FLAIR.35 Third, in the current study design, the Reader method was performed in the routine clinical workflow by readers different from those involved in the Reader + SDC method. These differences make it difficult to determine the clinical significance, if any, of discrepancies in new lesion identification noted between the clinical radiologic report and retrospectively performed SDC-enhanced readings. For example, the radiologist issuing the clinical report in the Reader method had real-time access to the electronic health record and contrast-enhanced imaging while being subject to time constraints imposed in the clinical workflow and being responsible for total brain MR imaging interpretation, not only new lesion detection on FLAIR.
While our study design allows a direct comparison of SDC with the radiology report, regarded as a clinically established benchmark, future work will be focused on integrating the SDC algorithm into the clinical workflow, which will allow prospective comparison studies to be performed in a real-world setting. In the context of active MS, this will also enable the comparison of gadolinium-based T1-weighted sequences with emerging noncontrast approaches for new acute lesion detection such as those combining FLAIR subtraction with quantitative susceptibility mapping.36 Fourth, a minimum lesion volume cutoff of 15 mm3 was used to mitigate the effect of noise on the false-positive rate of the SDC algorithm. Such punctate MS lesions are often considered inconsequential,1 though further evidence on their role in the disease progression and outcome may be needed. Fifth, the PACS system used for clinical interpretations was not equipped with the capability to adjust for differences in scan angle or patient positioning or to coregister 3D images to enable section-by-section comparisons accurately. This capability is being enhanced in more modern PACS systems but was not readily available in the version of the PACS system used during the time of the study scanning. Sixth, validation on FLAIR images acquired on MR imaging scanners from other vendors or with different acquisition parameters is very important for successful clinical translation of SDC and will be addressed in a future study. Finally, linear longitudinal brain registration was used in this study, which was deemed sufficiently accurate for the annual follow-up interval in our cohort but may not capture nonlinear changes in the brain morphology during a longer interscan period. The use of a deformable motion model in the registration algorithm may be considered in such scenario.12,24
CONCLUSIONS
The SDC algorithm can serve as a time-saving screening tool to assist human readers in verifying 3D FLAIR images of patients with MS with suspected new lesions. Our promising results warrant further evaluation of SDC in prospective multireader clinical studies.
Footnotes
M. Homssi and E.M. Sweeney contributed equally to this work.
Paper previously presented, in part, at: Annual Meeting of the American Society of Neuroradiology, May 16-28, 2022; New York, New York.
This work was supported in part by grants from the National Institutes of Health (R01 NS105144, R01 NS090464, R01 NS104283) and the National Multiple Sclerosis Society (RR-1602-07671).
Disclosure forms provided by the authors are available with the full text and PDF of this article at www.ajnr.org.
Indicates open access to non-subscribers at www.ajnr.org
References
- Received February 3, 2023.
- Accepted after revision April 3, 2023.
- © 2023 by American Journal of Neuroradiology


