
Abstract
BACKGROUND AND PURPOSE: The T2-FLAIR mismatch sign on MR imaging is a highly specific imaging biomarker of isocitrate dehydrogenase (IDH)-mutant astrocytomas, which lack 1p/19q codeletion. However, most studies using the T2-FLAIR mismatch sign have used visual assessment. This study quantified the degree of T2-FLAIR mismatch using digital subtraction of fluid-nulled T2-weighted FLAIR images from non-fluid-nulled T2-weighted images in human nonenhancing diffuse gliomas and then used this information to assess improvements in diagnostic performance and investigate subregion characteristics within these lesions.
MATERIALS AND METHODS: Two cohorts of treatment-naïve, nonenhancing gliomas with known IDH and 1p/19q status were studied (n = 71 from The Cancer Imaging Archive (TCIA) and n = 34 in the institutional cohort). 3D volumes of interest corresponding to the tumor were segmented, and digital subtraction maps of T2-weighted MR imaging minus T2-weighted FLAIR MR imaging were used to partition each volume of interest into a T2-FLAIR mismatched subregion (T2-FLAIR mismatch, corresponding to voxels with positive values on the subtraction maps) and nonmismatched subregion (T2-FLAIR nonmismatch corresponding to voxels with negative values on the subtraction maps). Tumor subregion volumes, percentage of T2-FLAIR mismatch volume, and T2-FLAIR nonmismatch subregion thickness were calculated, and 2 radiologists assessed the T2-FLAIR mismatch sign with and without the aid of T2-FLAIR subtraction maps.
RESULTS: Thresholds of ≥42% T2-FLAIR mismatch volume classified IDH-mutant astrocytoma with a specificity/sensitivity of 100%/19.6% (TCIA) and 100%/31.6% (institutional); ≥25% T2-FLAIR mismatch volume showed 92.0%/32.6% and 100%/63.2% specificity/sensitivity, and ≥15% T2-FLAIR mismatch volume showed 88.0%/39.1% and 93.3%/79.0% specificity/sensitivity. In IDH-mutant astrocytomas with ≥15% T2-FLAIR mismatch volume, T2-FLAIR nonmismatch subregion thickness was negatively correlated with the percentage T2-FLAIR mismatch volume (P < .0001) across both cohorts. The percentage T2-FLAIR mismatch volume was higher in grades 3–4 compared with grade 2 IDH-mutant astrocytomas (P < .05), and ≥15% T2-FLAIR mismatch volume IDH-mutant astrocytomas were significantly larger than <15% T2-FLAIR mismatch volume IDH-mutant astrocytoma (P < .05) across both cohorts. When evaluated by 2 radiologists, the additional use of T2-FLAIR subtraction maps did not show a significant difference in interreader agreement, sensitivity, or specificity compared with a separate evaluation of T2-FLAIR and T2-weighted MR imaging alone.
CONCLUSIONS: T2-FLAIR digital subtraction maps may be a useful, automated tool to obtain objective segmentations of tumor subregions based on quantitative thresholds for classifying IDH-mutant astrocytomas using the percentage T2 FLAIR mismatch volume with 100% specificity and exploring T2-FLAIR mismatch/T2-FLAIR nonmismatch subregion characteristics. Conversely, the addition of T2-FLAIR subtraction maps did not enhance the sensitivity or specificity of the visual T2-FLAIR mismatch sign assessment by experienced radiologists.
ABBREVIATIONS:
- AUC
- area under curve
- IDHm
- isocitrate dehydrogenase mutant
- IDHm-A
- isocitrate dehydrogenase mutant astrocytoma
- IDHm-O
- isocitrate dehydrogenase mutant oligodendroglioma
- IDHwt
- isocitrate dehydrogenase wild-type
- NAWM
- normal-appearing white matter
- ROC
- receiver operating characteristic
- TCIA
- The Cancer Imaging Archive
- T2FM
- T2-FLAIR mismatch
- T2FNM
- T2-FLAIR nonmismatch
- VOI
- volume of interest
The prognosis and management of human gliomas are dependent on the tumor molecular classification, particularly isocitrate dehydrogenase (IDH) mutational status.1,2 While IDH wild-type (IDHwt) tumors have poor prognosis2 and warrant aggressive therapy, IDH-mutant (IDHm) tumors have a much more favorable prognosis.2,3 Treatment plans for IDHm gliomas can include observation following surgery3 to balance treatment-related morbidity from chemoradiation and may also soon include mutant IDH-inhibitor targeted therapies, which have recently shown significant benefit in a Phase III clinical trial.4,5 However, because the molecular classification of gliomas requires histologic analyses, the inherently invasive nature of sampling brain tumor tissue either from biopsy or during tumor resection may also support the need for noninvasive methods to molecularly classify human gliomas in the up-front setting.
The presence of the T2-FLAIR mismatch sign (T2FM sign) on MR imaging, first described by Patel et al,6 has become a well-known and validated7⇓⇓⇓⇓⇓-13 noninvasive imaging biomarker with ∼100% specificity albeit low sensitivity for diagnosing IDHm astrocytomas (1p/19q-intact; IDHm-A) and ruling out IDHm oligodendrogliomas (1p/19q-codeleted; IDHm-O) and IDHwt gliomas. Patel et al originally described this imaging biomarker as the “presence or absence of complete/near-complete hyperintense signal on T2WI, and relatively hypointense signal on FLAIR except for a hyperintense peripheral rim,”6 and the authors reported a specificity of 100% in the 2 cohorts they tested and sensitivities of 22.0% and 45.5%.6 Other subsequent studies have also noted 100% specificity7,8 along with some instances of false-positives resulting in specificities ranging from 76.5% to 98%.9⇓⇓-12 There is also the potential for less conservative definitions of the T2FM sign, such as Lasocki et al8 proposing that a reader-estimated ≥25% T2FM volume was sufficient to assign as T2FM sign positivity, which still yielded 100% specificity with 63% sensitivity;8 Li et al14 proposing simply a T2-weighted FLAIR hyperintense rim with a hypointense core regardless of appearance on T2-weighted MR imaging, which also yielded 100% specificity with 71.3% sensitivity; and Lee et al15 proposing a partial T2FM sign in grade 4 IDHm gliomas when assessing only grade 4 gliomas, which yielded 99.6% specificity with 26.4% sensitivity. Less conservative definitions have also been proposed to explain the findings of Juratli et al10 of 76% specificity with 73% sensitivity.13
However, despite the inherently quantitative nature of the T2FM sign based on the relative extent of T2FM volume within a tumor, to our knowledge, studies on the T2FM sign have mostly remained qualitative on the basis of reader studies. A prior study by Mohammed et al16 has previously used a geographically-weighted regression-based classification model that resulted in the classification of IDHm-A with very high sensitivity and specificity. Another study by Lee et al17 used a “hot-spot” assessment of T2FM areas by assessing relative T2-weighted and T2-weighted FLAIR hyperintensity in the T2FM core region for glioma classification,17 but the study did not assess the whole-tumor quantification of T2FM volume. Quantifying T2FM volume could be valuable to assess whether there is a quantitative percentage T2FM volume that is analogous to T2FM sign positivity for achieving 100% specificity for IDHm-A, such as the reader-estimated ≥25% T2FM volume of Lasocki et al8 or other volumetric thresholds.
As a result, there remains a continued need for methods for visualization and volumetric quantification of T2FM to specifically study IDHm-A exhibiting the T2FM sign. For example, IDHm-A with the T2FM sign are known for intratumoral heterogeneity because the T2FM core subregion is known for the presence of microcysts or enlarged intercellular space on histology.12,18 These findings may also demonstrate the need for a reliable method to study IDHm-A with the T2FM sign specifically in the context of characterizing T2FM and T2-FLAIR nonmismatch (T2FNM) subregion differences. One such method could be subtraction maps of coregistered MR images, which have already shown utility for T1 post-/precontrast MR imaging for assessing contrast-enhancing tumor volume in glioblastomas.19 While similar mathematics of relative T2-weighted and T2-weighted FLAIR hyperintensity signal has been used to study the T2FM sign only in the mismatched core region,17 to our knowledge, whole-brain subtraction maps have not yet been applied for T2-weighted and T2-weighted FLAIR images to quantify the extent of T2FM from a whole-tumor, volumetric perspective.
The present study explored the use of T2-weighted and T2-weighted FLAIR subtraction maps to study T2FM in nonenhancing gliomas. We hypothesized the following: 1) There is a tumor percentage T2FM volume threshold based on subtraction map values that can classify IDHm-A with 100% specificity; 2) the percentage T2FM volume may be associated with tumor volume and tumor grade; and 3) the visual evaluation of T2-FLAIR subtraction maps would improve the sensitivity, specificity, and interreader agreement of the T2FM sign in a reader study.
MATERIALS AND METHODS
Patient Selection
Two cohorts of patients with gliomas who underwent preoperative MR imaging from 2 different institutions were screened for analysis: 1) a test cohort from The Cancer Imaging Archive (TCIA) University of California San Francisco Preoperative Diffuse Glioma MR imaging dataset (UCSF-PDGM) (n = 495 total)20⇓-22 and 2) a validation cohort consisting of patients at our institution enrolled in prospective trials (institutional review board Nos. 14–001261, 21–000514, 21–002112) and/or assessed in a prior study23 (n = 150 total). All patients in the institutional cohort provided written informed consent. Patients with the following inclusion criteria were included in the study: 1) nonenhancing, adult-type diffuse glioma according to the World Health Organization 2021 classification,1 2) no prior pharmacologic or radiation treatment, 3) no prior surgery except for biopsy, 4) known IDH-mutational status, 5) if IDH-mutant, known 1p/19q status, and 6) supratentorial location (Online Supplemental Data). All patients in the TCIA UCSF-PDGM were treatment-naïve except for biopsy. The tumor molecular diagnosis ground truth was based on histopathologic analysis. IDH status was determined by targeted next-generation DNA sequencing for the TCIA cohort24 and by polymerase chain reaction sequencing and/or immunohistochemistry for the institutional cohort.25 1p/19q codeletion status was determined using fluorescence in situ hybridization for both cohorts. A total of 70 patients from the TCIA UCSF-PDGM and 34 patients from the institutional cohort were included in the study (Online Supplemental Data). Two distinct lesions in the left and right hemispheres of 1 patient in the TCIA cohort were assessed separately. Patient data are summarized in Table 1.
Patient data
Image Acquisition and Preprocessing
Both cohorts were scanned using 3T scanners (TCIA: GE Healthcare Discovery 750; institutional: Siemens Prisma, Skyra, Trio, Vida) and underwent standardized protocols for T2-weighted and T2-weighted FLAIR MR imaging: TCIA, 3D T2-weighted sagittal FSE: TR/TE = 2200/100 ms; section thickness = 1.2 mm; in-plane resolution = 1 × 1 mm;21 TCIA, 3D T2-weighted FLAIR coronal FSE: TR/TE/TI = 5700/115/1650 ms; section thickness = 1.2 mm; in-plane resolution = 1 × 1 mm;21 institutional, 2D T2-weighted axial FSE: TR = 4381–8450 ms; TE = 86–116 ms; section thickness = 3mm; in-plane resolution = 0.31–0.94 × 0.31–0.94 mm; institutional, 3D T2-weighted sagittal FSE (n = 1 patient): TR/TE = 3200/412 ms; section thickness = 1 mm; in-plane resolution = 0.98 × 0.98 mm; institutional, T2-weighted FLAIR 2D axial: TR = 7080–9980 ms; TE = 81–89 ms; TI = 2500 ms; section thickness = 3 mm; in-plane resolution = 0.47–0.94 × 0.47–0.94 mm.
The provided TCIA data were already preprocessed as follows:20,21 scans were registered to the 3D T2-weighted FLAIR image (Advanced Normalization Tools software package; http://stnava.github.io/ANTs/) and then skull-stripped using the open-source, deep-learning algorithm brain_mask (https://www.github.com/ecalabr/brain_mask/). The institutional data were preprocessed similarly: scans were registered to the 3D T1-postcontrast image (tkregister2; FreeSurfer https://surfer.nmr.mgh.harvard.edu/fswiki/tkregister226 and the FMRIB Linear Image Registration Tool, FLIRT, https://fsl.fmrib.ox.ac.uk/fsl/fslwiki/FLIRT/UserGuide)27 and then skull-stripped using the open-source, deep-learning algorithm HD-BET28 (https://github.com/MIC-DKFZ/HD-BET).
T2-FLAIR Subtraction Maps and Tumor Imaging Analysis
T2-FLAIR subtraction maps were generated as follows: 1) skull-stripped T2-weighted MR imaging was further precisely registered to skull-stripped T2-weighted FLAIR MR imaging using FLIRT; 2) T2-weighted MR imaging and T2-weighted FLAIR MR imaging were normalized using z score normalization and then by performing voxelwise subtraction by the mean T2-weighted and T2-weighted FLAIR signal intensity, respectively, of the normal-appearing white matter (NAWM) using 3 spheric volumes of interest (VOIs) within the contralesional superior centrum semiovale, avoiding T2/FLAIR hyperintensities as described previously23,29 so that the resulting signal intensity in the NAWM would be ∼0; and then 3) performing voxelwise subtraction of the normalized T2-weighted MR imaging and the normalized T2-weighted FLAIR MR imaging (normalized T2-weighted minus normalized T2-weighted FLAIR). Tumor VOIs of the T2-weighted hyperintensity of the institutional cohort were created by a lab member with 2 years of experience in tumor-segmentation analysis (N.S.C.) using a semiautomated thresholding method involving Analysis of Functional NeuroImages (AFNI) software30 (https://afni.nimh.nih.gov) as previously described.19,31 The provided TCIA segmentations were also refined using this thresholding technique for consistency. Voxels corresponding to CSF and macroscopic cysts (characterized as having round shape, well-defined borders, CSF-like signal intensity, and lacking wall enhancement) were excluded from the tumor VOIs. All final tumor VOIs were inspected by a radiologist (S.O.) with 11 years of experience in neuroimaging analysis who was blinded to the tumor molecular diagnosis.
The whole-tumor VOIs were then split using the T2-FLAIR subtraction maps into T2FM (positive values in the T2-FLAIR subtraction map) and T2FNM (negative values in T2-FLAIR subtraction map) subregion VOIs using a consistent threshold of zero. Thus, tumor T2FM subregions would be defined as regions where the normalized T2-weighted MR imaging signal intensity is greater than the normalized T2-weighted FLAIR signal intensity, while the remaining voxels in the tumor mask would be assigned to the T2FNM subregion. T2FM and T2FNM subregion volumes were obtained. Tumor percentage T2FM volume (% T2FM volume) was calculated as T2FM subregion volume divided by total tumor volume. To assess the potential impacts of slight image misregistration on the percentage T2FM volume calculation, we generated 2 deliberately misregistered T2-FLAIR subtraction maps using the AFNI Nudge Dataset plugin (https://afni.nimh.nih.gov/)—one from a 2-voxel posterior shift of the coregistered T2-weighted MR imaging and one from 2° counterclockwise shift of the coregistered T2-weighted MR imaging—and tumor VOIs were split again into T2FM and T2FNM subregions. The median thickness of the peripheral T2FNM subregion for tumors exhibiting T2FM subregions was calculated using AFNI software by creating a 1-voxel-wide border segmentation of the T2FNM subregion VOI (3dDepthMap, rimify; https://afni.nimh.nih.gov/pub/dist/doc/program_help/3dDepthMap.html) followed by manually removing nonperipheral voxels and then creating a 3D depth map from the T2FM-subregion voxels after cluster filtering T2FM-subregion voxels at a threshold of >30 voxels. The external border segmentation was then encoded with the distance from the T2FM subregion via voxelwise multiplication of the depth map (Fig 1), and the median value was taken to be the T2FNM subregion thickness.

Representative true-positive and true-negative typical cases with T2-FLAIR subtraction maps and tumor segmentations. A, Patient A is a 38-year-old woman from the TCIA cohort diagnosed with a grade 2 IDHm-A demonstrating 59.6% T2-FLAIR mismatch volume (true-positive result). B, Patient B is a 23-year-old man from the institutional cohort diagnosed with grade 2 IDHm-A demonstrating 48.0% T2-FLAIR mismatch volume (true-positive result). C, Patient C is a 35-year-old woman from the TCIA cohort diagnosed with grade 2 IDHm-O demonstrating heterogeneous T2-weighted and T2-weighted FLAIR hyperintensity and no T2-FLAIR mismatch on the subtraction map (true-negative result). D, Patient D is a 59-year-old woman from the institutional cohort diagnosed with grade 4 IDHwt glioblastoma. The relative hypointense central T2-weighted FLAIR signal with a peripheral hyperintense rim may mimic a T2FM sign at first glance, but the corresponding absence of T2FM on the subtraction map from the heterogeneous T2-weighted hyperintensity clearly shows the lack of T2FM (true-negative result). Corresponding tumor segmentation VOIs of T2FM (pink) and T2FNM (green) subregions (A–D) as well as the T2FNM subregion external borders encoded with thickness (A/C) are shown. INST indicates institutional.
Reader Study: T2FM Sign Using T2-FLAIR Subtraction Maps
Two radiologists with 7 years (F.S., reader 1) and 11 years (S.O., reader 2) of neuroimaging experience who were blinded to the molecular diagnosis performed a reader study. For this analysis, the 2 cohorts were pooled. The readers were first given only the coregistered T2-weighted and T2-weighted FLAIR MR images and asked to assess the presence of the T2FM sign as first described by Patel et al6 (“presence or absence of complete/near-complete hyperintense signal on T2WI, and relatively hypointense signal on FLAIR except for a hyperintense peripheral rim”) and to estimate the percentage T2FM volume, similar to the proposed semiquantitative definition of ≥25% T2FM volume of Lasocki et al8 as sufficient for the T2FM sign. The readers were then provided the T2-FLAIR subtraction maps in the same session and asked to repeat their assessments before assessing the next patient. T2-FLAIR subtraction maps were visualized using a standardized color bar with values ranging from −3 to +3, in which red-to-yellow shades represented mismatched voxels with positive values, teal-to-blue shades represented nonmismatched voxels with negative values, and gray represented voxels with values close to zero (Fig 1).
Statistical Analysis
Statistical analysis was performed using GraphPad Prism Software (Version 8.4; GraphPad Software). Receiver operating characteristic (ROC) curves were first generated on the TCIA cohort to assess the performance of the empiric percentage T2FM volume thresholds for classifying IDHm-A versus IDHm-O/IDHwt gliomas. ROC curves were also computed in the institutional cohort, and the same percentage T2FM volume thresholds were applied to validate their diagnostic performance. For group comparisons, data sets were tested for normality using the Shapiro-Wilk test to determine whether to apply nonparametric/parametric statistical methods. Contingency tables for IDHm-A distribution based on cohort, tumor grade, and percentage T2FM volume were assessed using Fisher exact tests. Tumor characterization analyses comparing T2FM and T2FNM subregions were conducted only in IDHm-A that demonstrated both subregions at an empiric threshold of ≥15% T2FM volume. Differences in percentage T2FM volume and tumor volume were assessed using either t tests or Mann-Whitney tests. Correlations in T2FNM subregion thickness and percentage T2FM volume were assessed using either Pearson or Spearman correlations, and the relationships of T2FNM subregion thickness based on percentage T2FM volume categorizations were assessed using the Kruskal-Wallis test with post hoc Dunn Test for multiple comparisons. For the reader study, interreader agreement Cohen κ scores were calculated, and the Wald test was performed to assess overall changes in reader sensitivity and specificity for IDHm-A. Significance was set to P < .05. All bar graphs with error bars display the mean and SD.
RESULTS
Representative Cases
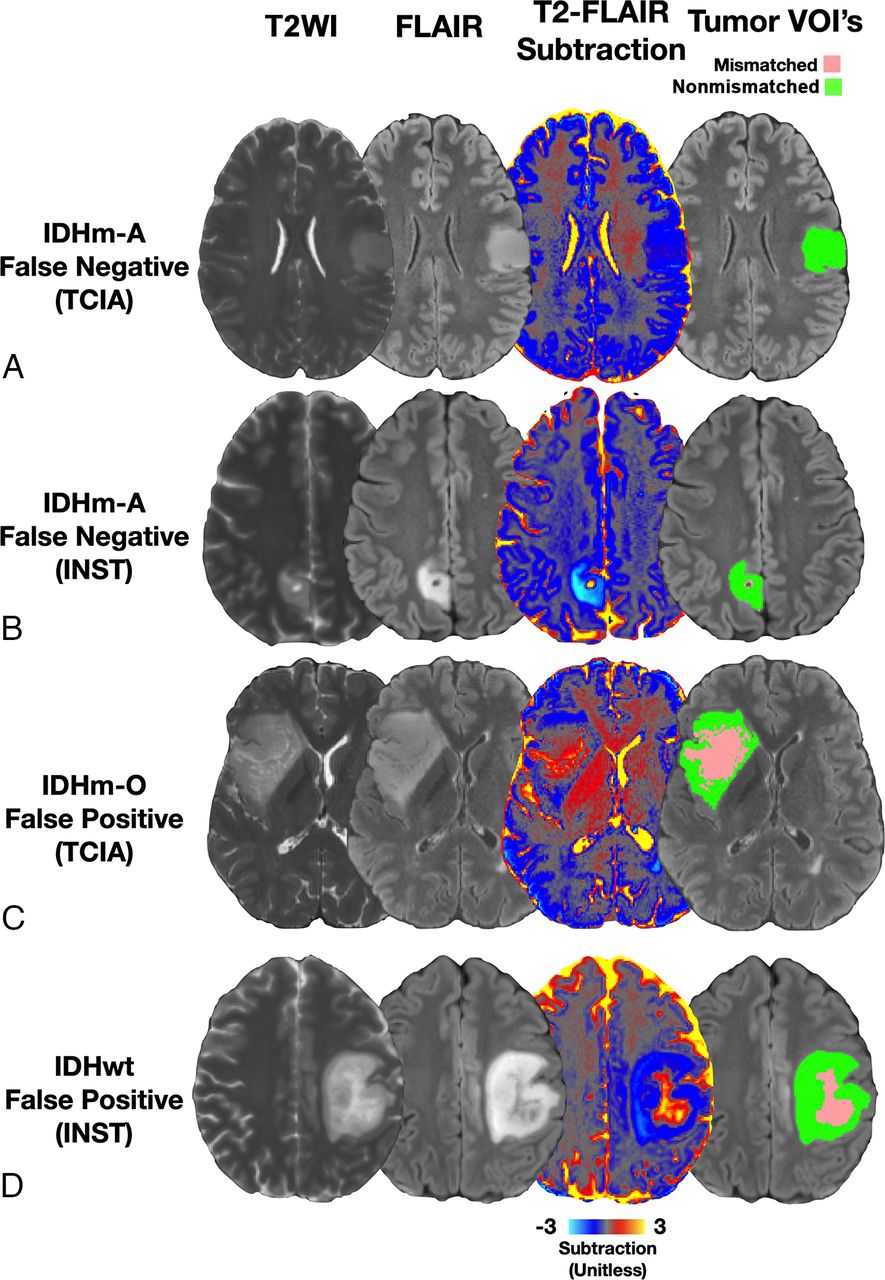
Eight representative cases across both cohorts are shown in Figs 1 and 2. Figure 1 displays typical true-positive and true-negative cases in the reader study. Patients 2A and 2B were diagnosed with IDHm-A, and T2-FLAIR subtraction maps clearly visualize T2FM subregions within these tumors and demonstrate 59.6% and 48.0% T2FM volume, respectively (Fig 1A -B, true-positive results). Patients 2C and 2D were diagnosed with IDHm-O and IDHwt glioblastomas, respectively, which demonstrate heterogeneous T2-weighted FLAIR hyperintensity, but T2-FLAIR subtraction maps demonstrated no corresponding T2FM subregions (Fig 1C, -D, true-negative results). Figure 2 demonstrates typical false-negative and atypical false-positive cases. Patients 3A and 3B were diagnosed with IDHm-A, but T2-FLAIR subtraction maps do not show T2FM subregions (Fig 2A, -B, false-negative results). Patients 3C and 3D were diagnosed with IDHm-O and IDHwt glioblastomas, respectively. These patients were interpreted as having the T2-FLAIR mismatch sign when using T2-FLAIR subtraction maps by at least one of the readers and demonstrated 35.0% and 12.5% T2FM volume, respectively (Fig 2C, -D, false-positive results).

Representative false-negative and false-positive cases with T2-FLAIR subtraction maps and tumor segmentations. A, Patient A is a 38-year-old man from the TCIA cohort diagnosed with grade 2 IDHm-A with no T2-FLAIR mismatch on the subtraction map (false-negative result). B, Patient B is a 36-year-old woman from the institutional cohort diagnosed with grade 2 IDHm-A with no T2-FLAIR mismatch on the subtraction map excluding the cystic portion (false-negative result). C, Patient C is a 45-year-old man from the TCIA cohort diagnosed with grade 2 IDHm-O demonstrating 35.0% T2FM volume, which was assessed as a false-positive for the T2FM sign by 1 reader using subtraction maps (false-positive result). D, Patient D is a 35-year-old woman diagnosed with IDHwt glioblastoma demonstrating 12.5% T2FM volume, which was assessed as a false-positive for the T2-FLAIR mismatch sign by both readers using subtraction maps. Corresponding tumor-segmentation VOIs of T2FM (pink) and T2FNM (green) subregions are shown (A–D) (false-positive result).
Diagnostic Performance of Quantitative Percentage T2FM Volume
In the TCIA cohort, percentage T2FM volume was significantly higher in IDHm-A (mean, 18.0%; 95% CI, 11.4%–24.6%) compared with IDHm-O/IDHwt gliomas (mean, 5.38%; 95% CI, 0.94%–9.81%; P = .03; Fig 3A). ROC curves using percentage T2FM volume to classify IDHm-A versus IDHm-O/IDHwt gliomas demonstrated an area under curve (AUC) of 0.657 (P = .03) (Fig 3B). A threshold of ≥42% T2FM volume was sufficient to achieve 100% specificity while also having 19.6% sensitivity; a threshold of ≥25% T2FM volume showed 92.0% specificity and 32.6% sensitivity; and a threshold of ≥15% T2FM volume showed 88.0% specificity and 39.1% sensitivity for IDHm-A (Fig 3B). An optimal threshold maximizing the likelihood ratio at 5.44 was ≥38% T2FM volume, which showed 96.0% specificity and 21.7% sensitivity.

Tumor percentage of T2FM volume and diagnostic performance for IDHm-A classification. Results are shown for both the TCIA cohort (A and B) and the institutional cohort (C and D). IDHm-A had a higher percentage T2FM volume (% T2FM volume) compared with the other molecular signatures (A and C). ROC curves show that a specificity of 100% for the IDHm-A diagnosis could be achieved with a threshold of ≥42% T2FM volume in both cohorts (B and D), though in the validation cohort, a threshold of ≥25% T2FM volume sufficed (D). The summary results when pooling the 2 cohorts are also shown (E and F). INST indicates institutional; Spec, specificity; Sens, sensitivity; *, P < .05; ***, P < .001; ****, P < .0001.
Similar results were shown in the institutional validation cohort. The percentage T2FM volume was significantly higher in IDHm-A (mean, 32.1%; 95% CI, 21.9%–42.2%) versus IDHm-O/IDHwt gliomas (mean, 4.14%; 95% CI, 1.32%–6.97%; P < .0001; Fig 3C). ROC curve analyses showed an AUC = 0.919 (P < .0001, Fig 3D), and using the same thresholds as in the TCIA cohort, a threshold of ≥42% T2FM volume showed 100% specificity and 31.6% sensitivity; a threshold of ≥25% T2FM volume showed 100% specificity and 63.2% sensitivity; and a threshold of ≥15% T2FM volume showed 93.3% specificity and 79.0% sensitivity for IDHm-A. The TCIA optimal threshold of ≥38% T2FM volume showed 100% specificity and 36.8% sensitivity. There was a significantly higher proportion of IDHm-A with ≥25% T2FM volume in the institutional cohort compared with the TCIA cohort (P = .03; Online Supplemental Data).
The diagnostic results when pooling both cohorts showed a significantly higher percentage T2FM volume in IDHm-A (mean, 22.1%; 95% CI, 16.5%–27.8%) compared with IDHm-O/IDHwt gliomas (mean, 4.91%; 95% CI, 2.04%–7.79%; P = .0002; Fig 3E), and the ROC curve AUC was 0.714 (P = .0002 [percentage T2FM volume threshold: specificity/sensitivity] ≥42% T2FM volume: 100%/23.1%; ≥38% T2FM volume: 97.5/26.2%; ≥25% T2FM volume: 95%/41.5%; ≥15% T2FM volume: 90%/50.8%; Fig 3F).
When assessing the potential impact of slight image misregistration on the percentage T2FM volume, the mean magnitude difference in percentage T2FM volume across both cohorts was 1.04%; 95% CI, 0.88%–1.20% (Online Supplemental Data). By considering empiric thresholds of 1.0% and 5.0% T2FM volume as potential “noise floors” when using T2-FLAIR subtraction maps, the sensitivity values for IDHm-A at a threshold of ≥1.0% T2FM volume were 73.9%, 100%, and 81.5% for the TCIA, institutional, and pooled cohorts, respectively, and for ≥5.0% T2FM volume, they were 45.7%, 84.2%, and 56.9% for the TCIA, institutional, and pooled cohorts, respectively (Online Supplemental Data).
Relationships among Tumor Subregions, Volumes, and Histopathologic Grade
In both cohorts, there was a significant negative correlation between T2FNM subregion thickness and percentage T2FM volume (TCIA: R = –0.86, P < .0001; institutional: R = –0.88, P < .0001; Fig 4A, -D). When categorizing IDHm-A as 15%–25% T2FM volume, 25%–42% T2FM volume, and ≥42% T2FM volume, there was an overall significant difference in T2FNM subregion thickness within each cohort with similar results (TCIA: P = .001; 15%–25% T2FM volume: mean, 7.08 mm; 95% CI, 5.62–8.54 mm; 25%–42% T2FM volume: mean, 5.55 mm; 95% CI, 3.84–7.26 mm; ≥42% T2FM volume: mean, 3.14 mm; 95% CI, 2.53–3.76 mm; institutional: P = .001; 15%–25% T2FM volume: mean, 7.06 mm; 95% CI, 3.88–10.3 mm; 25%–42% T2FM volume: mean, 5.07 mm; 95% CI, 3.54–6.60 mm; ≥42% T2FM volume: mean, 3.04 mm; 95% CI, 2.29–3.79 mm) (Online Supplemental Data).

T2FNM thickness, tumor grade, and tumor volume relationships based on tumor percentage T2FM volume. In both cohorts, tumor percentage T2FM volume (% T2FM volume) was significantly negatively correlated with T2FNM subregion thickness (A and C, P < .0001). Grade 3–4 IDHm-A had significantly higher percentage T2FM volume compared to grade 2 IDHm-A (B, TCIA, P = .008; E, institutional, P = .03), and tumor volumes were significantly greater in ≥15% T2FM volume IDHm-A compared with <15% T2FM volume IDHm-A (C, TCIA, P = .01; F, institutional, P = .04). INST indicates institutional; *, P < .05, **, P < .01.
The percentage T2FM volume was significantly lower in grade 2 IDHm-A compared to grade 3–4 IDHm-A in both cohorts (TCIA: P = .008; 13.4% T2FM [95% CI, 6.56%–20.3%] versus 29.6% T2FM [95% CI, 14.1%–45.2%]; institutional: P = .03; 23.2% T2FM [95% CI, 11.4%–34.9%] versus 44.4% T2FM [95% CI, 27.5%–61.2%]; Fig 4B, -E). There were no significant differences in the frequencies of grade 2 versus grade 3–4 IDHm-A between the TCIA and institutional cohorts or within each cohort based on a threshold of ≥25% T2FM volume (P < .05; Online Supplemental Data). There were also no significant relationships between percentage T2FM volume with patient age or sex in either cohort (P > .05; Online Supplemental Data).
Tumor volumes were also significantly higher in IDHm-A with ≥15% T2FM volume compared with IDHm-A with <15% T2FM volume in both cohorts (TCIA: P = .01; 35.5 mL [95% CI, 23.3–47.7 mL] versus 70.7 mL [95% CI, 41.7–99.7 mL]; institutional: P = .04; 22.5 mL [95% CI, −4.85–49.8 mL] versus 60.8 mL [95% CI, 33.4–88.2 mL]; Fig 4C, -F).
Reader Study Results
The pooled sensitivity and specificity from the 2 cohorts using quantitative percentage T2FM volume and by visual assessment are summarized in the Online Supplemental Data. The reader study results across all patients are summarized in Tables 2 and 3. When assessing the T2FM sign using the definitions by Patel et al6 and Lasocki et al8 without subtraction maps, there were significant differences in the sensitivity and specificity for reader 1 (P = .001) and a trend toward significance for reader 2 (P = .052). Using the definitions of Patel et al6 and Lasocki et al8 without subtraction maps, reader 1 interpreted 24 (1 false-positive) and 37 cases (4 false-positives) of the T2FM sign, respectively, and reader 2 interpreted 23 (4 false-positives) and 30 (3 false-positives) cases of the T2FM sign, respectively. Specificity was unchanged for reader 2 (92.5%) between definitions, while it was slightly decreased for reader 1 using the definition of Lasocki et al8 (90.0%) compared with that of Patel et al6 (97.5%). The Lasocki et al8 definition had slightly improved sensitivity (50.8% reader 1 and 41.5% reader 2) compared with that of Patel et al6 (35.4% reader 1 and 30.8% reader 2).
Reader study results of T2FM sign: Sensitivity and specificity
Reader study results of T2FM sign: Interreader agreement
For both readers, there were no significant changes in sensitivity and specificity after the inclusion of T2-FLAIR subtraction maps (P > .05). Specificity was unchanged for reader 2, and there was a slight decrease in specificity for reader 1 with T2-FLAIR subtraction maps with the definition of Patel et al6 (97.5% versus 92.5%; unchanged at 92.5%) and the definition of Lasocki et al8 (90.0% versus 85.0%; unchanged at 92.5%). There was slightly improved sensitivity using either the definition of Patel et al6 (reader 1: 35.4%, without the subtraction map, versus 36.9%, with the subtraction map; reader 2: 30.8% versus 38.5%) or the definition of Lasocki et al8 (reader 1: 50.8% versus 55.4%; reader 2: 41.5% versus 49.2%).
Interreader agreement for the T2FM sign was substantial32 for both definitions and with/without subtraction maps (Cohen κ: 0.70–0.78; Table 2). There were also slight, nonsignificant (P > .05) improvements in interreader agreement using T2-FLAIR subtraction maps with the definition of either the Patel et al6 (Cohen κ: 0.70 versus 0.78) or Lasocki et al8 (0.76 versus 0.78).
DISCUSSION
The primary objective of the present study was to add to the current literature by quantifying T2FM and T2FNM subregion volumes in nonenhancing gliomas using T2-FLAIR subtraction maps, with the main aim of diagnosing IDHm-A with near-100% specificity. The collective findings demonstrate that percentage T2FM volume thresholds may serve as a quantitative threshold for classifying IDHm-A with 100% specificity as demonstrated in 2 independent cohorts. The percentage T2FM volume is influenced by tumor volume and grade in IDHm-A, and T2-FLAIR subtraction maps may be more useful as an objective tool for quantitative tumor imaging analysis than for visual assessment of the T2FM sign by experienced radiologists. The present study adds to the current literature by providing a method for the automated quantification of percentage T2FM volume and performing subregion segmentations in IDHm-A using T2-FLAIR subtraction maps. The present study also expands on a previous study assessing the relative signal intensity of T2FM in a hot-spot region within the T2FM core17 by creating a subtraction map for whole-tumor visualization and assessment.
Quantitative T2-FLAIR subtraction maps may serve as a useful, complementary tool for studying the T2FM sign in IDHm-A. The finding that ≥42% T2FM volume can classify IDHm-A with 100% specificity suggests that percentage T2FM volume calculated from quantitative subtraction maps may help radiologists avoid false-positives as shown in Fig 2 and serve as a potential imaging biomarker of IDHm-A in combination with the radiographic T2FM sign.6⇓⇓⇓⇓⇓⇓-13 In the present study, we purposely did not describe the subtraction map–defined T2FM and T2FNM subregions synonymously as the “core” and “rim” subregions in IDHm-A, respectively, as in previous radiographic studies on the T2FM sign.6 While T2-FLAIR subtraction maps allow determining the presence of T2FM subregions, the present use of T2-FLAIR subtraction maps may be limited in determining the presence of the corresponding hyperintense T2-weighted FLAIR rim specifically distinct from more broadly-defined T2FNM subregions that are also present in gliomas not exhibiting the T2FM sign.
The present findings of a threshold of ≥42% T2FM volume demonstrating 100% specificity for IDHm-A and lower thresholds of ≥15% and ≥25% T2FM volume demonstrating 88.0%–100% specificity may also be perceived as similar to those of other studies proposing a less conservative definition of the T2FM sign8,14,15 and as demonstrated in our representative false-positive cases, particularly when considering that T2FM subtraction maps do not explicitly account for the hyperintense T2-weighted FLAIR rim. Nevertheless, percentage T2FM volume was also found to be inversely related to T2FNM subregion thickness in IDHm-A, possibly demonstrating that T2FNM subregions are potentially synonymous with a T2-weighted FLAIR hyperintense rim as the T2FM sign IDHm-A grows.
As for sensitivity, the present study demonstrates that high sensitivity cannot be achieved by lowering the percentage T2FM volume threshold, findings in line with those of previous studies reporting a low sensitivity of the T2FM sign.6⇓-8 Indeed, even when we dramatically lowered to a ≥5.0% T2FM volume threshold, which can be considered close to a noise floor, the sensitivity was 45.7%–84.2% in the 2 cohorts. We believe the low sensitivity may be related to the biology of IDHm-A, which can seemingly lack any extent of mismatch in a non-negligible percentage of cases. For example, the differing AUC performance may be explained by the higher proportion of nonmismatched IDHm-A in the TCIA cohort compared with the institutional validation cohort, though both cohorts demonstrated 100% specificity for IDHm-A using a high percentage T2FM volume threshold.
These findings potentially demonstrate a limitation of percentage T2FM volume as a continuous measure for AUC-based classification compared with a categoric measure for 100% specificity-based classification through a percentage T2FM volume threshold (ie, ≥42% T2FM volume) at the cost of sensitivity. Additionally, even though there was no significant difference in the tumor grade distribution of IDHm-A with or without a ≥25% T2FM volume threshold, which is in line with the literature showing no IDHm-A tumor grade differences based on T2FM-sign,7,9,12 the percentage T2FM volume was significantly higher in grade 3–4 IDHm-A compared with grade 2 and in tumors with larger volumes compared with smaller volumes in both cohorts. We speculate that percentage T2FM volume development may be associated with tumor growth; however, a longitudinal assessment is warranted to verify this claim.
The present study demonstrates that T2-FLAIR subtraction maps may be useful to obtain partitioned segmentations of T2FM/T2FNM subregions in IDHm-A for quantitative studies of the T2FM sign in gliomas. Previous studies have shown that mismatched areas show either microcystic changes or enlarged intercellular spaces on histology.6,18 Future studies could use T2-FLAIR subtraction maps to objectively partition subregion segmentations to assess intratumoral heterogeneity because there have been studies using quantitative MR imaging to assess the tumor microenvironment of IDHm-A with the T2FM sign,17,33 and use of the radiographic sign is now expanding and even being explored in pediatric populations.34 In addition, the generation of T2-FLAIR subtraction maps uses readily available, open-source software and involves relatively routine preprocessing steps that are conducted for many quantitative imaging studies, including NIfTI conversion, image coregistration, skull-stripping, normalization, and voxelwise arithmetic (ie, subtraction), which could be performed by nonclinicians. Although off-line processing was required for this first demonstration study, it is conceivable that use of these maps could eventually be extended beyond research settings and expanded for clinical practice because the processing steps are not computationally demanding.
In the reader study portion of the present study, the interreader agreements without (0.70–0.76) and with subtraction maps (0.78) were in line with values previously reported in the literature.6,7 Additionally, the specificity of the definition of Patel et al6 applied by the readers (specificity ranging from 92.5% to 97.5%) was similar to that of the ≥25% T2FM volume threshold (95%). The specificity for the definition of Lasocki et al8 (specificity ranging from 85% to 92.5%) was similar to that of the ≥15% T2FM volume threshold (90%). The sensitivity values were also comparable between the definition of Patel et al6 and the ≥25% T2FM volume threshold (30.8%–38.5% versus 41.5%) and between the definition of Lasocki et al8 and the ≥15% T2FM volume threshold (50.8% versus 41.5–55.4%, respectively).
Interestingly, there were no significant differences in sensitivity, specificity, or interreader agreement of T2FM sign when adding T2-FLAIR subtraction maps for either the Patel et al6 or Lasocki et al8 definitions, though there was a significant difference when comparing the definitions of Patel et al6 and Lasocki et al8 for 1 reader and a significant trend in the other reader. There are possible reasons to explain these results. First, these findings may further support that the radiographic definitions of the T2FM sign are very robust in definition and that additional tools such as T2-FLAIR subtraction maps may not provide additional diagnostic benefit for estimating the percentage T2FM volume for T2FM sign positivity, especially for experienced radiologists. Second, the reader study design involved using a standardized T2-FLAIR subtraction map windowing and color scale with gray voxels depicting voxels around zero (either positive or negative), so the reader’s interpretation of the gray voxels may have impacted their assessments. In the future, reader studies involving radiologists with less experience and a more binarized color bar without an intermediate color zone may be useful to better understand the potential diagnostic utility of T2-FLAIR subtraction maps. Although subtraction maps did not show a striking benefit as a tool for qualitative evaluations, their potential quantitative use to compute percentage T2FM volume and T2FM/T2FNM subregions is considered a valuable complementary tool that does not have interreader variability. The interreader agreement for the T2FM sign in both ours and previous studies was substantial, but not perfect, and, speculatively, may also be worse in less experienced readers, further supporting this notion.
There are several limitations to this study. First, the sample size was limited, so further studies assessing the potential usefulness of T2-FLAIR subtraction maps in other, expanded cohorts are warranted. Second, given that the T2FM sign is known to be impacted by pulse sequence parameters,11 it is conceivable that there may be institutional- or patient-specific thresholds to better distinguish T2FM from T2FNM subregions compared with the positive- and negative-value thresholds, respectively, used in the current study. For example, lower FLAIR TIs have been shown to increase the visibility of the T2FM sign,11 which may analogously lead to a larger percentage T2FM volume, and other sequence parameter variations may have similar effects. However, we believe that the use of straightforward positive- and negative-value thresholds with intensity-normalized anatomic images to minimize the impact of sequence parameter differences and additional NAWM normalization to further minimize patient-specific differences is valid as a first demonstration of the potential utility of T2-FLAIR subtraction maps for consistent analyses across and within our multi-institutional cohorts.
Nevertheless, a more thorough investigation of the impact of acquisition parameters on the T2FM sign, T2-FLAIR subtraction maps, and the percentage T2FM volume calculation may be warranted. A potential approach to overcome the inherent low sensitivity of T2FM could be represented by a combination of T2-FLAIR subtraction maps with advanced imaging such as diffusion,17,33 perfusion,17,33 and chemical exchange saturation transfer MR imaging35 as did some prior studies on the visual T2FM-sign. Lastly, while the reader study results did not show marked improvement in T2FM sign assessment using T2-FLAIR subtraction maps in experienced radiologists, future reader studies assessing the potential usefulness of T2-FLAIR subtraction maps, including perhaps for radiology trainees, may be warranted.
CONCLUSIONS
T2-FLAIR subtraction maps may be a useful tool to quantitatively assess the T2FM sign in nonenhancing gliomas and to obtain objective segmentations of T2FM and T2FNM subregions based on specific thresholds. Whole-tumor quantification of percentage T2FM volume may complement the T2FM sign for classifying IDHm-A with 100% specificity. Conversely, there appeared to be no significant benefit in using T2-FLAIR subtraction maps for visual assessment of the T2FM sign by experienced radiologists.
Footnotes
This work was supported by the National Institutes of Health National Institute of General Medical Sciences, T32GM008042 (N.S.C.); National Institutes of Health National Cancer Institute, F30CA284809 (N.S.C.); National Institutes of Health National Cancer Institute, R01CA270027 (B.M.E., T.F.C.); National Institutes of Health National Cancer Institute, R01CA279984 (B.M.E.), DoD CDMRP CA220732 (B.M.E., T.F.C.); and National Institutes of Health National Cancer Institute, P50CA211015 (B.M.E., T.F.C.).
Disclosure forms provided by the authors are available with the full text and PDF of this article at www.ajnr.org.
References
- Received September 23, 2023.
- Accepted after revision November 10, 2023.
- © 2024 by American Journal of Neuroradiology


Jump to section
Related Articles
Cited By...
- No citing articles found.