
Abstract
BACKGROUND AND PURPOSE: Early neurologic deterioration (END) often occurs during hospitalization in single small subcortical infarction (SSSI). The objective was to identify imaging predictors of END.
MATERIALS AND METHODS: SSSIs in the lenticulostriate artery within 72 hours of stroke onset from January 2015 to June 2021 were consecutively enrolled. The posteriority and laterality indexes were assessed on the second section from the top of the corona radiata section showing the lateral ventricle on DWI. A multivariate logistic analysis was used to explore the predictors of END.
RESULTS: A total of 402 patients were included in this study, among whom 93 (23.1%) experienced END. The optimal cutoff points of the posteriority and laterality indexes for predicting END were given by a receiver operating characteristic curve. A multivariate logistic analysis showed that the posteriority index of ≥0.669 (OR: 2.53; 95% CI: 1.41–4.56; P = .002) and the laterality index of ≥0.950 (OR: 2.03; 95% CI: 1.03–4.00; P = .042) were independently associated with the risk of END. Accordingly, the SSSIs were further divided into 4 types: anterior lateral type (AL-type), anterior medial type (AM-type), posterior lateral type (PL-type), and posterior medial type (PM-type). After the multivariate analysis, in comparison with the AL-type, the AM-type (OR: 3.26; 95% CI: 1.10–9.65), PL-type (OR: 4.68; 95% CI: 1.41–15.56), and PM-type (OR: 6.77; 95% CI: 2.53–18.04) carried significantly elevated risks of END. The PM-type was associated with the highest risk of END.
CONCLUSIONS: The PM-type was found to be associated with the highest risk of END.
ABBREVIATIONS:
- AL
- anterior lateral
- AM
- anterior medial
- CR
- corona radiata
- CST
- corticospinal tract
- END
- early neurologic deterioration
- LSA
- lenticulostriate artery
- lSSSI
- large SSSI
- LV
- lateral ventricle
- MAD
- maximum axial diameter
- PAD
- parent artery disease
- PL
- posterior lateral
- PM
- posteriormedial type
- pSSSI
- proximal SSSI
- SSSI
- single small subcortical infarction
Single small subcortical infarctions (SSSIs) are defined as isolated deep infarctions in the territory of the perforating artery with a maximum axial diameter (MAD) of ≤20 mm on DWI.1 Approximately 13.5% to 43%2⇓⇓⇓⇓-7 of patients with SSSI experience early neurologic deterioration (END)8 in the acute phase, which is generally associated with a relatively unfavorable prognosis. The location of SSSI lesions within the lenticulostriate artery (LSA) territory, such as proximal SSSI (pSSSI), large SSSI (lSSSI), and posterior-type SSSI, has been found to be correlated with the occurrence of END. The proximity of the lesion to the corticospinal tract (CST) appears to be an underlying mechanism.3,5,9⇓⇓⇓⇓⇓-15 MR tractography studies revealed that the CST crossed the LSA territory exclusively in the posterosuperior quadrant, which corresponds to the posterior part of the corona radiata (CR) area adjacent to the lateral ventricle.16⇓-18 One previous study reported that the posterior-type SSSI, defined as a lesion with more than one-half of its extent in the posterior half of the CR on DWI, were identified as a predictor for the progression of motor deficits after admission in patients with SSSI in the LSA territory.5 However, the definition of the division was primarily derived from subjective estimations without a robust and scientifically validated approach. The purpose of this study was to identify more specific imaging markers for the occurrence of END by analyzing quantitative indexes that reflect lesion location information.
MATERIALS AND METHODS
Patient Selection
Patients were enrolled consecutively from a hospital-based prospective registry of SSSIs at The First Affiliated Hospital of Zhengzhou University between January 2015 and June 2021. The inclusion criteria were as follows: 1) age ≥18 years; 2) SSSI within the LSA territory with MAD ≤20 mm on DWI; and 3) at least 1 vascular examination, including MRA, CTA, or DSA. The exclusion criteria were as follows: 1) stroke onset time beyond 72 hours; 2) occurrence of END beyond 7 days after admission; 3) interval from admission to the first MR imaging after admission beyond 72 hours; 4) END occurring before the first brain MR imaging was performed after admission; 5) suspected cardioaortic embolism or ipsilateral carotid artery stenosis of ≥50%; 6) suspected anterior choroidal artery infarction involving the posterior limb of the internal capsule or paraventricular area; 7) lesions without involvement of the CR level showing the lateral ventricle on DWI in the standard axial image template in the LSA territory; 8) unclear MR imaging or cerebrovascular imaging examination affecting the evaluation of the results; or 9) refusal to participate in the study. A flowchart outlining the patient selection process is depicted in Fig 1. A total of 402 patients were included in this study, which received approval from the Ethics Committee of The First Affiliated Hospital of Zhengzhou University. Informed consent was obtained from all participating patients.

Flowchart of patient selection. AchoA indicates anterior choroidal artery.
Clinical Parameters
The following clinical and laboratory parameters were collected on admission: age, sex, hypertension (documentation of 2 or more blood pressure measures of ≥140/90 mmHg or the use of antihypertensive medications), diabetes mellitus (serum glucose level of more than 11.1 mmol/L in a 2-hour oral glucose tolerance test or the use of insulin or oral hypoglycemic agents), hyperlipidemia (total cholesterol level of 5.2 mmol/L or higher, triglyceride level of 1.7 mmol/L or higher, or the use of cholesterol-reducing agents), current smoking, systolic blood pressure, diastolic blood pressure, NIHSS score on admission, stroke history, onset to admission time, glycosylated hemoglobin, hemoglobin, creatinine levels, and glomerular filtration rate. Thrombolysis and dual antiplatelet therapy were also recorded. END was defined as a worsening of ≥2 points in the total NIHSS score or ≥1 point in the motor items of the NIHSS score.
Imaging Assessment
This study was performed by using a previously reported standard axial image template with 6 standard layers in the LSA territory. In this template, the first layer represents the lowest part of the basal ganglia region closest to the opening of the perforating branch of the middle cerebral artery, and the sixth layer represents the farthest level of the perforating artery. The anteroposterior and mediolateral localization of the lesion were assessed at the level of the second section from the top of the CR section showing the lateral ventricle on DWI. Two parallel tangents were drawn along both sides of the anterior and posterior horns of the lateral ventricles. As shown in Fig 2, we measured the longitudinal distance between the tangents (d1), the distance from the inferior edge of the lesion to the tangent of the superior horn of the lateral ventricle (d2), the horizontal distance from the lateral ventricle to the ipsilateral cerebral parenchyma passing through the innermost margin of the lesion (d3), and the horizontal distance from the innermost margin of the lesion to the edge of the ipsilateral cerebral parenchyma (d4). The posteriority index was defined as the d2/d1 ratio, and it indicated the anteroposterior localization of the lesions. The laterality index was defined as the d4/d3 ratio, and it indicated the mediolateral localization of the lesions (Fig 2). The lowest section and number of slices were also evaluated. On the basis of the lowest section and number of slices, SSSIs were categorized as pSSSI (lowest section ≤ 2), distal SSSI (lowest section > 2), small SSSI (number of slices < 3), and lSSSI (number of slices ≥ 3). Any degree of abnormality seen on an imaging assessment of the M1 segment of the MCA ipsilateral to the lesion was classified as parent artery disease (PAD),19,20 and cases that did not show such abnormalities were categorized as non-PAD. The Fazekas score was used to evaluate paraventricular and deep white matter hyperintensities. Severe white matter hyperintensity was defined if either score was ≥2.21 All images were reviewed independently by 2 physicians who were blinded to the clinical data. In cases where discrepancies arose, a final decision was reached by remeasuring.

The longitudinal distance between the tangents (d1) and the distance from the inferior edge of the lesion to the tangent of the superior horn of the lateral ventricle (d2) (A). The horizontal distance from the lateral ventricle to the ipsilateral cerebral parenchyma passing through the innermost margin of the lesion (d3) and the horizontal distance from the innermost margin of the lesion to the edge of the ipsilateral cerebral parenchyma (d4) (B).
Statistical Analysis
The SPSS Statistics software package (IBM; version 25.0) was used for all statistical analyses. Before analysis, the Kolmogorov-Smirnov test was performed to assess normality. The association between the variables and END was analyzed by using univariate and multivariate analyses. In the univariate analyses, the Student t test was used for continuous variables, and the χ2 test was used for categoric variables. To determine the predictors of END, all associated variables (P < .1) in the univariate analysis were included in the multivariate logistic regression analysis and were removed via Wald selection. All statistical tests were 2-sided with a significance level of P < .05. Restricted cubic spline analyses and curves were performed by using the RStudio software package to depict the relationship between lesion location indexes and the risk of END. The discriminative power of the lesion location indexes in predicting END was assessed via receiver operating characteristic curve analyses conducted using the MedCalc statistical software package. In addition, the area under the receiver operating characteristic curve and the optimal cutoff point were calculated. Based on these optimal cutoff points, the posteriority and laterality indexes were dichotomized (≥ the optimal cutoff point or < the optimal cutoff point). The lesion locations were then categorized into 4 different types based on the 2 optimal cutoff points. All images were independently reviewed by 2 physicians who were blinded to the clinical data. In cases where discrepancies arose, a consensus decision was reached.
RESULTS
Baseline
A total of 402 patients were included in the final analyses, 93 (23.1%) of whom experienced END. The average age of the patients was 58.7 ± 12.5 years. Out of the total, 117 (29.1%) patients were female. The prevalence of risk factors among the patients was as follows: 238 (59.2%) had a history of hypertension, 90 (22.4%) had diabetes mellitus, 137 (34.1%) were smokers, 116 (28.9%) were regular alcohol drinkers, 163 (40.5%) had hyperlipidemia, and 94 (23.4%) had experienced previous strokes. The median NIHSS score on admission was 2 (IQR: 1–4). The mean onset to admission time and onset to MR imaging time were 25.7 ± 22.7 hours and 36.9 ± 30.4 hours, respectively. The numbers of patients with pSSSI, lSSSI, PAD, posteriority index ≥0.669, and laterality index ≥0.950 were 184 (45.8%), 241 (60%), 120 (29.9%), 221 (55.0%), and 259 (64.4%), respectively. Other baseline characteristics are presented in Table.
Univariate logistic analysis of the risk factors for END
Factors Associated with END
In the univariate analysis, smoking, initial NIHSS score, onset to admission time, creatinine level, MAD, PAD, posteriority index ≥0.669, laterality index ≥0.950, thrombolysis, and dual antiplatelet therapy were selected for further analysis (Table). A multivariate logistic analysis showed that smoking (odds ratio [OR]: 1.94; 95% confidence interval [CI]: 1.14–3.32; P = .015), initial NIHSS score (OR: 1.10; 95% CI: 1.01–1.19; P = .033), MAD (OR: 1.07; 95% CI: 1.00–1.14; P = .049), PAD (OR: 2.80; 95% CI: 1.64–4.75; P < .001), posteriority index ≥0.669 (OR: 2.53; 95% CI: 1.41–4.56; P = .002) and laterality index ≥0.950 (OR: 2.03; 95% CI: 1.03–4.00; P = .042) were independently associated with the risk of END, as shown in Fig 3.

Multivariate logistic analysis for the risk factors of END.
Lesion Location and Risk of END
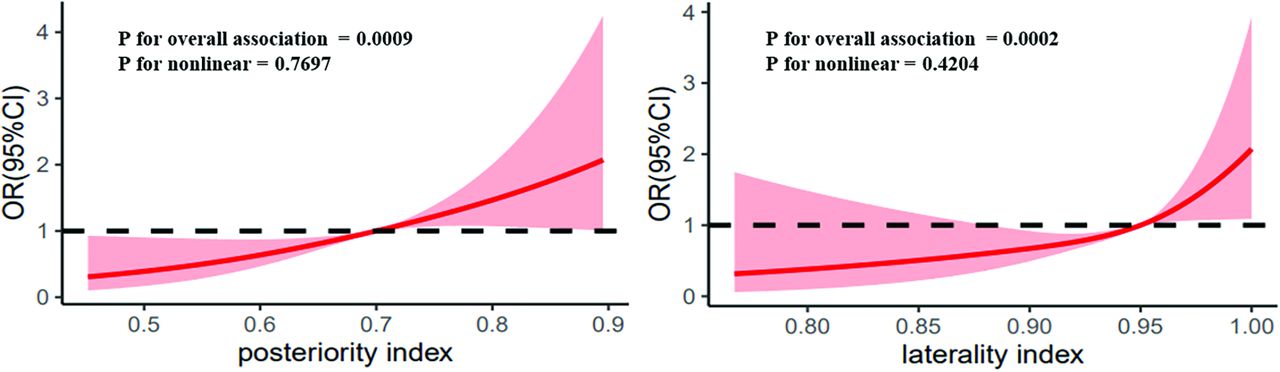
The restricted cubic spline curve showed that the risk of END increased with an increase in the posteriority and laterality indexes (Fig 4). After the receiver operating characteristic curve analysis, the optimal cutoff points of the posteriority and laterality indexes for predicting END were determined (0.669, 0.950)(Online Supplemental Data), and these cutoff values were used to divide the lenticulostriate SSSIs into 4 types: anterior lateral type (AL-type), anterior medial type (AM-type), posterior lateral type (PL-type), and posterior medial type (PM-type) (Fig 5). After the multivariate analysis, in comparison with the AL-type, the AM-type (OR: 3.26; 95% CI: 1.10–9.65), PL-type (OR: 4.68; 95% CI: 1.41–15.56), and PM-type (OR: 6.77; 95% CI: 2.53–18.04) showed significantly elevated risks of END. The PM-type had the highest risk of END (Fig 6).

Restricted cubic spline curve for the association of the posteriority and laterality indexes with the risk of END. The risk of END increased with increases the in posteriority and laterality indexes.

Lesion location types (A) anterior lateral type (AL-type, posteriority index <0.669 and laterality index <0.950); (B) anterior medial type (AM-type, posteriority index <0.669 and laterality index ≥0.950); (C) posterior lateral type (PL-type, posteriority index ≥0.669 and laterality index <0.950); (D) posterior medial type (PM-type, posteriority index ≥0.669 and laterality index ≥0.950).

Multivariate analysis of the 4 lesion types for END in patients with SSSI. Adjusted for smoking, initial NIHSS score, MAD, and PAD.
DISCUSSION
Our study found that the posteriority and laterality indexes were both associated with the risk of END in patients with lenticulostriate SSSI. Patients with PM-type lenticulostriate SSSIs were at the highest risk of END.
The aggravation of motor function is commonly defined as END in clinical practice and is closely related to the impairment of motor fibers in the CST. The expansion of the lesion volume on DWI has been recognized as a common feature of ENDs.22⇓-24 Therefore, to some extent, the proximity of the lesion to the CST has a notable effect on the risk of END. Previous studies using MR tractography have revealed that the CST crosses the LSA territory exclusively at the posterosuperior quadrant, which corresponds to the posterior part of the CR area adjacent to the lateral ventricle;18 therefore, if the SSSI lesion is located adjacent to or overlaps the CST, a higher risk of progression is reasonable. Our results could be explained on the basis of these anatomic characteristics. In our study, the more posterior and medial the lesion, the greater the risk of END within the CR area. We found that the best cutoff points of the posteriority index and laterality index were located near the location where the CST passes through, which could be verified by the results of previous studies that focused on the location of the CST in the LSA area.25 Therefore, the highest risk of END in the PM-type can easily be explained.
A previous study reported that DWI findings showing the “posterior-type” of SSSI were an independent predictor for the progression of motor deficits after admission in patients with lacunar infarction in the LSA territory. The “posterior-type” was defined by the presence of more than one-half of the lesion in the posterior half of the CR.5 The explanation for this division was not clearly described and may reflect a rough estimate according to the distribution of CST. The novelty of our study is that it is the first study to characterize a credible imaging predictor obtained via data analyses based on the best cutoff points of lesion location parameters in a cohort study with the largest sample, to our knowledge. The division line defined by our optimal cutoff points was more adjacent to the CST.
Our results have several notable clinical implications. Our study provides a novel and reliable imaging marker for predicting END in patients with lenticulostriate SSSIs. Physicians should pay more attention to patients with PM-type lesions, which carry the highest risk for END. For clinical user convenience, PM-type lesions can be considered as lesions located at the posterior one-third of d1 and adjacent to the lateral ventricle, as shown in Fig 5. Once high-risk patients are identified, earlier doctor-patient communication may prevent potential medical disputes. More aggressive treatment strategies should be considered to eliminate upcoming progress.
This study had some limitations. First, the definition of END varied in previously published studies; a more liberal or strict definition may lead to different results. Second, some asymptomatic patients with SSSI may not have consulted a doctor, which might have led to an overestimation of the occurrence of END. Third, given that our study was a single-center study, further prospective and larger-sample studies are needed to confirm these results.
CONCLUSIONS
Lesion location indexes of posteriority and laterality at the level of the CR showing the lateral ventricle on DWI were associated with the risk of END occurrence in patients with lenticulostriate SSSI. The PM-type was found to be associated with the highest risk of END. These findings may be helpful for clinicians preparing appropriate clinical interventions to address the future risks of END.
Acknowledgments
The authors declare that the research was conducted in the absence of any commercial or financial relationships that could be construed as a potential conflict of interest. Project development: Dr. Yuming Xu and Dr. Yuan Gao; Writing (original draft preparation): Dr. Yuan Gao and Dr. Ke Zhang; Data collection: Dr. Hongbing Liu; Data analysis: Ce Zong; Figures and tables: Hongxun Yang and Ying Yao. All authors approved the final article.
Footnotes
Yuan Gao and Ke Zhang contributed equally to this article.
This research has been supported by the China National Key R&D Program during the 13th Five-year Plan Period (Grant No. 2018YFC1311303) and Major Science and Technology Projects of Henan Province in 2020 (Grant No. 201300310300).
Disclosure forms provided by the authors are available with the full text and PDF of this article at www.ajnr.org.
References
- Received July 2, 2023.
- Accepted after revision January 8, 2024.
- © 2024 by American Journal of Neuroradiology


Jump to section
Related Articles
Cited By...
- No citing articles found.