
Abstract
BACKGROUND AND PURPOSE: The efficacy of long-term chronic subthalamic nucleus deep brain stimulation (STN-DBS) in treating Parkinson disease (PD) exhibits substantial variability among individuals. The preoperative identification of suitable deep brain stimulation (DBS) candidates through predictive means becomes crucial. Our study aims to investigate the predictive value of characterizing individualized structural covariance networks for long-term efficacy of DBS, offering patients a precise and cost-effective preoperative screening tool.
MATERIALS AND METHODS: We included 138 patients with PD and 40 healthy controls. We developed individualized structural covariance networks from T1-weighted images utilizing network template perturbation, and computed the networks’ topological characteristics. Patients were categorized according to their long-term motor improvement following STN-DBS. Intergroup analyses were conducted on individual network edges and topological indices, alongside correlation analyses with long-term outcomes for the entire patient cohort. Finally, machine learning algorithms were employed for regression and classification to predict post-DBS motor improvement.
RESULTS: Among the patients with PD, 6 edges (left middle frontal and left caudate nucleus, right olfactory and right insula, left superior medial frontal gyrus and right insula, right middle frontal and left paracentral lobule, right middle frontal and cerebellum, left lobule VIIb of the cerebellum and the vermis of the cerebellum) exhibited significant results in intergroup comparisons and correlation analyses. Increased degree centrality and local efficiency of the cerebellum, parahippocampal gyrus, and postcentral gyrus were associated with DBS improvement. A regression model constructed from these 6 edges revealed a significant correlation between predicted and observed changes in the unified PD rating scale (R = 0.671, P < .001) and receiver operating characteristic analysis demonstrated an area under the curve of 0.802, effectively distinguishing between patients with good and moderate improvement post-DBS.
CONCLUSIONS: Our findings reveal the link between individual structural covariance network fingerprints in patients with PD and long-term motor outcome following STN-DBS. Additionally, binary and continuous cerebellum–basal ganglia–frontal structural covariance network edges have emerged as potential predictive biomarkers for DBS motor outcome.
ABBREVIATIONS:
- AUC
- area under the curve
- Berg
- Berg Balance Scale
- DBS
- deep brain stimulation
- FDR
- false discovery rate
- FOG-Q
- Freezing of Gait Questionnaire
- GIG
- good improvement group
- HAMA
- Hamilton Anxiety Rating Scale
- HAMD
- Hamilton Depression Rating Scale
- HC
- health control
- ISCN
- individualized structural covariance networks
- IDSCN
- individual differential structural covariance network
- LCT
- levodopa challenge test
- MDS-UPDRS
- Movement Disorder Society–sponsored Unified Parkinson’s Disease Rating Scale
- Med-OFF
- off-medication
- Med-ON
- on-medication
- MIG
- moderate improvement group
- ML
- machine learning
- MoCA
- Montreal Cognitive Assessment
- MSE
- mean squared error
- NTP
- network template perturbation
- PCL
- paracentral lobule
- PD
- Parkinson disease
- ROC
- receiver operating characteristic
- STN-DBS
- deep brain stimulation of the subthalmic nucleus
- Stim-ON
- stimulation-on
- SCN
- structural covariance network
- TIV
- total intracranial volume
SUMMARY SECTION
PREVIOUS LITERATURE:
The effectiveness of long-term STN-DBS in treating PD varies significantly among individuals. The preoperative identification of suitable DBS candidates through predictive methods becomes imperative. The clinically utilized dopamine challenge test demonstrates limited efficacy in predicting long-term outcomes. With the recognition of aberrant characteristics in the whole-brain networks in PD, individual brain networks constructed based on functional magnetic resonance imaging (fMRI) are used for postoperative predictions. However, the extended scan duration, notable variability, and economic constraints associated with fMRI restrict its applicability and practicality. Therefore, there is a clinical need for predictive methods that exhibit both robust efficacy and economic feasibility.
KEY FINDINGS:
Binary and continuous structural covariance network edges linking the cerebellum, basal ganglia, and frontal regions have emerged as potential predictive biomarkers for the motor outcome of DBS.
KNOWLEDGE ADVANCEMENT:
This study contributes to providing an economically viable and objectively convenient predictive tool for identifying suitable candidates for DBS.
Deep brain stimulation of the subthalamic nucleus (STN-DBS) is an effective therapy for improving long-term motor symptoms in patients with Parkinson disease (PD).1,2 However, the long-term effectiveness of deep brain stimulation (DBS) relies on preoperative patient selection, precise targeting during implantation, postoperative programming, and ongoing medical management.3 Long-term STN-DBS can lead to motor and cognitive complications in some patients,4 and there is considerable individual variation in the postoperative improvement of motor symptoms.5,6 Therefore, identifying effective predictive factors preoperatively is crucial for patient selection.
In many DBS centers, the levodopa challenge test (LCT) serves as a critical predictor for evaluating the motor prognosis of DBS.7,8 While LCT proves effective in identifying patients with a nonresponsive reaction to levodopa, its predictive accuracy for postoperative long-term motor outcomes exhibits significant variability and lacks precision.7⇓⇓-10 Additionally, the emotional burden induced by the off-medication (Med-OFF) state and the hospital environment can lead to inaccuracies in LCT results.11 Existing research suggests that the modulation of motor symptoms in patients with PD through STN-DBS is based on the regulation of large-scale brain networks.12,13 Due to the dynamic time characteristics of fMRI,14 individual brain networks constructed based on fMRI are increasingly employed for postoperative prediction.15,16 However, noise sources, such as physiologic factors (eg, motion, respiration) and miscellaneous nonphysiologic factors (eg, scanner drift), coupled with the duration of the scans themselves, contribute to significant variability in fMRI.17 Additionally, economic constraints associated with fMRI also limit its applicability and value. All of these factors render it unsuitable for some DBS centers. Given these challenges, there is a pressing need for a more objective and stable postoperative prediction method. The advantages of T1 scans include shorter scan times, minimal sensitivity to physiologic influences, and controlled error within 2% in repeated scans on the same equipment, demonstrating the stability of its scan results.18,19 T1 scans are a routine sequence in many centers, offering economic advantages as well. The latest network template perturbation (NTP) methods20 have facilitated the construction of structural covariance networks. The predictive potential of brain networks for long-term motor outcomes, investigated in fMRI research, may also be attainable by depicting brain networks by using structural covariance.
In previous studies, the relationship between T1-based brain morphometry and long-term therapeutic outcomes has been established.21 Gray matter atrophy in the frontal lobe22 and precentral cortex23 have also shown effective predictive relationships with long-term motor response. Additionally, in patients with PD, damage to the structural covariance network (SCN) from the basal ganglia to regions such as the sensorimotor cortex has been observed based on T1-weighted images at the group level.24,25 However, group-based SCNs often overlook individual differences and fail to uncover the relationship between brain structural networks arising from individual variability and improvements in clinical symptoms. In this study, we employed NTP, based on T1, to construct individualized structural covariance networks (ISCN) and investigate the predictive value of ISCN for long-term motor improvement following STN-DBS.20 This approach allowed us to explore the heterogeneity of structural covariance networks at the individual level.
In this study, the network edge selection was determined based on correlations with long-term prognosis and between-group comparisons. Graph theory analysis was utilized to identify nodes in the network crucial for long-term outcome. Ultimately, machine learning (ML) techniques were employed to predict the extent of motor improvement in patients with PD after STN-DBS.
MATERIALS AND METHODS
Study Design and Participants
The study retrospectively included patients from 2016 to 2022 at Beijing Tiantan Hospital, Capital Medical University, China. Inclusion criteria were: 1) diagnosed with idiopathic PD,26 2) underwent bilateral STN-DBS, 3) completed motor and nonmotor assessments at baseline and at least 1 year postsurgery, 4) met quality control standards on neuroimaging examination. Age-matched health controls (HCs) were individuals aged between 40–80 years without any neurologic disorders. Ultimately, a total of 138 patients with PD were retrospectively included, with 40 HCs. Baseline information is summarized in Table 1.
Baseline and follow-up
Clinical Examinations
Patients underwent detailed clinical assessments included Movement Disorder Society–sponsored Unified Parkinson's Disease Rating Scale (MDS-UPDRS), especially Part III of the MDS-UPDRS (MDS-UPDRS-III), Berg Balance Scale (Berg), Freezing of Gait Questionnaire (FOG-Q), Montreal Cognitive Assessment (MoCA), Hamilton Anxiety Rating Scale (HAMA) and Hamilton Depression Rating Scale (HAMD). These clinical assessments were conducted by 2 movement disorder experts within the first 2 weeks preceding DBS, during both the Med-OFF and on-medication (Med-ON) states. The Med-OFF state was defined as abstaining from antiparkinsonian drugs for at least 12 hours, while the Med-ON state was defined as having taken antiparkinsonian drugs within the previous hour. The levodopa equivalent daily dose for each patient's antiparkinsonian drugs is detailed in Table 1.27 Follow-up assessments were conducted at 1–3 years postsurgery in both stimulation-on (Stim-ON)/Med-ON and Stim-ON/Med-OFF states. The specific surgical procedure and follow-up protocol can be found in the Online Supplemental Data.
The impact of DBS on clinical motor improvement was quantified as a percentage improvement on the MDS-UPDRS-III. MDS-UPDRS-III consists of 33 scores derived from 18 items, with each item scored on a scale of 0 to 4. A score of 0 indicates normalcy, while a score of 4 signifies severe impairment.28 The improvement percentage of DBS was further used to categorize patients into a good improvement group (GIG) and a moderate improvement group (MIG). The formula for calculating the improvement percentage is as follows:

Previous studies have indicated that patients undergoing STN-DBS with an improvement rate exceeding 30% are considered to exhibit a beneficial response to stimulation.11 Therefore, we defined the MIG as patients with an improvement rate of 30% or less. Additionally, the confidence interval for the overall maximum improvement in MDS-UPDRS-III ranges from 69.8 to 45.8.29 Therefore, patients with an improvement rate of 70% or higher were categorized as the GIG. In the group analysis, only patients with DBS improvement rates below 30% and above 70% were included. This was done to enhance sensitivity in the analysis. Detailed information on patient grouping based on DBS improvement rates is shown in Fig 2 and the Online Supplemental Data.
All postoperative images of the patients were reviewed to confirm the absence of electrode displacement. The final follow-up stimulation parameters for both patient groups were comparable (Online Supplemental Data ).
Individual Differential Structural Covariance Network Measures
As the conventional group-level SCN analysis tends to lose individualized network information, we adopted a recently established method, NTP, as outlined by Liu et al,20 to construct individual-specific SCNs. Details of T1 data acquisition and preprocessing can be found in the Online Supplemental Data.
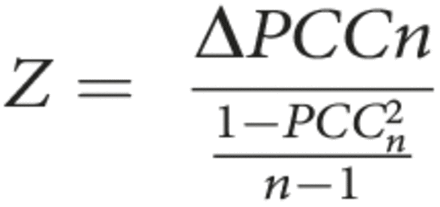
Specifically, we followed the steps depicted in Fig 1. Initially, a reference SCN was constructed within the HC group (n = 40). This network was generated by calculating the partial Pearson correlation coefficient between gray matter volumes of each pair of brain regions, while considering total intracranial volume (TIV) as a covariate, and denoted this value as Pearson correlation coefficient for the nth patient (PCCn). Subsequently, every patient was introduced into the HC group, resulting in n + 1 subjects (n controls and 1 patient), and a new structural covariance network termed the perturbed network PCCn + 1 was constructed. Calculation of the difference between the perturbed network and the reference network, ΔPCCn = PCCn + 1 – PCCn, followed. Lastly, given that ΔPCCn exhibited a novel symmetrical distribution known as the “volcano distribution,”30 we computed the Z score for ΔPCCn by using a Z-test as follows:

Schematic outline of the study. A, Gray matter volumes were computed by using the CAT12 toolbox, and gray matter volumes were extracted based on the AAL3 atlas for all HC and patients with PD. B, Individual structural covariance network computation process for patients. PCC indicates Pearson correlation coefficient.
The individual differential structural covariance network (IDSCN) for every patient was subsequently constructed, where the weight of each edge was determined by the Z-scores obtained from the Z-test. Moreover, we calculated the P value for each edge in the IDSCN for every patient based on the Z score. Finally, we identified edges in each patient's IDSCN that significantly deviated from the reference network, applying Bonferroni correction. The edges within the IDSCN convey how the inclusion of an additional patient altered the covariance of gray-matter volume pairs for specific brain regions compared with the reference group. Ultimately, for each patient, we constructed IDSCN consisting of 12,090 edges, based on 156 brain regions defined by the automated anatomical labelling atlas 3 (AAL3) (Online Supplemental Data). The edges in the IDSCN represent how the covariance between 2 brain regions in an individual patient deviates from the reference structural covariance network observed in HCs.
Network Analysis
We selected a range of sparsity thresholds (K = 0.14 ∼ 0.5, with an increment of 0.01) to binarize the IDSCN and computed global and nodal network topological properties. Global metrics (small-world attributes and global efficiency) and node-level metrics (degree centrality, local efficiency) were calculated by using the Graph Theoretical Network Analysis (GRETNA) software package.31 Definition of graph theory metrics can be found in the Online Supplemental Data.
For each sparsity threshold, network metrics were calculated, and quantitative analysis of graph theoretical metrics was performed by computing the area under the curve (AUC) within the entire sparsity range.
Patients Setting and Multilayer Perceptron Classification
We selected the top 5% of edges based on their Z-scores for subsequent analysis.20 This approach was employed to ensure that such differences would not be confounded by an excessive number of nodes and edges in further intergroup analysis and predictive model construction. First, we assessed whether there existed group-level differences in network properties, which could serve as indicators of long-term prognosis. We divided the data set into training/validation 1) and testing 2) sets in a 7.5:2.5 ratio. Within a set, we ranked the edges based on their correlation with the DBS improvement and considered the absolute values. Additionally, covariates such as age, sex, TIV, and MoCA scores were taken into account. We selected the top 1% of the correlated edges from a set, resulting in 6 edges (n = 6). Subsequently, we conducted group-wise comparisons between these 6 edges in the overall groups.
Next, we employed a multilayer perceptron classifier (neural network) with default parameters from scikit-learn (https://scikit-learn.org/stable/) on the top 1% correlated edges in a set.32 This evaluation aimed to assess the model's ability to differentiate the responsiveness to STN-DBS based on combinations of network edges. We performed 5-fold cross-validation on a set to test the model's performance. Finally, the model was evaluated on testing set. This involved generating receiver operating characteristic (ROC) curves on testing set, plotting the true-positive rate against the false-positive rate. The performance of the tested model was quantified by calculating the AUC of the average ROC curve.
STN-DBS Outcome Prediction Using XGBoost
We utilized XGBoost (https://xgboost.readthedocs.io/en/stable/) to investigate whether preoperative network fingerprints can predict the long-term DBS efficacy for all patients. Initially, we divided the data set into training/validation and testing sets in a 75%:25% ratio, followed by feature selection within the training/validation set where we chose the top 1% of edges. Subsequently, data standardization was performed. Through grid search, we determined the optimal hyperparameter combination for the XGBoost regression model, including the number of base learners (n_estimators) and the weight shrinkage of each base learner (learning_rate). During the hyperparameter search, we experimented with different values to find the best combination. For n_estimators, we explored a range from 10 to 200, while for learning_rate, we explored a range from 0.01 to 0.1.
Following this, we trained the XGBoost regression model on the training data set by using the best hyperparameter combination and evaluated its performance through 5-fold cross-validation on the training/validation data set to assess hyperparameter performance. Subsequently, we assessed the model's performance by predicting long-term DBS improvement on the testing data set. To compute feature importance, we utilized the built-in feature_importances attribute of the XGBoost library, providing the relative importance of each feature in predicting the model. Evaluation metrics included the correlation coefficient between predicted and actual values, offering insights into the model's predictive accuracy. Additionally, we computed the mean squared error (MSE) as a quantifiable measure of overall prediction error.
Statistical Analyses
The comparison of changes in outcomes from baseline to long-term follow-up for all patients, which did not conform to a normal distribution, was assessed by using Wilcoxon signed-rank tests. Following grouping into GIG, MIG, and HC, an analysis of variance was employed to examine age and sex differences among the groups. Comparisons between the GIG and MIG groups underwent a normality test, and if the data followed a normal distribution, a 2-sample t test was applied. Non-normally distributed data were analyzed by using the Mann-Whitney U test. All results are presented as mean ± standard deviation, and statistical significance was defined as P < .05.
Intergroup differences in gray matter network connectivity were evaluated by using ANCOVA tests, with age, sex, TIV, and MoCA scores as covariates. Multiple comparisons were corrected by using the false discovery rate (FDR), and FDR-adjusted P-values (FDR p) below .05 were considered statistically significant. The correlation between gray matter volume network edges and long-term improvement in DBS was assessed by using partial correlation analysis with age, sex, TIV, and MoCA scores as covariates.
RESULTS
Clinical Characteristics
40 HCs and 138 patients with PD with complete long-term follow-up assessments were screened for inclusion. The median follow-up time was 3 years (confidence interval 2.78–3.11). The average age of patients with PD was 62.08 ± 8.52 years, with an average disease duration of 11.72 ± 4.73 years.
Patients with PD exhibited a significant reduction in MDS-UPDRS-III scores, decreasing from an average of 49.86 to 24.61 following long-term STN-DBS (P < .001). Furthermore, tremor and rigidity scores showed significant improvement (P < .001). Other results can be found in Table 1.
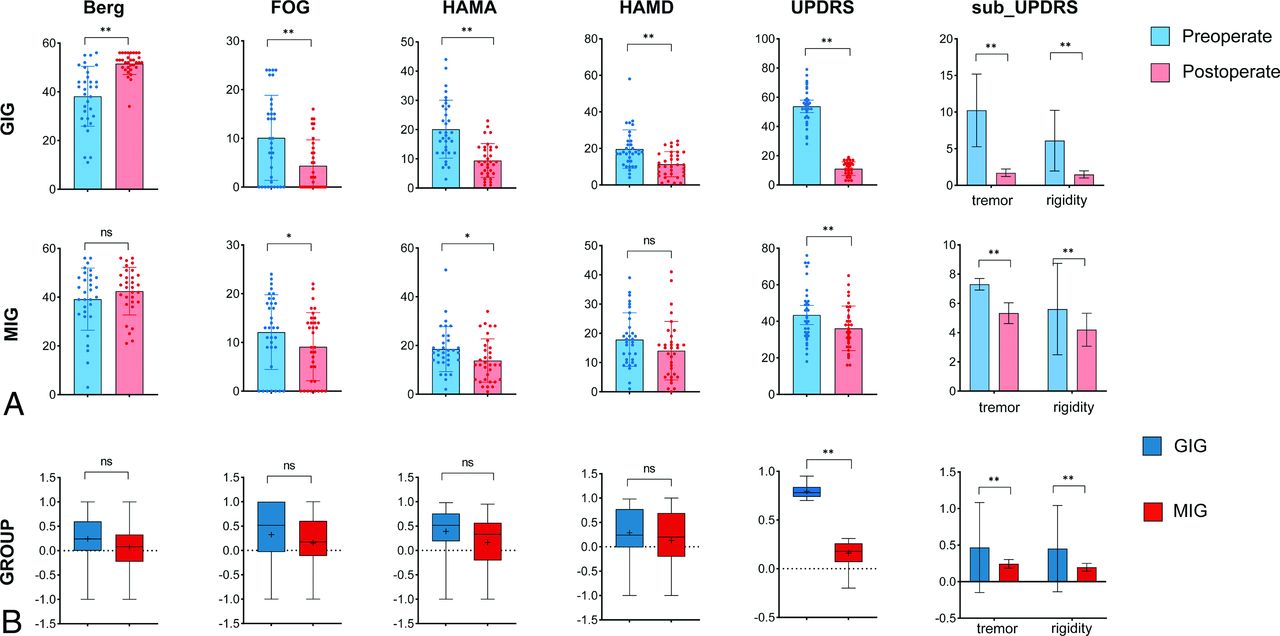
As indicated in the Online Supplemental Data, there were no significant differences observed among the GIG, MIG, and HC groups in terms of age (P = .768) and sex (P = .327). Additionally, there were no significant differences between the 2 patient groups in terms of MDS-UPDRS improvement rates during preoperative levodopa responsiveness testing (P = .854) and disease duration (P = .452). The long-term therapeutic effects on both motor and nonmotor symptoms for the 2 patient groups are presented in Fig 2. Patients in the GIG who exhibited significant improvement in MDS-UPDRS-III scores also demonstrated more pronounced improvements in HAMA, Berg, and FOG-Q.

Clinical Improvement: A, Differences in preoperative and long-term postoperative scores for motor and nonmotor scales in patients with DBS improvement rates in the GIG and MIG. Paired t-tests were conducted for data that passed the normality test, while the Wilcoxon signed-rank test was used for data that did not meet the normality assumption. B, Comparison of the improvement rates in motor and nonmotor symptoms between the GIG and MIG. For normally distributed data, a two-sample t test was employed, whereas the Wilcoxon rank-sum test was used for data that did not meet the normality assumption.
Preoperative Gray Matter and Network Fingerprints
The volume of gray matter did not exhibit significant differences between the 2 groups. In comparison to the GIG group, the MIG group showed significantly increased connectivity Z-scores for the connection between the left middle frontal gyrus and the left caudate nucleus (FDR P = .013), the right olfactory cortex and the right insula (FDR P = .020), the left superior medial frontal gyrus and right insula (FDR P = .020), the right superior frontal gyrus and the left paracentral lobule (FDR P = .009), the right middle frontal gyrus and the right Crus II of the cerebellum (FDR P = .009), and the left lobule VIIb of the cerebellum and the vermis of the cerebellum (FDR P = .009). Detailed results are shown in Fig 3.

Intergroup differences in edges and prediction, A, Comparison of intergroup differences in edges between the GIG (blue) and MIG (red) patient groups for edges that are correlated with DBS improvement rate and ranked in the top 1%. Age, sex, TIV, and MoCA were included as covariates. After FDR correction, significant intergroup differences are found in all 6 edges. B, Prediction of long-term improvement groups in patients using 6 edge features.
Postoperative images of both patient groups were examined, and no electrode displacement was observed. No significant differences in stimulation parameters were found between the 2 groups (Online Supplemental Data). The 6 edges demonstrated good predictive capabilities for long-term efficacy, achieving a maximum AUC of 0.802 when employing the multilayer perceptron classifier (Fig 3B).
Relationship of Network Topologies and DBS Outcomes
We found that global properties showed no significant correlation with long-term DBS outcomes. However, degree centrality and local efficiency exhibited significant correlations with long-term DBS prognosis. The degree centrality of the right middle cingulate cortex (FDR P = .015), left parahippocampal gyrus (FDR P = .025), right postcentral gyrus (FDR P = .034), and vermis 4–5 (FDR P = .011) demonstrated a positive correlation with long-term DBS improvement. Additionally, among the local efficiency, the left parahippocampal gyrus (P = .048), right parahippocampal gyrus (P = .040), right postcentral gyrus (P = .024), left supramarginal gyrus (P = .030), and left lobule 3 of the cerebellum (P = .033) exhibited positive correlations with long-term prognosis. Detailed results are presented in Fig 4, and the Online Supplemental Data.

The relationship between graph theory metrics and long-term treatment outcomes. Red spherical nodes represent brain regions with P-values corrected for false discovery rate below .05. A, Degree centrality of nodes that correlated with long-term motor prognosis. B, Local efficiency of nodes that correlated with long-term motor prognosis.
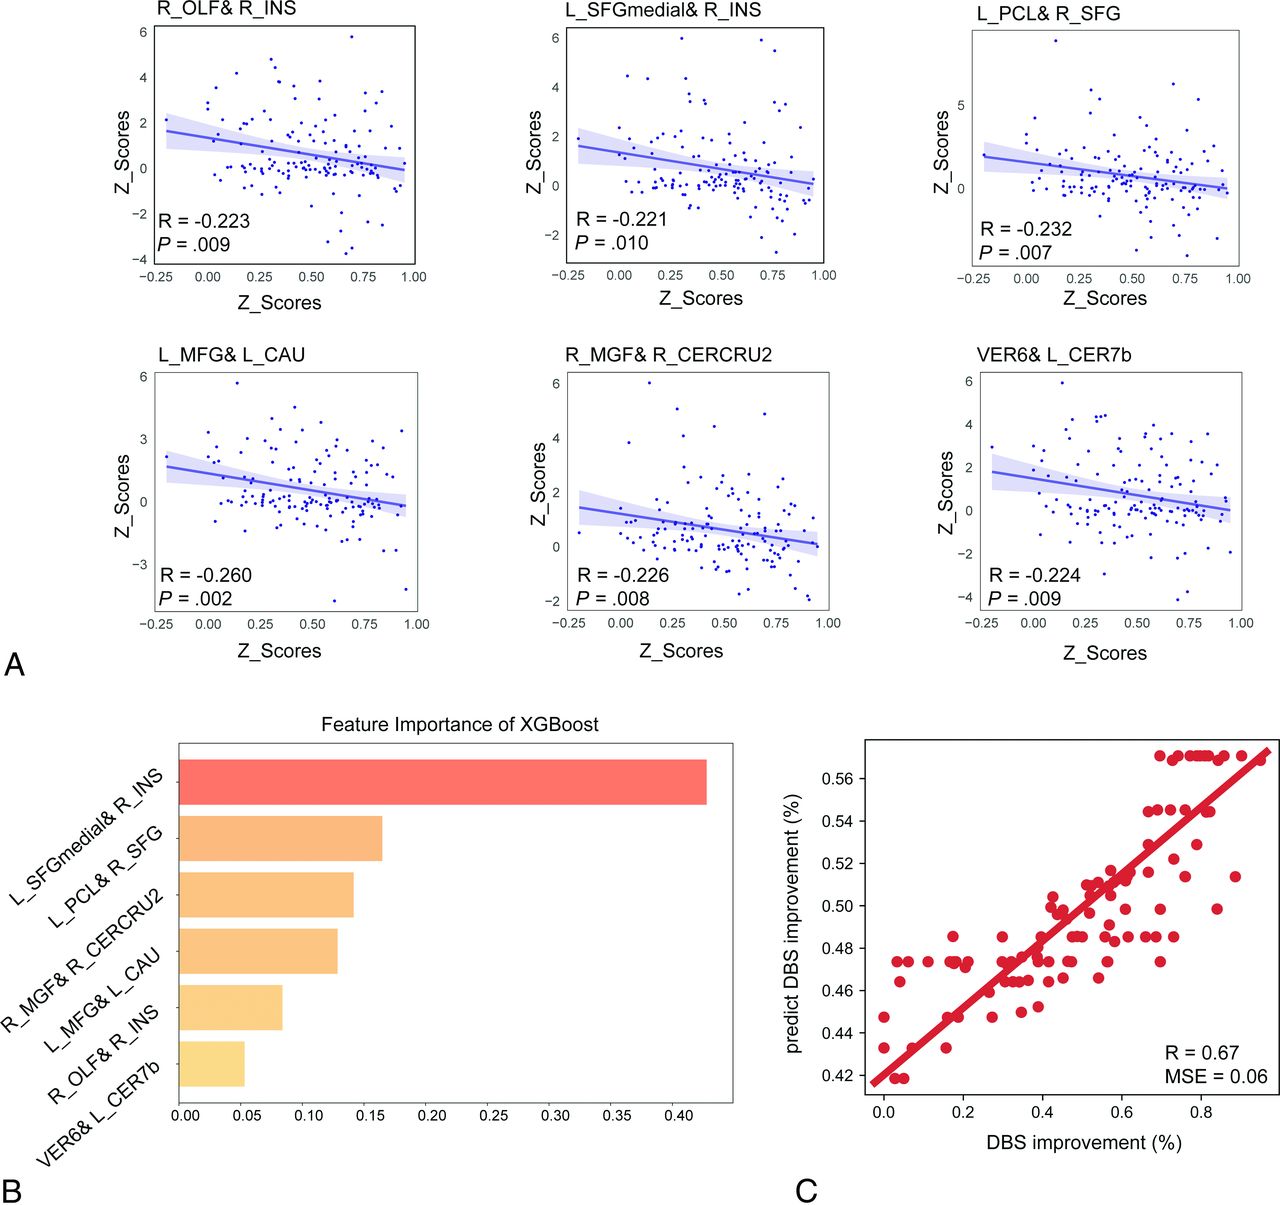
Predictors of STN-DBS Responsiveness
When age, sex, and TIV were considered as covariates, the correlations between the top 1% ranked network edges and DBS improvement rates are depicted in Fig 5. When testing the predictive performance of gray matter volume network fingerprints for long-term efficacy by using XGBoost in the test data set, the correlation between actual values and predicted values was 0.671, with an MSE of 0.055, shown in Fig 5B. The most significant contribution is represented by the edge of the left superior medial frontal gyrus and right insula (0.428).

Individual structural covariance networks for predicting long-term treatment outcomes. A, Six edges of correlations with DBS improvement rates, with age, sex, and TIV as covariates. B, Weights of the 6 edges in predicting long-term DBS improvement rates by using the XGBoost model. C, Correlation between the actual and predicted values of long-term DBS improvement rates for the 6 edges by using the XGBoost model.
DISCUSSION
This study investigated the impact of STN-DBS on long-term motor improvement in patients with PD. The observation revealed that patients with more favorable DBS improvement displayed IDSCN characteristics and network topological attributes that closely resembled those of healthy individuals. Additionally, potential outcome predictors were examined, revealing that IDSCN fingerprints could predict the long-term improvement outcomes of DBS.
The absence of a significant difference in preoperative levodopa responsiveness between the GIG and MIG groups validates previous findings that levodopa responsiveness alone is not a reliable predictor of long-term DBS outcomes.7,33 We did not observe significant differences between the 2 patient groups in terms of stimulation parameters, despite them being recognized as important determinants of long-term postoperative efficacy.34 During the chronic DBS phase following multiple programming adjustments, suboptimal outcomes were still evident in some late-stage patients with PD.35 This underscores the substantial challenge of accurately selecting appropriate candidates for DBS therapy.36 Intriguingly, we did not detect differences in gray matter volume within individual brain regions between the 2 patient groups; rather, differences were observed exclusively within the gray matter network. This suggests that long-term efficacy in these patients may be more influenced by network characteristics rather than structural abnormalities within isolated brain regions.
The correlation analysis between the topological properties and long-term clinical outcomes revealed that the parahippocampal area, postcentral gyrus, and supramarginal gyrus, as well as the cerebellum, exhibited nodal local efficiency and degree centrality positively correlated with improved long-term outcomes. These regions are implicated in spatial cognition and motor coordination,37 with previous cortical structural studies reporting atrophy in these areas among patients with PD.38 While we did not validate our findings with an external data set, our results align with previous research, particularly in the comparison of PD to HC. Patients with PD exhibit a disrupted topological organization of cortical morphologic networks with a significant decline in local efficiency.39 Our results suggest a network with greater structural integration and reduced isolation might be more susceptible to modulation by DBS. This observation aligns with previous research findings that indicate DBS exerts widespread regulatory effects on functional connectivity within cortical regions.15
Notably, the abnormal motor-cognitive gray matter network fingerprint identified in this study may serve as one of the key explanations for the observed long-term efficacy disparities. These network aberrations primarily stem from reconfigurations within the motor-cognitive network, such as alterations between the frontal cortex and cerebellum, the caudate nucleus, as well as the frontal cortex and the paracentral lobule (PCL). The role of frontal lobe function and structural abnormalities in influencing the long-term motor efficacy of DBS stimulation has been elucidated in patients with PD.3,22,40 The cerebellum–basal ganglia–frontal network aberrations play a pivotal role in the motor coordination and control deficits observed in patients with PD.41 The frontal cortical function may deteriorate in response to high-frequency STN-DBS stimulation, exacerbating patients' motor coordination and cognitive abilities.42 Our research findings indicate that structural covariation connections between the cerebellum, frontal cortex, and caudate nucleus have predictive value for the motor outcomes of DBS, providing evidence for the necessity of higher-level cognitive network control in motor coordination. Indeed, as demonstrated by some studies, patients with PD with more severe caudate nucleus damage43 and lower frontal lobe scores3 tend to exhibit poorer long-term motor prognosis.
To date, despite an abundance of studies elucidating potential determinants of long-term outcomes following DBS, most investigations have centered around preoperative assessments, such as gait scores,44 postural stability,35 and frontal scores.3 However, these scales require substantial time and personnel, and their susceptibility to the vagaries of subjective assessments by clinicians and the influence of patients' anxious states in the clinical setting.45 In contrast, the motor-cognitive gray matter network fingerprint remains impervious to emotional factors and variations in the expertise of clinicians. In a broader context, the characteristics of the preoperative motor-cognitive gray matter network fingerprint may be indicative of specific cerebral behavior patterns in patients with PD.
This study has several limitations, including the fact that our evaluation was focused on overall long-term motor improvement, and we did not assess issues such as posture, gait, and articulation disturbances following long-term stimulation.46,47 It is also restricted by its retrospective, single-center design, meaning we only have MR imaging from our center. This limitation makes it difficult for us to validate our findings across multiple centers or use different types of scanning devices. Additionally, conducting repeated scans on patients by using the same device to confirm the stability of the results is also challenging due to the retrospective nature of this study. Finally, due to limitations in sample size, we were unable to conduct comparisons between subtypes, and the grouping method employed was somewhat broad to enhance statistical sensitivity.
CONCLUSIONS
Our findings suggest a potential correlation between individual structural covariance network fingerprints in patients with PD and long-term motor outcomes following STN-DBS. However, it is important to interpret these results cautiously, as further validation and larger-scale multicenter studies are needed to confirm the robustness and generalizability of this observed association. The integrity of network topology, along with disruptions in network separations, is closely intertwined with long-term motor prognosis. Furthermore, we have identified that continuous and binary structural covariation network connections between the cerebellum, basal ganglia, frontal cortex, and PCL can predict the motor improvement associated with STN-DBS at the individual patient level. The weighted T1 measure, apart from serving as a necessary tool for preoperative localization, holds promise as a valuable biomarker for preoperative assessment of DBS candidates based on their individual structural covariation network fingerprints.
Footnotes
This research has been supported by the National Natural Science Foundation of China (Grant No. 81830033, 81671104, 61761166004).
Disclosure forms provided by the authors are available with the full text and PDF of this article at www.ajnr.org.
References
- Received December 18, 2023.
- Accepted after revision March 10, 2024.
- © 2024 by American Journal of Neuroradiology


Jump to section
Related Articles
Cited By...
- No citing articles found.