
Graphical Abstract

Abstract
BACKGROUND AND PURPOSE: The 10th week of gestational age (GA) is a critical period for evaluating brain development, but there is limited knowledge regarding the specific characteristics at this GA. This study is to map the brain structures at 10 weeks’ GA by using 9.4T MRI and histologic sections.
MATERIALS AND METHODS: Six fetal specimens with normal brain development were imaged by using 9.4T MRI, followed by sectioning and staining. The 3D reconstruction models and quantitative measurements were obtained with Amira software.
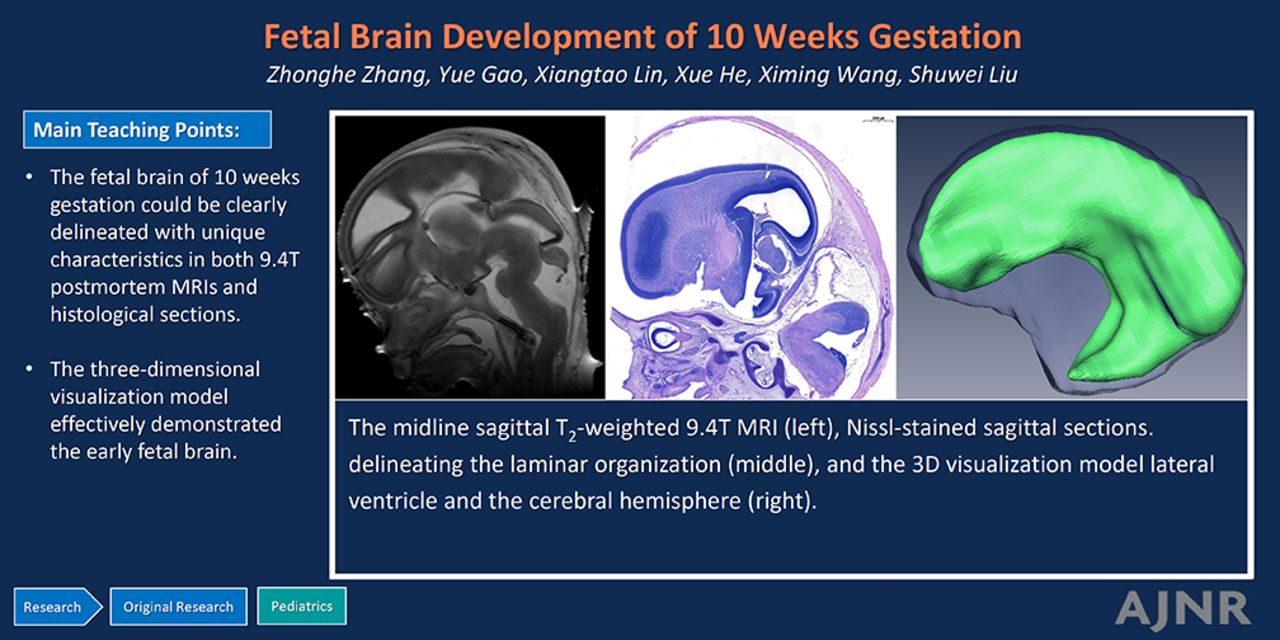
RESULTS: Four zones of the laminar organization were identified in T2-weighted MRIs, while 6 zones were delineated in the corresponding histologic sections, demonstrating a strong consistency between the two. The key structures, including the midline structures, choroid plexus, subcortical nuclei, ventricles, brainstem, and cerebellum, were clearly distinguishable with unique characteristics in both MRIs and histologic sections. The 3D visualization model effectively demonstrated the shape, spatial positions, and interrelationships of the early fetal brain structures, and their qualitative measurements were obtained. The lateral ventricles and choroid plexus constituted a substantial proportion, with the lateral ventricles accounting for 43.0% of the cerebral hemisphere and the choroid plexus comprising 41.2% of the lateral ventricles.
CONCLUSIONS: At 10 weeks’ GA, the fetal brain is in an early developmental stage. The integration of 9.4T T2-weighted MRIs, 3D reconstruction, and histologic sections offers a comprehensive view of the early fetal brain’s characteristics, providing valuable insights for clinicians and anatomists.
ABBREVIATIONS:
- GA
- gestational age
- US
- ultrasound
- micro-CT
- microfocus CT
SUMMARY
PREVIOUS LITERATURE:
Fetal brain abnormalities can occur, but may not be confidently detected and diagnosed in the first trimester. The 10th week of GA can be regarded as an important node for evaluating brain development. However, very little is known about the exact anatomic characteristics at this GA.
KEY FINDINGS:
The fetal brain of 10 weeks’ GA could be clearly delineated with unique characteristics in both MRIs and histologic sections. The 3D visualization model effectively demonstrated the early fetal brain structures, and their qualitative measurements were obtained.
KNOWLEDGE ADVANCEMENT:
The integration of 9.4T T2-weighted MRIs, 3D reconstruction, and histologic sections offers a comprehensive view of the characteristics of the early fetal brain.
Fetal brain development is a highly complex, dynamic, and orderly process, typically divided into the first, second, and third trimesters.1 These 3 trimesters correlate closely with different stages of CNS development.2 The first trimester is particularly critical, characterized by extensive neurogenesis and cell migration.3 Consequently, developmental abnormalities can arise but may not be easily detected or diagnosed via ultrasound (US) or MRI due to the small size of the fetal brain.4,5
The 10th week of gestational age (GA) marks the end of the first trimester and serves as a pivotal point for evaluating fetal brain development. It may also represent an early opportunity for disease detection and diagnosis. Analyzing the normal morphologic characteristics at this GA offers an important opportunity to lay the groundwork for earlier diagnosis and monitoring of congenital or development-related disorders.
Currently, in vivo fetal MRI is an effective complementary method when US findings are inconclusive or insufficient. It is commonly performed at a 1.5T magnetic field strength, by using special fast sequences with slice thicknesses of approximately 3–5 mm. However, this approach is inherently limited by constraints in spatial and contrast resolution and is often influenced by artifacts due to fetal motion and from various maternal structures such as arterial pulsations.6 As a result, in vivo fetal MRI may encounter limitations in resolving small brain structures during the early developmental phase. Therefore, obtaining developmental patterns of the fetal brain through ultra-high-field postmortem MRI is both essential and valuable.
MATERIALS AND METHODS
Selection of the Specimens
Six fetal specimens of 10 weeks’ GA (3 boys, 3 girls) were collected from the Cheeloo College of Medicine, Shandong University. They were from medically indicated or spontaneous abortions caused by shock and uterine trauma as a result of accident, uterine myoma, or incompetence of the internal orifice of the uterus. They had to meet the following inclusion criteria1: the maternal pregnancy records with absence of a documented fetal chromosomal abnormality, maternal genetic disease, or a history of seizures in the case of eclampsia; results of US examination during pregnancy indicating an anatomically normal and developmentally appropriate fetal CNS; further validated detailed autopsy also describing no detectable CNS malformations. This study was conducted on the basis of approval of the ethical committee at the Shandong Provincial Hospital.
Image Acquisition
MRIs of the specimens were acquired on a 30-cm bore 9.4T magnet (Bruker BioSpec 94/30) with a maximum gradient strength of 660 mT/m on each axis. A high-sensitivity surface receive-only mice coil was used for signal reception (Bruker CryoProbe). The scanning parameters were as follows: T2-weighted: section thickness, 0.5 mm; section interval, 0.5 mm; TR, 8000 ms; TE, 33 ms; matrix size, 256 × 256; number of excitations, 4; field of view, 3 × 3 cm; acquisition time, 40 minutes, 28 seconds.
Image Processing
The T2-weighted MRIs were manually segmented and reconstructed with Amira 5.2.2 software (www.amira.com), performed by Z.Z. and Y.G., radiologists, with more than 5 years of post-training experience. The laminar organization, lateral ventricle, choroid plexus, germinal matrix, brainstem, fourth ventricle, and cerebellum were manually traced out on each image (Fig 1). The 3D reconstruction models and quantitative measurements of the segmented structures (including volume, surface area, and thickness) were automatically obtained after segmentation. Then the choroid plexus/lateral ventricle ratio and the lateral ventricle/cerebrum ratio were calculated. All the measurements were averaged among specimens.

Methods of image segmentation with Amira. A, The original transverse T2-weighted MRI. Segmentation (B) and different colors are filled (C). 1, germinal matrix; 2, choroid plexus; 3, lateral ventricle; 4, ventricular zone; 5, cortical plate; 6, marginal zone; 7, midbrain; 8, third ventricle; 9, midbrain aqueduct; 10, thalamus. *For the mixed periventricular, subventricular, intermediate, and subplate zones.
The tegmento-vermian angle and pontine-medullary angle were measured on the midline sagittal plane of brainstem and cerebellum. The tegmento-vermian angle was formed by 2 lines, drawn along the ventral surface of the developing vermis and the dorsal surface of the brainstem’ respectively. The vertex of the pontine-medullary angle was the lowest point of the fourth ventricle, followed by 2 lines drawn along the dorsal surface of the pons and medulla respectively (Fig 2A).

The midline sagittal (A), transverse (B), and coronal (C) T2-weighted 9.4T MRIs. The black angle and the white angle in (A) represent the pontine-medullary angle and the tegmento-vermian angle, respectively. 11, embryonic lamina terminalis; 12, hippocampal commissure; 13, foramen of Monro; 14, hypothalamus; 15, optic chiasm; 16, pituitary gland; 17, third ventricle pia mater; 18, pineal gland; 19, pons; 20, medulla; 21, posterior fossa choroid plexus; 22, anterior membranous area; 23, developing vermis; 24, posterior membranous area; 25, caudate nucleus; 26, lenticular nucleus; 27, lateral recess of the fourth ventricle; 28, lower rhombic lip.
The Nissl-Stained Sections
Three specimens were fixed in 4% paraformaldehyde solution for more than 24 hours, followed by dehydration, waxing, embedding, and sectioning, with slice thickness of 4 μm. Slices were stained with H&E, and photographed under a 400× optical microscope.
RESULTS
Cerebral Laminar Organization
In MRIs, 4 distinct zones were identified: the ventricular zone, the mixed zones (comprising the periventricular zone, the subventricular zone, the intermediate zone, and the subplate zone), the cortical plate, and the marginal zone, arranged from innermost to outermost. The ventricular zone, characterized by low signal intensity, was relatively thick and continuous with the germinal matrix. The mixed zones exhibited uneven high signal intensity and represented the thickest region, extending into the basal ganglia. The cortical plate was relatively thin, delineated with low signal intensity, while the marginal zone was the thinnest, displaying with high signal intensity (Fig 1A, Fig 2, Fig 3A, -B).

The paramidline sagittal (A) and coronal (B) T2-weighted 9.4T MRIs, and the corresponding Nissl-stained sections (C–F). C, The sagittal section, mainly delineating the laminar organization. D and E, The higher-power view of the laminar organization and the choroid plexus, respectively. F, The sagittal section, mainly delineating the brainstem and cerebellum. 29, cerebellar hemisphere; 30, fourth ventricle; 31, periventricular zone; 32, mixed subventricular and intermediate zone; 33, subplate zone; 34, intermediate zone; 35, molecular zone; 36, granulosa precursor cell zone; 37, epithelial cell; 38, connective fiber matrix; 39, blood vessel.
In Nissl-stained sections, 6 distinct layers were identified: the ventricular zone, the periventricular zone, the mixed subventricular and intermediate zones, the subplate zone, the cortical plate, and the marginal zone, arranged from innermost to outermost. The ventricular zone exhibited a dark blue staining, indicating a high attenuation of packed neurons. In contrast, the periventricular zone displayed lighter staining, suggesting a sparser distribution of neurons. The mixed subventricular and intermediate zones showed blue staining, indicating a comparatively attenuated population of neurons. The subplate zone was thick and stained pink, reflecting a small number of migrating neurons and abundant fibers. The cortical plate also stained blue, indicating a relative concentration of neurons, while the marginal zone was thin and stained light pink, suggesting the sparsest neuronal presence (Fig 3C, -D).
There was strong concordance in delineating the fetal laminar organization between the MRIs and histologic sections. Low signal intensity zones in MRIs correlated with the densely populated neurons in the histologic sections, such as the ventricular zone. Conversely, high signal intensity zones corresponded to sparsely populated neurons and fiber-rich regions in the histologic sections, such as the subplate zone and the marginal zone (Fig 3A–D).
There were region-specific cerebral cortical layer differences. The laminar organizations were the thickest in the middle regions of the lateral part of the telencephalon, near the origins of the lateral sulci, and their boundaries were clearly defined. As the cerebral cortex extended peripherally, the layers gradually thinned and their boundaries became less distinct. The thinnest regions were located in the medial part of the telencephalon, where the layers merged at the junction of the diencephalon and telencephalon. The parallel laminar organizations were the most distinguishable and typical in the parieto-occipital region of the brain (Fig 1A, Fig 2, Fig 3A–D).
Midline Structures
The embryonic lamina terminalis, located in the median wall of the telencephalon and rostral to the optic chiasm, was observed with uneven high signal intensity. Within it, the commissural plate appeared as a thickening. Although the anterior commissure and the bed for the corpus callosum could not be precisely distinguished, the hippocampal commissure was clearly delineated anterosuperior to the foramen of Monro with low signal intensity. The third ventricle, covered by a double unfolded layer of pia mater, presented as a continuous and uninterrupted fissure between the thalamus and hypothalamus, which was still in the process of separating. Both the pituitary gland and pineal gland were observed with low signal intensity (Fig 2A).
Lateral Ventricle and Subcortical Nuclei
The lateral ventricles constituted the largest component of the ventricular system, with the choroid plexus being the most prominent. The edges of the choroid plexus were tortuous and highly folded, exhibiting low signal intensity. Most inner areas of the choroid plexus displayed high signal intensity, interspersed with low signal strips in the center (Fig 1A, Fig 3A, -B). In Nissl-stained sections, 3 distinct layers were identifiable. The peripheral edge of the choroid plexus consisted of a single layer of epithelial cells, stained dark blue. The inner regions comprised a substantial amount of loose connective fiber matrix, stained pink, with multiple cross-sections of blood vessel scattered throughout (Fig 3E).
The dorsal thalamus could be clearly delineated in MRIs. The caudate nucleus, located on the posterolateral side of the germinal matrix, was observed with slightly low signal intensity. The lenticular nucleus, which includes globus pallidus and putamen, was also distinguishable. The internal capsule was situated among these structures, with the anterior limb displaying high signal intensity while the posterior limb exhibited low signal intensity (Fig 2B).
The Brainstem and Cerebellum
The brainstem develops a notable kink, known as the dorsal pontine flexure, with the pontine-medullary angle approximately 103.3°. The ratios of the substructures (midbrain, pons, medulla) to total brainstem volume were 52.1%, 23.4%, 24.5%, respectively. The posterior fossa choroid plexus, characterized by low signal intensity, was the most prominent in the thin roof and lateral recess of the fourth ventricle. The anterior membranous area was short and small, connecting the developing vermis to the posterior fossa choroid plexus, while the posterior membranous area was wide, large, and discontinuous, delineated with low and thin signal intensity. The foramen of Magendie was present (Fig 2A, Fig 3A, -F).
The cerebellum appeared with a smooth surface, lacking any visible fissures, and the dentate nucleus could not be clearly identified. Although the cerebellar divisions and lobes were not yet distinguishable, midline cerebellar tissue containing the vermis anlage (developing vermis) was present (Fig 2, Fig 3A, -F). The tegmento-vermian angle was approximately 47.5°. In Nissl-stained sections, 3 layers were observed: the intermediate zone, the molecular zone, and the granulosa precursor cell zone, arranged from innermost to outermost (Fig 3C, -F).
The 3D Visualization Model
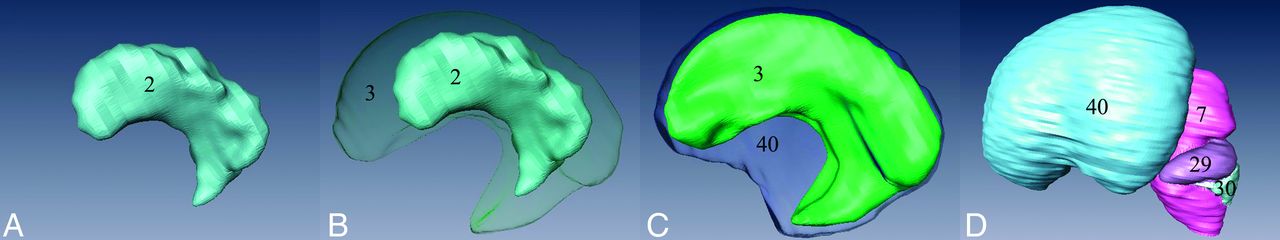
The morphology of the 3D visualization model of the choroid plexus closely resembled that of the lateral ventricle. However, the surface of the choroid plexus was characterized by roughness and unevenness, indicative of a highly folded epithelial cell zone. It occupied a substantial portion of the lateral ventricle, with the ratio of the choroid plexus volume to that of the lateral ventricle being approximately 41.2% (Fig 4A, -B).

The 3D visualization models of the choroid plexus (A), choroid plexus and lateral ventricle (B), lateral ventricle and the cerebral hemisphere (C), and the total brain (D). 40, cerebral hemisphere.
The lateral ventricle did not yet develop its typical shape and lacks distinct anterior, posterior, and inferior horns. Its surface appeared smooth and even, occupying a large area in the cerebral hemisphere. The ratio between the lateral ventricle volume to that of the cerebrum was approximately 43.0% (Fig 4B, -C).
The 3D visualization model effectively illustrated the shape, spatial positions, and relative relationship of the structures of the early fetal brain (Fig 4D).
Qualitative measurements of the brain are provided in Supplemental Data.
DISCUSSION
During early fetal brain development, neurons migrate radially and tangentially from the germinal layers to their designated locations, stopping at defined positions within the cerebral cortex. The normal laminar organization results from the precisely controlled processes of migration, differentiation, and maturation of the neurons.7 Disturbances from genetic or environmental cell-cell interactions may lead to migration problems, resulting in improper placement and arrangement of neurons, which can manifest as abnormal clusters of gray matter in inappropriate locations.8 Heterotopia, characterized by the abnormal distribution of neuronal cells within the white matter, is associated with various congenital diseases and deformities.9 Here, we have demonstrated that 4 distinct laminar zones were readily identifiable on MRI, namely, the ventricular zone, mixed zone, cortical plate, and marginal zone, arranged from innermost to outermost. However, it may be challenging to identify and confirm layering disturbances at this early stage. These abnormalities may become more apparent later, particularly by the end of the second trimester (approximately 18–20 weeks’ GA), when laminar organizations are more typical.10
In humans, the choroid plexus of the lateral ventricles first appears at 7 weeks’ GA. By 9 weeks’ GA, it occupies approximately one-third of the ventricular space. By 11 weeks’ GA, it expands to fill most of the ventricular volume.11 First-trimester prediction of ventriculomegaly by using ratios of fetal choroid plexus to lateral ventricle/head is promising. Ratio of fetal choroid plexus to head size is a simple sonographic marker of open spina bifida at 11–13 weeks’ GA.12 In this study, the choroid plexus, tortuous and highly folded, accounted for approximately 41.2% of the lateral ventricles, which may serve as a reference for early fetal development.
By 8 weeks’ GA, the growth of the corpus striatum forms the C-shaped appearance of the lateral ventricles.13 By the end of the first trimester, the lateral ventricles continue to expand rapidly, occupying a substantial portion of the cerebral hemispheres and outpacing the growth of surrounding parenchyma.13 Our observations indicate that the lateral ventricle at 10 weeks’ GA had not yet developed its characteristic shape but occupied a large area within the cerebral hemisphere. It is generally believed that the third ventricle remains a continuous and uninterrupted fissure due to the ongoing separation of the hypothalamus and diencephalon at this stage. However, in our study, the third ventricle was not fully visible along the midline, likely due to the apposition of its walls and the effects of gravity.
Documenting the ratios of brainstem substructures is valuable, as these undergo obvious changes during development, and the relatively large size of the tectum can be surprising at this GA. Late in the embryonic period, the foramen of Magendie arises in the posterior membranous area, caudal to the choroid plexus of the fourth ventricle, and forms a connection between the fourth ventricle and the subarachnoid space. The anterior membranous area disappears during the formation of the vermis. If this area is not incorporated into the developing choroid plexus or if there is a delayed opening of the aperture of Magendie, the roof of the fourth ventricle can balloon posteriorly to form a fourth ventricular cyst, and give rise to the Dandy-Walker malformation.14
During the first and second trimester, the cerebellum does not occupy the entire posterior cranial fossa, and the fourth ventricle was an open space until 16 weeks’ GA,15 as typically described in this study. The tegmento-vermian angle was approximately 37.5° at 14 weeks’ GA in Liu’s study,15 slightly smaller than the 47.5° in this study. Although distinct cerebellar parenchymal substructures could not be distinguished by MRI, both cerebellar hemisphere and vermis tissue were assumed to be present since the apical portion of the central cerebellar primordium corresponds to the vermis anlage.14
According to current recommendations for first-trimester US, the fetal head structures that should be visualized are limited to the cranial bones, the midline falx, and the choroid-plexus-filled ventricles.16 Previous studies have established the advantages of 3D visualization in the clinical assessments of fetal brain development.1,15 However, reconstructing the brain from in vivo fetal MRIs remains challenging, due to the substantial scanning thickness (3–5 mm) and limited image resolution. Consequently, despite the detailed insights provided by fetal MRIs and embryological research, there remains a gap in our understanding of 3D visualization models and quantitative measurements of the brain and its internal structures, particularly during the early stages of development.
Microfocus-CT (micro-CT) and ultra-high-field postmortem MRI can both be used to study human fetal anatomy for clinical and research purposes. Micro-CT enables high-resolution imaging of fetal specimens in relatively short scanning time. However, special preparation of specimens for tissue staining by using a contrast iodine solution is always necessary to enable soft-tissue visualization. Ultra-high-field postmortem MRI enables high-resolution imaging of fetal specimens, without the necessity of prior staining, but with the drawbacks of long scanning time and high costs.17
There are several limitations for this study. First, there are differences between in vivo and postmortem MRI, which may limit the clinical application of our findings. Second, all scanned fetal specimens had undergone formalin fixation, and the morphologic discrepancies between the formalin-fixed brain and the in vivo samples must be acknowledged. Third, other imaging sequences could enhance visualization, besides the T2-weighted sequence used in this study. For example, the choroid plexuses are challenging to visualize with T2-weighted imaging due to their hyperintense signal, indistinguishable from that of CSF. In contrast, proton attenuation or fluid-attenuated inversion recovery sequences may provide superior visualization of the choroid plexuses. Additionally, diffusion-weighted imaging sequences could uniquely characterize the developing laminar organization and white matter fiber bundles. T1-weighted sequences, despite requiring longer acquisition time, can offer high contrast and may be beneficial for delineating fetal anatomy and associated pathologies. Finally, although we endeavored to select specimens with anatomically normal and developmentally appropriate fetal brains, maternal diseases or conditions could impact brain growth, potentially leading to developmental delays, arrests, or malformations, particularly given the small sample size in this study.
CONCLUSIONS
The fetal brain of 10 weeks’ GA is still at an early developmental stage. Our findings reveal a strong correlation between the 9.4T T2-weighted MRIs and histologic sections in accurately delineating the fetal brain. The integrated application of the postmortem MRIs, 3D reconstruction, and histologic sections provides a comprehensive understanding of fetal brain characteristics, which may serve as a valuable reference for clinicians and anatomists.
Footnotes
This research has been supported by the Academic Promotion Program of Shandong First Medical University; the Ministry of Science and Technology of the People’s Republic of China, National Natural Science Foundation of China, China National Funds for Distinguished Young Scientists (81300497), Department of Education of Shandong Province, Doctoral Foundation of Shandong Province (BS2013YY025), and the Department of Science and Technology of Shandong Province, Natural Science Foundation of Shandong Province, (ZR2021MH216).
Disclosure forms provided by the authors are available with the full text and PDF of this article at www.ajnr.org.
References
- Received August 7, 2024.
- Accepted after revision October 30, 2024.
- © 2025 by American Journal of Neuroradiology


Jump to section
Related Articles
Cited By...
- No citing articles found.