
Abstract
BACKGROUND AND PURPOSE: No widespread clinical method provides specific information about the angiogenic characteristics of gliomas. We characterized blood volume and vascular morphologic parameters from combined gradient-echo (GE) and spin-echo (SE) MR imaging and assessed their relationship to tumor grade, a known correlate of glioma angiogenesis.
METHODS: Simultaneous GE and SE echo-planar imaging was performed with bolus gadolinium administration (0.20–0.25 mmol/kg) in 73 patients with glioma. To diminish possible T1 changes due to contrast agent extravasation, a preload (0.05–0.10 mmol/kg) was administered before the study, and a postprocessing correction algorithm was applied. Image maps of total (GE) and microvascular (SE) relative cerebral blood volume (rCBV) and the mean vessel diameter (mVD) calculated from the ratio of GE and SE relaxation rate changes (ΔR2*/ΔR2) were compared with tumor grade. A nonparametric K nearest-neighbor decision rule was applied to determine if the combined data could be used to distinguish low-grade (I–II) from high-grade (III–IV) tumors on a per-patient basis.
RESULTS: For whole tumors, significant correlations were found between GE rCBV and grade (P < .0001) and between mVD and grade (P = .0001) but not between SE rCBV and grade (P = .08). For areas of highest SE rCBV (microvascular hotspots), SE rCBV and tumor grade were significantly correlated (P = .0007). In terms of differentiation, 69% of low-grade tumors and 96% of high-grade tumors were correctly classified.
CONCLUSION: Combined GE and SE MR imaging provides information consistent with neoplastic angiogenesis, demonstrating its potential to aid in optimizing treatments, categorizing lesions, and influencing patient care.
Although the incidence of brain tumors is only about 17,000 cases per year, they represent a considerable medical problem, as 60% of these tumors are malignant (1). Malignant gliomas represent the second leading cause of cancer mortality in people younger than 35 years, the fourth leading cause in those younger than 54 years, and a leading cause of lost productivity in this population (2). Despite standard therapies such as surgery, radiation therapy, and chemotherapy and despite the considerable effort spent to optimize such treatments, the median survival of patients with malignant gliomas ranges from 8–9 months to 2–3 years. The most aggressive gliomas are those characterized by the formation of new blood vessels, a process called angiogenesis. Tumor angiogenesis is a pathophysiologic process that has been linked to tumor viability, as well as tumor grade (3, 4). Consequently, a noninvasive measure of these parameters offers the potential to optimize treatments, categorize lesions, and influence their management. In addition, the noninvasive assessment of angiogenesis could provide a way to efficiently evaluate new drugs that inhibit angiogenesis (i.e., antiangiogenic agents) (5–8), which are particularly promising alternatives for patients with these tumors.
The current practice of obtaining contrast-enhanced MR images of brain tumors does not provide specific information about tumor angiogenesis, because most contrast agents in current clinical use highlight disruptions in the blood-brain barrier. Alternatively, dynamic susceptibility contrast-enhanced MR imaging methods, which allow the creation of cerebral blood volume (CBV) maps, have the potential to provide more specific information about vascular morphology and physiology. With this approach, a bolus of a gadolinium-chelated contrast agent is administered to induce a gradient of susceptibility between the contrast agent–containing vessel and tissue. Image signal intensity, which transiently decreases (9), is converted into a relaxation rate change, which is assumed to be proportional to the fraction of blood volume within each image pixel. Since the arterial contrast agent concentration is typically not measured, the resulting image maps show relative (regional) CBV (rCBV) values and are therefore referred to as rCBV maps. Several laboratories have demonstrated the feasibility of determining rCBV in patients with brain tumors (10–22). Preliminary findings suggest that MR imaging-derived rCBV may better differentiate histologic tumor types than conventional MR imaging and may provide information to predict glial tumor grade (10, 12, 14, 19, 21, 23–29). In addition, rCBV maps may aid in the differentiation of post-treatment changes from tumor recurrence (15, 22, 30) and be predictive of early local recurrence or malignant transformation (31).
Although the standard approach has been to acquire rCBV maps by using either gradient-echo (GE) or spin-echo (SE) imaging methods, our approach was to acquire GE and SE rCBV maps simultaneously. The rationale for this approach is based on numerical simulations (32, 33) and measurements (34) indicating that SE and GE images have different sensitivities to the size scale of field inhomogeneities, resulting in a differential sensitivity to vessel diameter. Consequently, SE changes are assumed to be maximally sensitive to the microvascular blood volume (vessel diameters less than about 25 μm), whereas GE changes are sensitive to total blood volume. Although microvascular density has been the histologic criterion standard for assessing the degree of angiogenesis, one may hypothesize that SE rCBV maps may be more clinically useful for in vivo monitoring.
In addition to obtaining total and microvascular blood volume maps, GE and SE information can be combined to provide an index of vessel diameter. An animal tumor model demonstrated that the ratio of GE and SE relaxation rates (ΔR2*/ΔR2), measured in the presence of a long-lived intravascular contrast agent, is significantly correlated with vessel diameter (35, 36). The feasibility of determining this ratio in patients by using a gadolinium-chelated contrast agent has been suggested in an initial pilot study (19).
The purpose of this study was to characterize the parameters derived from combined GE and SE dynamic susceptibility contrast-enhanced MR imaging and their relationship to tumor grade. Given the known relationship between tumor grade and angiogenesis (3), this may serve as a first step in determining the role of this approach in the evaluation of angiogenesis as well as conventional and antiangiogenic therapies.
Methods
Patients
Patients with suspected cerebral neoplasm owing to prior imaging findings or a history of a biopsy-proved neoplasm were referred for rCBV studies. Patients who elected not to participate or who were too ill to remain still during imaging were excluded. All patients who underwent rCBV mapping provided informed written consent under guidelines approved by our institutional review board. Studies were excluded if a tissue diagnosis was not available or did not reveal a glioma, if they were follow-up rCBV studies (as we were limiting this investigation to one rCBV study per patient), or if the data were corrupted by patient motion or an archive error that precluded postprocessing.
Given these criteria, results from 73 patients with confirmation of tissue diagnosis were evaluated. The Table lists the age, sex, and pathologic diagnosis for all patients who had tissue confirmation of the diagnosis. The patient group consisted of 46 men and 27 women, with an age range of 19–80 years. Tumors were classified and graded according to the World Health Organization (WHO) 1993 classification (37). With respect to the astrocytoma, a four-tiered system was applied. At our institution, oligodendroglial subtypes are graded with a similar four-tiered system, and one oligodendroglial tumor was indeed given grade IV, as it demonstrated all the features of a glioblastoma but with a strong preponderance of oligodendroglial neoplastic cells (Table, patient 7). The ependymoma in our series was a grade II lesion. It demonstrated some foci of necrosis and mitoses, although not necessarily indicative of malignancy. One grade I lesion was included in this series (Table, patient 65). The grade II tumors included one ependymoma, 10 astrocytomas, three oligodendrogliomas, and one neurocytoma. The grade III tumors included 16 anaplastic astrocytomas and two malignant oligodendrogliomas. The grade IV tumors included 38 de novo and recurrent glioblastoma multiforme and one anaplastic oligodendroglioma.
Patient histology and imaging results
MR Imaging
All studies were performed with one of two 1.5T MR imaging systems: one fitted with body gradient coils capable of echo planar imaging (General Electric Medical Systems, Waukesha, WI), and the other fitted with a 12-inch local three-axis gradient coil (IGC Medical Advances, Milwaukee, WI). Just before the dynamic imaging study began, a 0.05–0.10 mmol/kg dose of gadodiamide (Omniscan, Nycomed Amersham, Princeton, NJ) was administered to diminish T1 effects that might have resulted from contrast agent extravasation. If the initial tissue T1 is decreased with contrast agent, subsequent changes in T1, which might occur during the first-pass study, are minimized (19, 38). Simultaneous GE and SE images were acquired by using single-shot blipped echo-planar imaging for 1 minute before and 2 minutes after a bolus injection of contrast agent (0.20–0.25 mmol/kg). (This dose varied because of economic and clinical care factors that changed from the research 1.5T vs. clinical 1.5T systems. For both low- and high-dose conditions, data quality was high, ensuring a sufficient contrast-to-noise ratio for reliable data analysis.) Five 7-mm sections were acquired at TE = 30 ms for GE and TE = 110 ms for SE with fat suppression, TR = 1 s, field of view = 24 cm, and matrix = 64 × 64. Finally, conventional contrast-enhanced T1-weighted SE images were acquired (TR/TE/NEX = 500/11/2, matrix = 256 × 256).
Data Analysis
Using image analysis programs developed at our institution, we simultaneously collected GE and SE data, which were reconstructed and divided into individual image datasets for GE and SE signal intensity time course data for each image section. Both GE and SE rCBV maps (corrected for contrast agent extravasation) and ratio (ΔR2*/ΔR2) maps were created from these data (19). Only the corrected rCBV and ratio maps are presented herein.
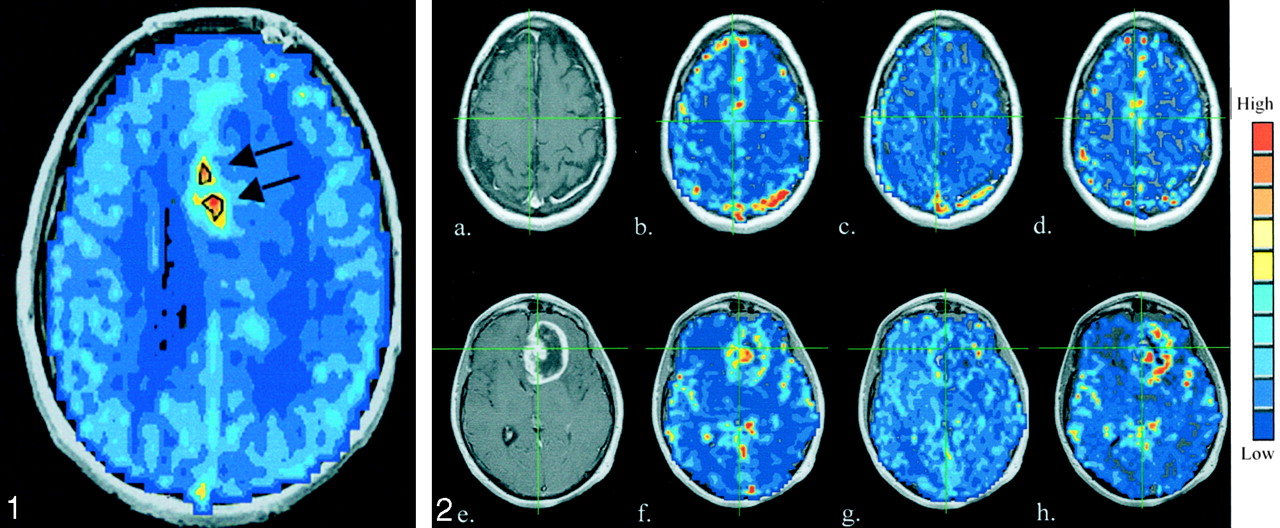
From these maps, rCBV, and ratio data were extracted from regions of interest (ROIs) placed in the whole tumor, in contralateral (reference) brain, and in tumor hot spots, as determined from the SE rCBV maps. Areas of necrosis, as visualized on contrast-enhanced T1-weighted images, were not included in the tumor ROIs. The reference brain ROIs were placed in the same location on the side opposite the tumor, either in the left-right or anterior-inferior directions depending on the location of the tumor. The goal was for the reference brain ROIs to contain approximately the same amount of gray matter and white matter as would be in the tumor area. The hot-spot ROIs, which were visually chosen, represented the highest 10–20% of SE rCBV values (Fig 1). This subjective approach was chosen to emulate the standard method of assessing angiogenesis (i.e., counting only microvessels from areas of highest microvessel density) (4). The tumor rCBV and ratio results are presented as normalized to those in contralateral brain.

Sample SE rCBV map shows hot-spot ROIs (black outlines and arrows), which represent the highest approximate 10–20% of microvascular rCBVs. These were used to mask the image maps and perform hot-spot analysis.
A statistical correlation between the MR imaging–derived parameters and histopathologic tumor grade was determined with the Spearman rank correlation test, by using P = .05 as the significance threshold. In addition, a nonparametric K-nearest- neighbor decision rule (39), with k = 5, was applied to determine whether the GE and SE data could be used to distinguish low-grade (I–II) from high-grade (III–IV) tumors on a per-patient basis.
Results
Figure 2 shows examples of T1-weighted, contrast-enhanced images, along with GE rCBV, SE rCBV, and ratio image maps for two patients: one with an anaplastic oligodendroglioma and the other with glioblastoma multiforme. These results demonstrated the general finding of this study (i.e., more aggressive tumors had higher blood volumes and larger vessel diameters, as indicated by the GE rCBV and ratio maps). Contrast enhancement in the anaplastic oligodendroglioma was negligible, but the increase in blood volume and ratio was obvious. As is well known, T1-weighted images demonstrate contrast enhancement only when the blood-brain barrier is disrupted. Although tumor vessels are often highly permeable, this is not always the case as demonstrated here (Fig 2). Furthermore, the blood-brain barrier can be altered by steroid treatment, a common part of the treatment regimen for patients with brain tumors. Consequently, contrast-enhanced T1-weighted images do not provide reliable information about tumor angiogenesis.

T1-weighted contrast-enhanced images (a and e) GE rCBV maps (b and f), SE rCBV maps (c and g), and ratio maps (d and h) obtained in a 53-year-old man with an anaplastic oligodendroglioma (a–d) and a 55-year-old man with a glioblastoma multiforme (e–h).
Results from 72 of the 73 patients are presented here. Four of the 73 cases had a tissue diagnosis based on biopsy findings rather than total or partial surgical resection. (These are indicated by asterisks in the Table.) Patient 18 had vascular thrombosis, as visualized during surgery, which explained the apparent lack of contrast agent distribution in the tumor area during imaging. Therefore, the data from that study were not included in subsequent analyses. In five of 72 cases, only GE data were obtained because of an error in setting the SE parameters.
Data from whole tumor, normalized to data in contralateral brain, are given in Figure 3. While significant correlations with grade were found for GE rCBV (P < .0001, rs = 0.52, n = 72) and ratio data (P = .0001, rs = 0.46, n = 67), the correlation between SE rCBV and tumor grade was not significant (P = .08, rs = 0.22, n = 67), as determined with the Spearman rank correlation test. Interestingly, when we considered only microvascular hot spots (Fig 4), a significant correlation with grade emerged for SE rCBV data (P = .0007, rs = 0.40, n = 67). Although the correlation remained significant for GE rCBV data (P < .0001, rs = 0.48, n = 67), mean vessel diameter (mVD) was only weakly correlated with tumor grade (P = .03, rs = 0.26, n = 67) when we considered tumor microvascular hot spots. (Hot-spot analysis was done for 67 of 72 patients in whom GE data were collected, because SE data were not available for five, and SE rCBV maps were needed to determine hot-spot microvascular ROIs.)

Whole-tumor ROI analysis for gliomas.
A, GE rCBV, which is sensitive to total blood volume, is significantly correlated with tumor grade (n = 72).
B, Conversely, SE rCBV, which is sensitive to microvascular blood volume, is not significantly correlated with tumor grade (n = 67).
C, ΔR2*/ΔR2 ratio, an index of mVD, is significantly correlated with tumor grade (n = 67).

Microvascular hot-spot ROI analysis for gliomas.
A, GE rCBV results maintain a significant correlation (n = 67).
B, Contrary to whole-tumor results, SE rCBV shows a significant correlation with tumor grade (n = 67).
C, While a significant correlation with tumor grade is retained, the correlation is weaker than that of whole-tumor ROIs (n = 67).
When we applied the K nearest-neighbor decision rule (k = 5) on the combined GE and SE data, 11 (69%) of 16 low-grade tumors were correctly classified, and 49 (96%) of 51 high-grade tumors were correctly classified (Fig 5). Of five low-grade tumors that were misclassified with this algorithm, two had a tissue diagnosis based on biopsy samples. (These data points are indicated by the arrows in Fig 5.) Findings in patient 38 (long arrow in Fig 5) revealed the information that rCBV mapping may add to that obtained with standard imaging and tissue diagnosis methods. For this patient, the tumor diagnosis based on CT-guided biopsy was low-grade astrocytoma. However, GE rCBV and mVD values were greater than the means of the low-grade group. Consistent with the rCBV finding, the clinical course of the tumor was aggressive. In fact, the patient died just 1 year after the rCBV study, the results of which are shown in Figure 6. These results suggest that MR rCBV information may improve the accuracy of diagnosis and help in directing the site of biopsy to ensure accurate representation.

SE rCBV data as a function of GE rCBV data. The K nearest-neighbor analysis (K = 5) resulted in correct classification of five (69%) of 16 grade I–II tumors (circles) and 49 (95%) of 51 grade III–IV tumors (squares). Asterisk indicates misclassified data points; the arrows indicate two low-grade tumors where diagnosis was based on biopsy.

MRI-derived (a) post-contrast (b) GE rCBV, (c) SE rCBV and (d) ratio maps obtained in a 66-year-old female patient prior to CT-guided biopsy. The biopsy pathologic results suggest low-grade astrocytoma. This diagnosis is not consistent with either the rCBV results or the clinical course of this patient.
Discussion
We demonstrated that, for whole tumors exclusive of any central cystic or necrotic core, total and microvascular blood volume are increased relative to contralateral brain, and mVD is enlarged. These findings are consistent with neoplastic angiogenesis that may follow an initial period of vascular cooption (40). For whole tumors, total blood volume and mVD are predictive of tumor grade, whereas the microvascular blood volume is not. However, when we considered tumor microvascular hot spots, the microvascular blood volume was predictive of tumor grade. This finding is consistent with those of previous imaging studies in which SE rCBV techniques alone were used (12, 21), and those in which the standard histologic approach of using the highest microvessel count to predict tumor angiogenesis and grade was applied (4, 41). In contrast, the ratio was only weakly correlated with grade when we considered only SE rCBV hot spots. This result is consistent with the idea that the GE-SE ratio is a marker of mVD. Therefore, when we look at hot spots only, we are preselecting for vessels within a certain range of diameters (i.e., those to which SE is primarily sensitive). Thus, in this case, a strong correlation between the ratio (mVD) and tumor grade is not expected.
Although a strong correlation with grade was noted for several of the MR imaging parameters, there was also an obvious amount of overlap between the grade categories. Therefore, to begin to assess whether this combined information could distinguish tumor grade on a per-patient basis, K nearest-neighbor analysis was applied. A fairly good distinction between the low- and high-grade tumors emerged, indicating that combined GE-SE data has promise to provide relevant information on a per-patient basis. However, while 96% of high-grade tumors were correctly classified, only 69% of low-grade tumors were. It is likely that classification accuracy for low-grade tumors will improve, as this training dataset includes many more low-grade tumors. This is the advantage of an approach like this. No assumptions were made regarding underlying distributions; rather, real data were used to dictate future classifications. Yet, this approach relied on an accurate pathologic diagnosis. It is well known that the current tumor grading system has inherent difficulties.
Regarding the classification of astrocytic tumors according to the WHO system (37), an astrocytoma is a generic term applied to diffusely infiltrating tumors composed of well-differentiated neoplastic astrocytes. An anaplastic (malignant) astrocytoma has focal or diffuse anaplasia defined as increased cellularity, pleomorphism, nuclear atypia, and mitotic activity, for example. The presence of prominent vascular proliferation or necrosis, or both, is essential for the diagnosis of glioblastoma. Here, vascular proliferation is considered to be multilayered endothelial cell proliferation, not quantitative determination of the number of vessels (i.e., microvessel count [MVC]). Although MVC is strongly correlated with grade in brain tumors (4), it is not used in establishing diagnosis. However, as more and better molecular diagnostic approaches become available, the WHO grading scheme for tumor classification will continue to be updated (42).
Sampling is a significant problem in the study of surgically excised gliomas (43). Therefore, some lesions designated as anaplastic astrocytoma might, and probably do, contain necrosis (a key criterion used to distinguish glioblastoma multiforme from anaplastic astrocytoma) in tissue not excised or submitted for microscopic study. Furthermore, tissue diagnosis based on biopsy alone has an even greater likelihood of misdiagnosis because of incomplete tissue sampling. Therefore, the classification accuracy of our approach would likely improve if the surgically sampled tissue and rCBV image values were spatially matched by means of stereotactic correlation.
Although these tumors were graded by using the WHO system, they are actually a heterogeneous group of lesions within each grade. Consequently, it is not surprising that some lesions respond to some therapies, other lesions respond to other therapies, and still other lesions respond to no therapy, although all have the same grade. The advantage of noninvasively obtaining information about the entire tumor cannot be overstated. At the least, MR imaging measures of vascular parameters should aid in the selection of biopsy and excision sites, guiding the surgeon to the areas of most aggressive tumor.
Capturing the spatially heterogeneous nature of the growing tumor has the additional advantage of providing information about the angiogenic changes and mechanisms, which should aid in accurately evaluating and optimizing new therapies (44). The growing tumor front, typically at the tumor periphery, is characterized by an increase in the number of microvessels, whereas larger glomerular vessels, which often are associated with more advanced tumors (40), are found more centrally (but not in areas of necrosis). In addition to being invasive and having the same tissue sampling errors described earlier, microvessel-counting methods tend to cause underestimation of the number of microvessels because of the presence of these glomeruloid vascular structures (4). In the MVC, the glomeruloid vascular structures are counted as a single brown-staining cluster, despite the fact that several individual microvascular lumens could have existed within the cluster. Alternatively, SE or GE MR imaging methods used alone emphasize different vessel populations. Consequently, tumor diagnosis could benefit from a technique, such as the GE and SE techniques used in this study, to provide spatially specific information about both microvascular growth and the existence of larger glomerular vessels.
In addition, evaluating changes in vessel diameter over time may potentially aid in optimizing the choice and timing of therapy. The concept that a measure of tumor vascular morphological findings is an important indicator of the tumor angiogenic process and possibly a predictor of tumoral response to therapy is becoming increasingly evident. Changes in vascular architecture have been shown to occur, with tumor growth paralleling the balance of angiogenic growth factors (40). Distinct differences in vessel morphological findings have been observed among tumors formed by cells expressing three different isoforms of the vascular endothelial growth factor (45), an important angiogenic growth factor in brain tumors (46). Also, vascular morphological findings have been shown to vary with tumor type, tumor site, and type or timing of conventional or antiangiogenic treatment (7, 8, 47–50). Whether a therapy proves successful is largely the result of choosing to inhibit the right growth factor responsible for tumor angiogenesis (51).
In addition to providing a noninvasive way to evaluate angiogenesis and antiangiogenic therapies, the GE and SE parameters can potentially affect a broader range of clinical applications and problems. For example, low-grade tumors commonly convert to higher-grade tumors focally located within larger lower-grade tumor beds. This is difficult to identify with standard imaging unless new focal enhancement or increased edema or growth of the mass is present. Given that the GE and SE parameters are correlated with tumor grade, this may be a marker of conversion that may direct biopsy for confirmation. Also, the GE and SE parameters may serve as indicators of recurrence and also differentiate between radiation necrosis and recurrent neoplasms. These parameters, in conjunction with findings from MR spectroscopy and CT or positron emission tomography, offer a potentially powerful set of tools to detect and confirm biopsy results and treat recurrent disease. Moreover, the distinction between the microvasculature and macrovasculature and the location of neovascularity could be useful in preoperative planning to avoid undue hemorrhage. For example, larger vessels may be easier to cauterize during surgery than those in a hypervascular microvascular bed.
The accuracy of classification may also improve as our characterization and optimization of the MR imaging dynamic susceptibility methods improve (19, 52–57). For example, while it is assumed that the relationships between the T2 and T2* relaxation rates and tissue contrast agent concentration are independent of dose, tissue type, and condition in the healthy brain, this assumption has yet to be validated for tumor tissue (52, 58). Another source of error was the confounding T1 effect that results when contrast agent leaks out of the vessels; this occurs when the blood-brain barrier is disrupted and is often the case in tumors. Susceptibility methods, like the one used in this study, rely on compartmentalization of the contrast agent within the vessels. In this regard, we made great efforts to diminish the effects of contrast agent extravasation by using a preload dose of contrast agent and by performing postprocessing steps to correct for this leakage. As we previously demonstrated, this postprocessing step is critical; if it is not used, the correlation between rCBV and tumor grade is lost (19, 59, 60). Besides enhancing the T1 effect, contrast agent leakage may result in an apparently larger susceptibility compartment, resulting in an overestimation of blood volume and mVD. Determination of the importance of these issues in first-pass studies requires further study. However, the eventual approval of large-molecular-weight, intravascular susceptibility-based contrast agents for clinical use should eliminate these concerns (61).
Conclusion
The combined dynamic GE and SE MR imaging approach we describe herein has the potential to provide another diagnostic feature with which tumors can be more completely evaluated, with the promise of doing so on an individualized basis. Accordingly, the multiparametric measurements with differing sensitivities to vessel diameter should supplement histologic diagnosis and aid in monitoring and elucidating the actions of the various antiangiogenic inhibitors alone or combined with conventional therapies, thereby influencing patient care.
References
- Received September 2, 2003.
- Accepted after revision February 20, 2004.
- Copyright © American Society of Neuroradiology
In this issue


Jump to section
Related Articles
Cited By...
- Moving Toward a Consensus DSC-MRI Protocol: Validation of a Low-Flip Angle Single-Dose Option as a Reference Standard for Brain Tumors
- Optimization of Acquisition and Analysis Methods for Clinical Dynamic Susceptibility Contrast MRI Using a Population-Based Digital Reference Object
- Multisite Concordance of DSC-MRI Analysis for Brain Tumors: Results of a National Cancer Institute Quantitative Imaging Network Collaborative Project
- Impact of Software Modeling on the Accuracy of Perfusion MRI in Glioma
- ASFNR Recommendations for Clinical Performance of MR Dynamic Susceptibility Contrast Perfusion Imaging of the Brain
- Differentiation between Oligodendroglioma Genotypes Using Dynamic Susceptibility Contrast Perfusion-Weighted Imaging and Proton MR Spectroscopy
- The Effect of Pulse Sequence Parameters and Contrast Agent Dose on Percentage Signal Recovery in DSC-MRI: Implications for Clinical Applications
- Semi-automated and automated glioma grading using dynamic susceptibility-weighted contrast-enhanced perfusion MRI relative cerebral blood volume measurements
- The Role of Preload and Leakage Correction in Gadolinium-Based Cerebral Blood Volume Estimation Determined by Comparison with MION as a Criterion Standard
- Correlations between Perfusion MR Imaging Cerebral Blood Volume, Microvessel Quantification, and Clinical Outcome Using Stereotactic Analysis in Recurrent High-Grade Glioma
- Recent advances in imaging epilepsy
- Acquisition of MR perfusion images and contrast-enhanced MR angiography in acute ischaemic stroke patients: which procedure should be done first?
- Magnetic Resonance As a Cancer Imaging Biomarker