
Abstract
BACKGROUND AND PURPOSE: The upper airway lumen is narrower in patients with obstructive sleep apnea syndrome (OSAS) than normal subjects. In this study, we examined changes of the upper airway cross-sectional area in each phase of respiration in different degrees of severity of OSAS with dynamic CT and investigated whether these changes have any correlation with sleep apnea severity parameters, including polysomnography (PSG) and cephalometry.
MATERIALS AND METHODS: Between May and November 2004, 47 patients who had at least 2 of 3 major symptoms of snoring, daytime somnolence, and apnea with witness were included in this prospective study. As control group, 24 habitual snorers were studied. All patients underwent PSG and upper airway CT. The average number of episodes of apnea and hypopnea per hour of sleep (the apnea-hypopnea index, AHI) was calculated. An AHI of 5 –29 represented mild/moderate OSAS and an AHI ≥ 30 represented severe OSAS. Cross-sectional area of the airway at the level of oropharynx and hypopharynx were obtained in each phase of quiet tidal breathing and at the end of both the forced inspiration and expiration. Six standard cephalometric measurements were made on the lateral scout view. All parameters were compared between controls and mild/moderate and severe OSAS groups.
RESULTS: Twenty-seven patients had mild/moderate OSAS, and 20 patients had severe OSAS. Patients with severe OSAS had significantly narrower cross-sectional area at the level of uvula in expiration, more inferiorly positioned hyoid bone, and thicker soft palate compared with patients with mild/moderate OSAS (P < .05) and the control group (P < .05). In addition, severe OSAS patients had bigger neck circumference than those in the control group (P < .05).
CONCLUSION: Patients with severe OSAS had significant differences in the parameters. Measurement of the cross-sectional area of oropharynx in expiration can especially be useful for diagnosis of severe OSAS as a new key point.
Obstructive sleep apnea syndrome (OSAS) is a common form of sleep-disordered breathing characterized by repetitive episodes of partial or complete upper airway obstruction (1). Diagnosis of this process is important. Cognitive deficits, impaired psychosocial well-being, reduced driving competence, cardiovascular morbidity, and mortality were reported, because it usually causes the fragmentation of sleep, reduced blood oxygen levels, and excessive daytime somnolence (1–4). The etiology of OSAS includes abnormalities in both the physiology and anatomy of the airway and associated facial structures (5). It was suggested that patients with OSAS had a narrower pharyngeal airway than normal persons because of fat infiltration, the weight of the soft tissue of the neck, or reduced pharyngeal muscle tone (6).
Polysomnography (PSG) is a diagnostic test that measures or records physiologic variables during sleep (1, 2, 7–14). It is recommended as a routine examination in the diagnosis of OSAS (15). In addition to PSG, multiple imaging techniques have been used to evaluate the upper airway in patients with OSAS (15). Static techniques include cephalometric radiography, CT, and MR imaging. Dynamic techniques include fluoroscopy, somnofluoroscopy, cine CT, fast CT and MR imaging, and fluoroscopic MR (3, 4, 6, 7, 16, 17).
Many cephalometric studies have been performed to investigate the craniofacial architecture of patients with OSAS, in which measurements and abnormalities of the craniofacial structures are well documented (5, 8–11); however, because cephalometric evaluation is usually applied to patients in upright position and can show craniofacial structures only in 2 dimensions, its value in evaluation of OSAS is low because the upper airway area changes during breathing and decreases in the supine position. Therefore, additional evaluation techniques are needed. CT is performed in the supine position and provides information about airway cross-sectional area and site of collapse, when performed in different phases of respiration (2, 7–10, 16). Therefore, cephalometry and CT are complementary techniques in the evaluation of the skeletal system and soft tissue in OSAS.
Many studies have been performed for the evaluation of OSAS by using CT. These studies, however, were generally based on static images and compared healthy subjects with patients having OSAS. Few of them investigated dynamic cross-sectional area changes of the pharyngeal lumen with (6, 9, 18) or without (4, 6, 7, 10, 12, 13, 16, 17, 19, 20) severity of OSAS. Recently, Bhattacharyya et al (16) reported that 3D airway CT demonstrated dynamic airway obstruction in OSAS but did not correlate their findings with clinically important disease parameters.
The purpose of this study was to show changes in the upper airway cross-sectional area in each phase of respiration in different degrees of severity of OSAS with dynamic CT and correlate these findings with sleep apnea severity parameters, including PSG and cephalometry.
Materials and Methods
Between May and November 2004, 47 patients (29 women [61.7%] and 18 men [38.3%]), with a mean age of 49.0 ± 7.8 years (range, 20–64 years), who had at least 2 of 3 major symptoms of daytime somnolence, snoring, and apnea with witness (21–23), were included in this prospective study. Twenty-four habitual snorers (22 women [91.7%] and 2 men [8.3%]), with a mean age of 46.0 ± 14.3 years (range, 21–80 years), were studied as the control group. They were nonsomnolent patients according to Epworth Sleepiness Scale (24), and their regular sleep partners stated that the patients did not exhibit apneas or hypopneas (10, 25). Both patients and controls underwent the same procedures. Informed consent was obtained from all patients, and the investigation protocol was approved by our institutional review board.
On physical examination, there were no nasal, oral, pharyngeal, or mandibular abnormalities or diseases. Weight and height and neck circumference measurements were taken from all patients, and body mass index (BMI) was calculated by dividing each patient’s weight (in kilograms) by the square of his or her height (in meters). The patients with BMI ≥ 30 were accepted as obese patients (5). All patients attending PSG were invited to undergo upper airway CT.
Polysomnography
Overnight PSG was performed in all patients by a computerized system and included the following variables: electroencephalogram, electro-occulogram, submental and leg electromyograms, electrocardiogram, and airflow (with an oronasal thermistor). Chest and abdominal efforts were recorded by using inductive plethysmography, arterial oxyhemoglobin saturation by pulse oximetry with a finger probe. Snoring sound was recorded with a microphone attached to the neck. All variables were recorded by using an 18-channel polysomnograph (Sleep Screen, Viasys Healthcare, Hoechberg, Germany). Sleep stages were scored according to the standard criteria of Rechtschaffen and Kales (26). Apneas were defined as complete cessation of airflow ≥10 seconds and hypopneas as a reduction in oronasal airflow of >50% lasting for ≥10 seconds. The apnea-hypopnea index (AHI) was defined as the number of apneas and hypopneas per hour of sleep. Patients were grouped by their total AHI. These groups were mild/moderate OSAS—AHI 5–29.9 and severe OSAS—≥30 (9).
CT
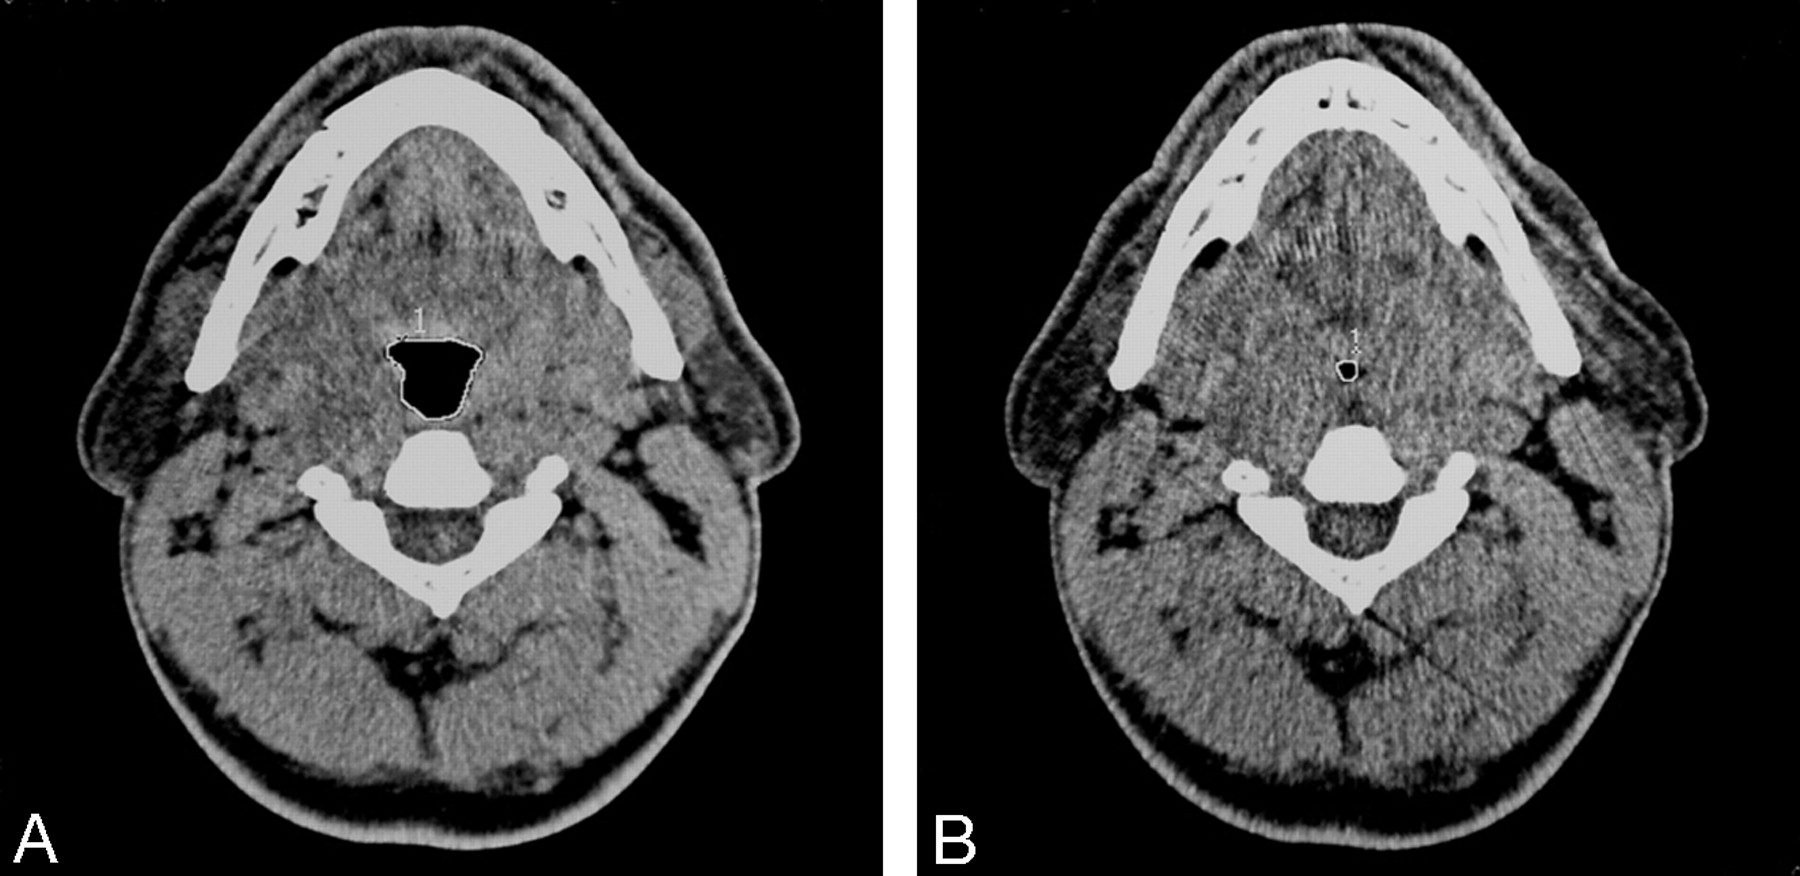
Head and neck CT (Toshiba Express TSX-011A; Toshiba, Tokyo, Japan) was performed in all patients while they were awake in the supine position with their heads in a neutral position (120 kV; 50 mA; section thickness, 5 mm; scanning time, 1 second; field of view, 400 mm; display matrix, 512 × 512 pixels). A lateral scout view was taken first to determine and standardize the level of the scans. Because the area of the pharyngeal airway changes during the respiration, we performed dynamic scans at the same anatomic level. Cross-sectional area of the airway at the level of oropharynx (level 1, tip of uvula) and hypopharynx (level 2, under the hyoid bone) were obtained in each phase of quiet tidal breathing, at the end of forced inspiration and at the end of forced expiration. Cross-sectional areas of the upper airway were manually measured by the same technician using electronic calipers (Fig 1A, -B).

A, Cross-sectional image of a patient at the level of uvula in tidal breathing. B, The significant narrowing at the same level in forced expiration is seen. The region of interest (white line) was used to assess total cross-sectional areas in each image.
Cephalometric measurements were made on the lateral scout view by the same radiologist (A.Y.), blinded to the clinical status of the patients, using an electronic cursor at the CT workstation. Six standard bony and soft-tissue measurements, most commonly reported to show changes in OSAS, were obtained (7, 9; Fig 2):
MP-H distance—from the mandibular plane to the hyoid bone. The normal value is 15.4 ± 3 mm (7).
PNS-U distance—from the posterior nasal spine to the tip of the uvula, which provides a measure of the length of the soft palate. The normal value is 34 ± 6 mm (7).
SP-max—maximum thickness of the soft palate perpendicular to PNS-U.
SNA, SNB, and ANB angles—S is the midpoint of the sella, N is the nasion, and A is the deepest point on the premaxillary outer counter; B is the deepest point on the outer mandibular contour. The normal value of ANB angle is 2° (7); SNA angle is 82°; and SNB angle is 80° (11).

Lateral scout view showing skeletal and soft tissue profile landmarks and the levels at which CT sections were obtained. S, sella; N, nasion; A, subspinale; B, supramental; H, hyoid; MP, mandibular plane; U, tip of the uvula; PNS, posterior nasal spine; SP-max, maximum thickness of the soft palate; level 1, level of tip of the uvula; level 2, level of hypopharynx.
Statistical Analysis
Statistical analysis was performed by using a SPSS version 10.0 statistical program (SPSS, Inc., Chicago). One-way ANOVA was used for comparison between the control group, the mild/moderate OSAS group, and the severe OSAS group. The paired samples t test was used to compare variables in the 2 groups. The χ2 test was used to analyze nominal data between groups. The Pearson coefficient (r) was calculated to determine the correlation between 2 variables. All parametric results were expressed as mean ± SD for each group. Local statistical significance was assumed as P < .05 for all parameters.
Results
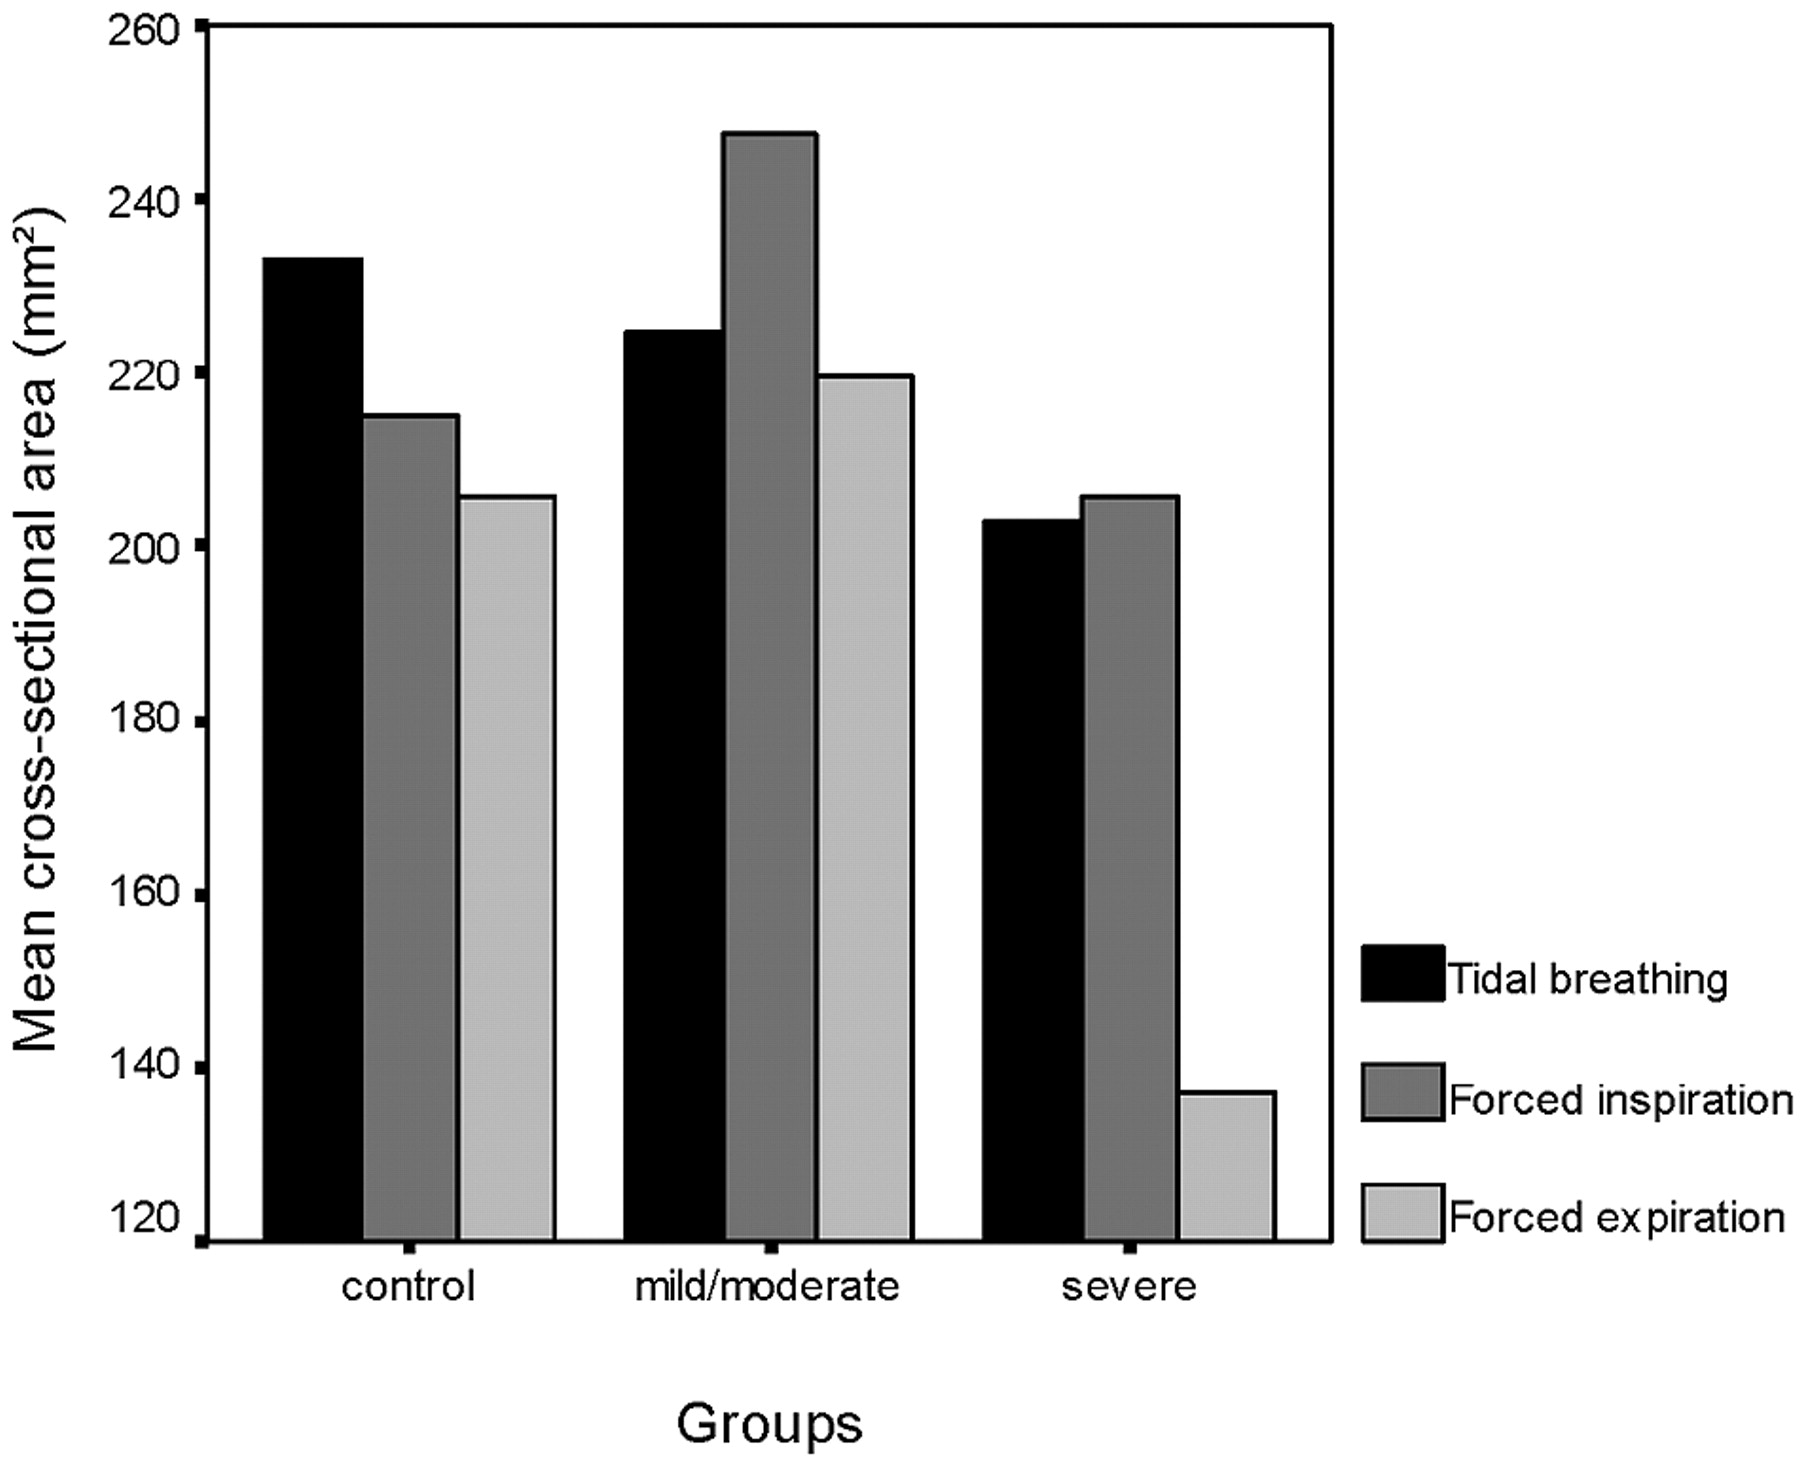
Female-to-male ratios were 22/5 in the mild/moderate OSAS group and 7/13 in the severe OSAS group. In the control group, this ratio was 22/2. There was statistically significant difference among the groups (P = .000). All parameters of patients according to the stages of OSAS are summarized in Table 1. Twenty-seven patients (38%) were in the mild/moderate OSAS group, with an AHI value of 5–29.9; 20 patients (28%) were in the severe OSAS group, with an AHI ≥ 30. Patients with severe OSAS had significantly narrower cross-sectional area at the level of uvula in expiration (Fig 3), longer MP-H and SP-max measurements compared with the patients with mild/moderate OSAS (P = .007; P = .054; P = .010; respectively) and control groups (P = .036; P = .043; P = .043, respectively). Although MP-H distance did not show statistical difference, it was found to be increased in the severe OSAS group (P = .054). In addition, patients with severe OSAS had greater neck circumference than did the control group (P = .039). Although there was no statistical difference in the cross-sectional areas at the level of hypopharynx between the groups, a gradual increase of the cross-sectional areas at this level was seen from the control group to the severe OSAS group, and it was the greatest in patients with severe OSAS (Fig 4).

Mean cross-sectional areas at the level of uvula in tidal breathing, at the end of both forced inspiration and expiration in each group.

Mean cross-sectional areas at the level of hypopharynx in tidal breathing, at the end of both forced inspiration and expiration in each group.
Parameters of patients according to stages of OSAS and control group
In the correlative study of AHI, neck circumference, cephalometric parameters, and upper airway size, we observed positive and negative correlations, which are shown in Table 2. The most striking points in the correlative study were that we found negative correlation between the cross-sectional area at the level of uvula in expiration and SP-max (P = .039) and AHI (P = .006). There were positive correlations between the cross-sectional areas at the level of uvula and hypopharynx in inspiration (P = .018), and positive correlation was also found between AHI and cross-sectional area at the level of hypopharynx in quiet tidal breathing (P = .007).
Significant correlations among AHI, neck circumference, cephalometric parameters, and upper airway size in patients with OSAS
There was no significant difference among groups according to BMI (P = .357). There was a significant difference between male and female patients with OSAS. Although AHI (P = .000) and the measurements of MP-H (P = .000), PNS-U (P = .001), SP-max (P = .002), and neck circumference (P = .004) were higher in men than in women, women had greater BMIs (P = .003) and ANB angles (P = .036) than men.
Discussion
Many investigators reported that the oropharyngeal level was the narrowest region of the upper airway and this level was the most affected part of the pharynx in patients with OSAS (3, 4, 6, 9, 13, 18, 19, 27). Upper airway collapse almost always occurred at this level during apnea (3, 4, 6, 9, 10, 12, 13, 18, 19, 27, 28). Some previous studies showed this airway collapse during inspiration in OSAS (6, 12, 17). It was also shown that the maximum upper airway cross-sectional area was significantly greater during expiration than during inspiration in normal subjects (27). On the other hand, recent studies demonstrated that minimum upper airway area occurred at end of expiration and enlarged during inspiration in patients with OSAS (14, 16, 27). The most important finding in our study was that the patients with severe OSAS had the narrowest cross-sectional area at the level of uvula in expiration. Akan et al (29) suggested narrowing of the oropharyngeal area at the end of expiration, which supports our findings. In our opinion, this significant narrowing at the level of uvula in expiration can be considered as a new key point of obstruction and can be a helpful diagnostic measure in severe OSAS. Recently, Avrahami et al (18) reported similar results and also suggested that a size of about 50 mm2 for the narrowest cross-sectional area of the oropharynx during quiet tidal breathing should be consistent with severe OSAS. According to this cut-off value, of our 20 patients with severe OSAS, a cross-sectional area <50 mm2 at the level of uvula was found in 4 patients on expiration and in a single patient on inspiration. None of them had the area at this level <50 mm2 during quiet tidal breathing. On the basis of these findings, we suggest that measurements should also be done in expiration.
The crucial question in the clinical assessment of the airway in OSAS is whether the collapse extends to the hypopharynx (7). We found a positive correlation between AHI and the cross-sectional area of the hypopharynx in quiet tidal breathing. In addition, there was positive correlation between cross-sectional areas at the level of the uvula and hypopharynx in inspiration. It is interesting that, though it was not significant, a gradual increase of the mean cross-sectional areas at the level of hypopharynx was seen from control group to patients with severe OSAS, who had the largest area (Fig 4). Similar to our results, Polo et al (28) suggested that the hypopharynx diameter in patients with OSAS was larger than in healthy subjects, and this might have a great importance in the development of apneas. Polo et al (28) also proposed that total obstruction of the pharynx appeared more frequently when a narrowed soft palate segment was associated with a large hypopharynx, as Lam et al (9) mentioned. Recently, Caballero et al (20) demonstrated the hypopharynx diameter in expiration was larger in the OSAS group than in the control group. Our findings support these investigators, because the patients with severe OSAS had the narrowest cross-sectional area at the level of uvula in expiration, whereas the cross-sectional hypopharynx area was the largest, though statistically insignificant.
AHI was correlated with cephalometric measurements such as MP-H, PNS-U, SP-max distances, and neck circumference in our study, as expected.
The position of the hyoid bone, which has an impact on the tongue shape and posture, affects the patency of the hypopharyngeal airway. Inferiorly positioned hyoid bone in OSAS is well documented (1, 5, 7, 9). In our study, the position of the hyoid bone showed statistical difference, and it was more inferiorly located in patients with severe OSAS than in those with mild/moderate OSAS or in the control group. In OSAS, MP-H distance value correlates with a high AHI independent from the BMI (7). We also found that the MP-H distance increased with increasing neck circumference, as reported elsewhere (5). In addition, uvula length and cross-sectional area at the level of the hypopharynx in quiet tidal breathing increased with increasing MP-H distance in our patients.
Both longer and thicker soft palate is commonly seen in patients with OSAS (5, 9, 11). In our study, severe OSAS patients had statistically significant thicker soft palate than did the mild/moderate OSAS and control groups. Our results showed that, though cross-sectional area at the level of uvula decreased in expiration, both the severity of OSAS and soft palate thickness increased.
Obesity is a well-known risk factor for sleep-disordered breathing, and weight loss is associated with improvements in the degree of the disorder (30, 31); however, some patients with OSAS are of normal weight and physique (5, 8). In MR studies including obese subjects, it was shown that more fat was present surrounding the collapsible segment of the pharynx in patients with OSAS than without OSAS and with weight loss, upper airway volume significantly increased while the volume of the lateral pharyngeal wall and parapharyngael fat pads were decreased (32, 33). Contrary to these findings, Akan et al (29) and Schwab et al (34) did not ascribe any importance to the parapharyngeal fat pads in narrowing of the airways. In most the studies, however, OSAS patients had significantly higher BMI and larger neck size than did normal subjects (5, 8, 9). In our study, there were no significant differences among each group according to BMI, but patients with severe OSAS had significantly larger neck circumference than did other groups. We also found positive correlation between neck circumference and AHI, as reported elsewhere (5). Neck circumference, an index of local adiposity in the context of OSAS, has been shown to correlate with the size of the tongue and the soft palate and the position of the maxilla, mandible, and hyoid bone (5, 9, 11). Similar to these reports, we found positive correlation between neck circumference and both soft palate length and MP-H distance.
OSAS is more common in men than women, despite the fact that women with OSAS tend to be more obese and have smaller upper airways than men (2, 16, 35). We also noted this sex difference in our study, and men had significantly higher AHI than women, though BMI value was greater in women. In addition to these findings, the female-to-male ratio declined as the severity of the OSAS increased. In other words, severe OSAS was seen more commonly in men than in women. Men had significantly more predisposing factors than did women, including more inferiorly positioned hyoid bones, longer and thicker uvulas, and greater neck circumferences, as reported in OSAS elsewhere (5, 7, 9).
A more receded mandible and/or maxilla relative to the nasion, reflected by smaller SNB and SNA respectively, has been frequently cited as a contributing factor to severity of OSAS (9, 11). We documented an interesting finding that ANB angle was larger in women than in men. ANB angle measures discrepancies between the mandible and maxilla, so patients with a significant increase in the ANB angle (normal ANB angle, 2°) in general have a normal maxilla but a mandibular deficiency (7, 11).
The limitation of our study was that we could perform the CT examination on patients in awaking state; however, upper airway resistance increases during sleeping in normal subjects and patients with OSAS (1, 6, 9, 13, 36). It was shown with CT that the cross-sectional area of the airway in patients with OSAS was significantly decreased during sleeping or under hypnotic relaxation relative to similar measurements taken in the awake state (12, 19).
Conclusion
In severe OSAS, patients had significant differences in the parameters. These parameters were cross-sectional area at the level of uvula in expiration, MP-H, and SP-max distances and neck circumference. Of these parameters, the measurement of cross-sectional area of oropharynx in expiration can be a helpful diagnostic measure to recognize severe OSAS as a new key point. Further dynamic studies with larger series are necessary to determine the relationship between severity of OSAS and oropharyngeal area in expiration.
References
- Received March 31, 2005.
- Accepted after revision April 13, 2005.
- Copyright © American Society of Neuroradiology


