
Abstract
BACKGROUND AND PURPOSE: We investigated 2 methods of measuring MR imaging perfusion-diffusion mismatch to determine whether reliability is improved by direct measurement on a single, blended map.
MATERIALS AND METHODS: Image software was used for measurement of lesion volumes from diffusion-weighted images (DWI) and mean transit time (MTT) calculated from perfusion-weighted (PWI) images on 64 patients with acute stroke. For the first method, the DWI and MTT lesions were measured separately. For the second method, the mismatch volume was measured directly on the blended images created from the registered DWI and MTT images.
RESULTS: Test-retest agreement was 100% and 97% for the separate and blended methods using mismatch cutoffs of 20% or more versus less than 20%. There were no significant differences in the mismatch statistics between the methods.
CONCLUSIONS: Mismatch volumes by a single reader can provide highly reliable and consistent results even when separately measuring DWI and MTT lesions. Propagation of measurement error was not demonstrated, and the methods were statistically comparable.
The MR perfusion-weighted imaging (PWI)-diffusion-weighted imaging (DWI) mismatch concept has become increasingly important for the inclusion of patients with stroke in clinical trials1,2 and selection for thrombolysis therapy.3 The Desmoteplase in Acute Ischemic Stroke and Dose Escalation of Desmoteplase for Acute Ischemic Stroke studies demonstrated that patients with a PWI-DWI mismatch who were treated with desmoteplase experienced a higher rate of reperfusion and better clinical outcome.1,2 An existing mismatch indicates the presence of hypoperfused but possibly still salvageable tissue, that is, “tissue at risk.”4 However, the standard measurement of mismatch used across these MR imaging studies, the difference in volume between perfusion and diffusion lesions, may contain compounded error introduced when measuring these MR imaging sequences separately. The purpose of this study was to investigate the reliability of 2 methods of measuring PWI-DWI mismatch volume to determine whether the reliability of estimating mismatch volume is improved by direct measurement on a single, blended PWI-DWI map.
Methods and Materials
Patients
This study is part of a prospective, natural history study of MR imaging in a consecutive series of tPA-treated patients at the National Institutes of Neurologic Disorders and Stroke (NINDS) and Suburban Hospital (Bethesda, Md).5,6 The institutional review boards at NINDS and Suburban Hospital approved the study. From February 2000 through January 2005, 147 patients were treated with standard intravenous tPA, of those, 81 patients had an MR imaging before tPA treatment and were the subject of the mismatch analysis. Patients were eligible for this analysis if they received an MR imaging scan (“acute” scan) followed by standard intravenous tPA within 3 hours from stroke onset. Only image time points and sequences with identifiable lesions were included to yield the current study sample of 64 patients. Six of the 81 patients were excluded because of unavailable acute MR imaging sequences. Eleven of the 81 patients were excluded for not having detectable lesions on DWI and PWI.
Imaging Sequences
MR imaging sequences were performed on a 1.5T clinical scanner (TwinSpeed; General Electric, Waukesha, Wis).
DWI
In this study, the DWI spin-echo-planar sequence included 20 contiguous axial oblique sections, with b = 0 and b = 1000 s/mm2, isotropically weighted in 3 gradient directions (R, S, and P), with 1 signal intensity average, using TR/TE at 6000 ms/72 ms, acquisition matrix of 128 × 128, 7-mm section thickness, 0-mm section gap, and 24-cm FOV.
PWI
In this study, the PWI gradient-echo-planar sequence included 20 contiguous axial oblique sections, with single-dose gadolinium injection of 0.1 mmol/kg via power injector, using 25 phase measurements (2 seconds per phase measurement), TR/TE at 2000 ms/45 ms, acquisition matrix of 64 × 64, 7-mm section thickness, 0-mm section gap, and 24 cm FOV.
Mean Transit Time
Mean transit time (MTT) maps were calculated from PWI using time concentration curves (TCC) in this study as the first moment of the TCC divided by the 0 moment without deconvolution or arterial input functions.7
Image Analysis
Method 1 (Separate Lesion Volume Measurement).
Image analysis software (Cheshire; Perceptive Informatics, Boulder, Colo) was used for measurement of ischemic lesion volumes from the DWI and MTT sequences. Lesion volumes were measured at acute time points. A reader blinded to clinical characteristics and time point used a semiautomated technique for initial identification of all of the lesions and a manual-editing tool for final corrections to the lesion borders. All of the lesion areas on a section-by-section basis were segmented with a semiautomated segmentation tool and then manual editing was performed. The semiautomated segmentation tool is based on a watershed method dependent on a series of seed points and the subsequent sampled surrounding area placed by the reader. The volumes were automatically produced by the multiplication of the section thickness times the total lesion area.
DWI lesion volumes were assessed on the affected sections with hyperintense areas visible from the b = 1000 mm/s2 images. The reader paid particular attention to the typical locations of bilateral artifact and produced apparent diffusion coefficient maps as necessary to identify positive DWI lesions. For MTT assessments, the reader paid particular attention to exclude hyperintensities attributable to the typical susceptibility artifacts adjacent to the paranasal sinuses. The reader assessed the MTT as not evaluable if the signal intensity drop from the contrast did not produce at least a 10% drop or if there was significant patient motion causing inconsistency in the confirmation of the perfusion deficit.
Method 2 (Blended Difference Volume Measurement).
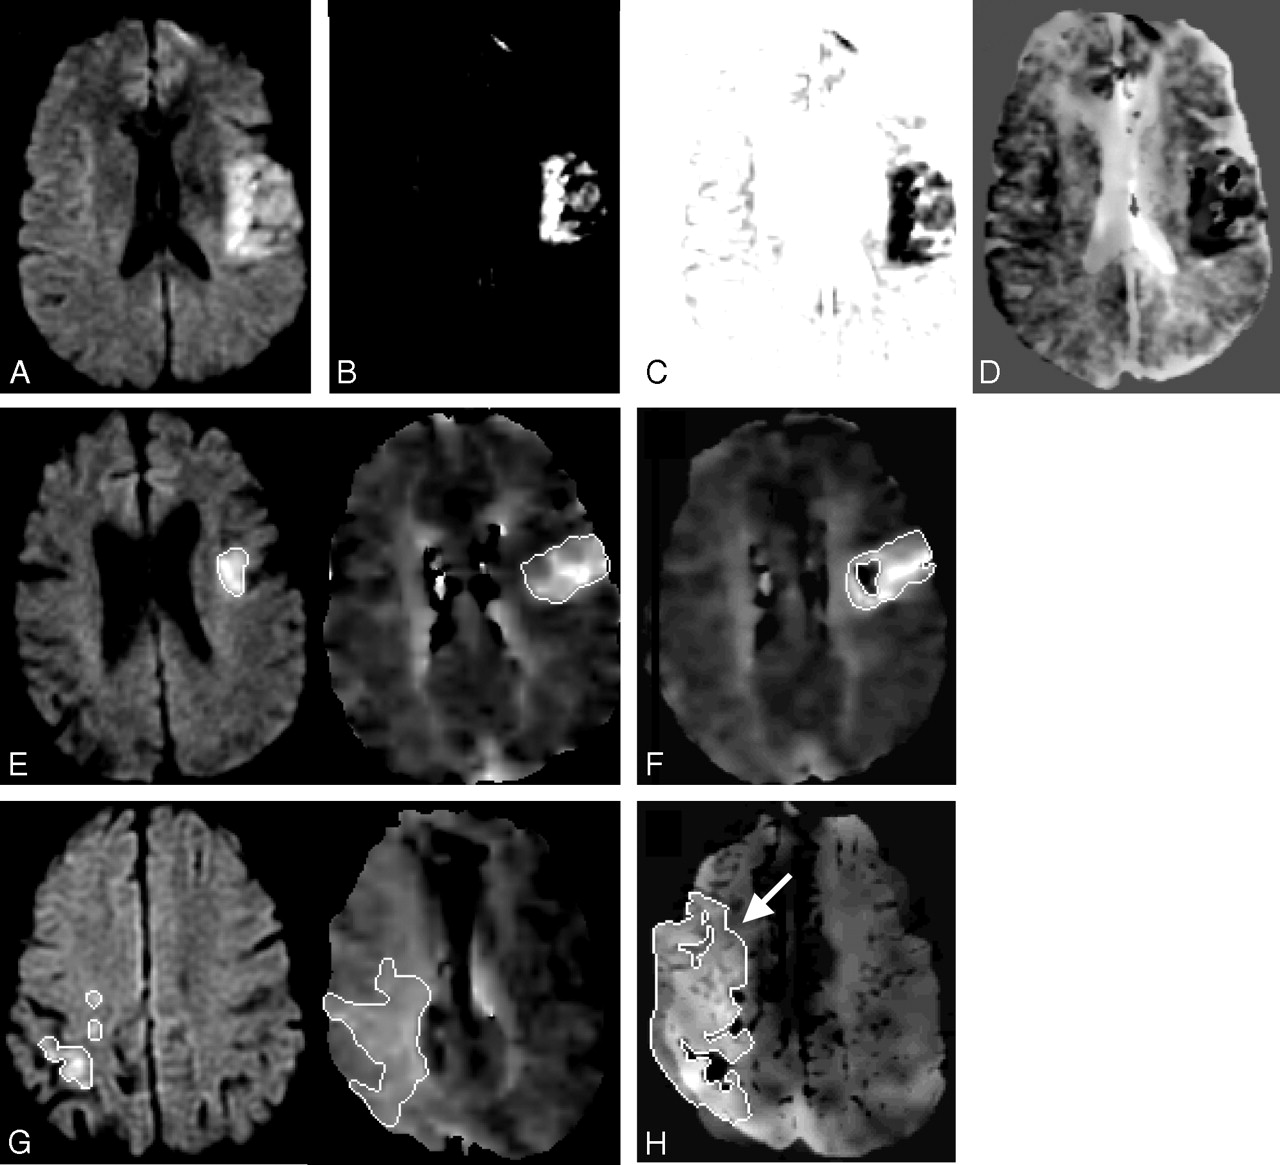
Image analysis software (Mipav; National Institutes of Health) was used for brain midline alignment and registration of each MTT sequence with the corresponding DWI sequence. The DWI sequence was contrasted to maximize the lesion conspicuity; its intensity values were then inverted and blended with the registered MTT sequence as shown in Fig 1. Normal windowing of the DWI sequence was not used because of poor lesion conspicuity in the resulting difference images. The reader measured the mismatch volume as the visual difference between the DWI and MTT lesions directly on the blended images by using the same software and semiautomated technique described in Method 1 (Cheshire). Both mismatch measurement methods are displayed in Fig 1 by using sample sections of acute DWI and MTT sequences for 2 separate cases.

Mismatch Method 2. DWI sequence (A) is contrasted to maximize the lesion conspicuity (B) and its intensity values are inverted (C) and then blended with the registered MTT sequence (D). Mismatch Method 1 (E): separate lesion measurements on DWI and MTT sequences compared with Mismatch Method 2 (F): single measurement of the blended difference. Mismatch Method 1 (G): separate lesion measurements on DWI and MTT sequences compared with Mismatch Method 2 (H): single measurement of the blended difference with an arrow indicating the larger MTT lesion seen on the blended map.
Statistical Analysis
Deviations between mismatch measurements were compared for the 2 reads of each method by using mismatch volume and percentage. The deviation was computed as the absolute value of the difference between the 2 reads; percentage of deviation was the absolute deviation divided by the average of the 2 reads. The absolute difference and the percentage of deviation of the 2 reads were calculated and then averaged across all of the patients. The definition of mismatch used was mismatch volume/MTT volume.
Spearman correlation coefficients were computed using SPSS for Windows 14.0 (SPSS, Chicago, Ill) to compare the test-retest agreement of each method. Bland-Altman plots were generated for the mismatch data to display the spread of data and the limits of agreement, specifically to illustrate how many of the averaged data points lie within 2 SDs from the mean difference.8 The Bland-Altman plots were used to address the key question of whether one set of measurements is sufficiently representative or if 2 sets of measurements are required for providing the most accurate results. The 95% confidence limits are proposed as the repeatability coefficients of one type of measurement for another, that is, one set of measurements is sufficient rather than requiring 2 sets in this particular study.8
Results
Mismatch was measurable in 64 patients at the acute time point. Only measurements where a lesion was seen (ie, non-0 volume) on the DWI or MTT sequences for at least one read are reported in the tables and all of the figures.
Method 1 (Separate Lesion Volume Measurement)
Calculation: Mismatch (MTT − DWI).
For Method 1, the calculated mismatch volume (MTT − DWI) statistics are contained in Table 1. All of the Spearman correlations were significant at the 0.01 level (2-tailed) as presented in Table 1.
Mismatch volume reliability and comparison
Fig 2A displays the Bland-Altman plot for the Mismatch Method 1 for the acute mismatch volumes. The upper and lower limits, shown as thick black solid lines, were calculated for each plot to represent ±2 SD from the mean. A total of 97% of data points were within these boundary limits for the mismatch data.

A, Mismatch Method 1, acute time point plot of mean volume vs volume difference between 2 sets of measurements (raw numbers) where the thick black lines represent the upper and lower boundaries using ±2 SDs from the mean. B, Mismatch Method 2, acute time point plot of mean volume vs volume difference between 2 sets of measurements (raw numbers) where the thick black lines represent the upper and lower boundaries using ±2 SDs from the mean. C, Mismatch Method 1, acute time point plot of mean percentage vs percentage difference between 2 sets of measurements (mismatch/MTT percentage) where the thick black lines represent the upper and lower boundaries using ±2 SDs from the mean. D, Mismatch Method 2, acute time point plot of mean percentage vs percentage difference between 2 sets of measurements (mismatch/MTT percentage) where the thick black lines represent the upper and lower boundaries using ±2 SDs from the mean.
For Method 1, the calculated percentage of mismatch (mismatch/MTT) statistics is contained in Table 2. All of the Spearman correlations were significant at the 0.01 level (2-tailed) as presented in Table 2.
Mismatch percentage reliability and comparison
Fig 2C displays the Bland-Altman plot for the Mismatch Method 1 for the acute mismatch percentages. The upper and lower limits, shown as thick black solid lines, were calculated for each plot to represent ±2 SD from the mean. A total of 98% of data points were within these boundary limits for the mismatch percentage data.
Method 2 (Blended Difference Volume Measurement)
For Method 2, the blended mismatch volume statistics are contained in Table 1. All of the Spearman correlations were significant at the 0.01 level (2-tailed) as presented in Table 1.
Fig 2B displays the Bland-Altman plot for the Mismatch Method 2 for the acute mismatch volumes. A total of 94% of acute data points were within the boundary limits for the mismatch data.
For Method 2, the calculated percentage of mismatch (mismatch/MTT) statistics is contained in Table 2. All of the Spearman correlations were significant at the 0.01 level (2-tailed) as presented in Table 2.
Fig 2D displays the Bland-Altman plot for the Mismatch Method 2 for the acute mismatch percentages. The upper and lower limits, shown as thick black solid lines, were calculated for each plot to represent ±2 SD from the mean. A total of 94% of data points were within these boundary limits for the mismatch percentage data.
Discussion
The presence of mismatch is increasingly important in the identification of target patients for thrombolysis and enrollment into clinical trials. However, the reliability of mismatch volume and percentage of measurements has not been extensively investigated within an acute stroke onset window. Because physiologic change, measurement technique, and associated error may potentially change or obscure the amount and presence of mismatch, it is important to understand the available measurement techniques, as well as sources and magnitude of measurement error. One limitation of the current study is that all of the mismatch data were acquired <3 hours from stroke and from patients who subsequently received intravenous tPA. This is the main explanation for the large number of patients, 85%–89%, demonstrating at least a 20% mismatch, based on quantitative methods in this study, and probably confirmed before the time of thrombolysis. Therefore, indirectly this study confirms the qualitative interpretation for at least 20% mismatch performed as part of the clinical evaluation for thrombolysis consideration. This is consistent with other studies using the 20% criteria.1,2 However this study does not provide a quantitative method rapid enough to replace the current qualitative assessment used for clinical trial enrollment.
In the present study, technical variables that could affect lesion volume measurement, such as the MR imaging scanner type, pulse sequence parameters, image processing, and analysis software, were held constant for each method. Thus, we have characterized the reliability independent of other sources of measurement error.
The amount of mismatch seen with Methods 1 and 2 is comparable with other studies using similar stroke populations4 but slightly smaller compared with studies with larger stroke onset windows1,2 or because of different perfusion processing software.9 The quantitative results presented in this study are significantly more reliable compared with other qualitative and manually derived quantitative methods.10 There are some technical limitations with the blended maps presented in this study. In some instances, as shown in Fig 1F, the DWI components from the blended method are smaller, and in Fig 1H, the MTT components are larger; however, the mismatch volumes produced were not significantly different from those of the standard method.
Based on the results from the Bland-Altman analyses for both mismatch volume and percentage, a single quantitative read of mismatch is sufficient for mismatch detection. The repeatability seen for mismatch was less than 6 mL and less than 7% for Method 1 at the acute time points. There were 2 outliers readily identified by the Bland-Altman plots in the mismatch reads. The repeatability seen for mismatch was less than 1 mL and less than 2% for Method 2 at the acute time points. There were 4 outliers readily identified by the Bland-Altman plots in the mismatch reads.
Mismatch volumes by a single reader can provide highly reliable and consistent results even when separately measuring DWI and MTT lesion volumes. There is a potential trend for increased sensitivity and decreased variability in the detection of mismatch with the blended difference measurement method. Although expected to be a source of significant variability in the separate volume measurement, propagation of measurement error was not demonstrated as a factor, and the 2 methods were statistically comparable. This study validates the current approach for centralized reading of mismatch in stroke trials, which uses the standard method, separately measuring the DWI and MTT volumes.
Acknowledgments
We thank the National Institutes of Health stroke team and patients at Suburban Hospital for their valuable assistance and cooperation.
Footnotes
This research was supported by the Division of Intramural Research of the National Institute of Neurological Disorders and Stroke, National Institutes of Health.
References
- Received November 28, 2006.
- Accepted after revision March 5, 2007.
- Copyright © American Society of Neuroradiology


