
Abstract
BACKGROUND AND PURPOSE: Imaging assessment of an immunotherapy response in glioblastoma is challenging due to overlap in the appearance of treatment-related changes with tumor progression. Our purpose was to determine whether MR imaging radiomics-based machine learning can predict progression-free survival and overall survival in patients with glioblastoma on programmed death-ligand 1 inhibition immunotherapy.
MATERIALS AND METHODS: Post hoc analysis was performed of a multicenter trial on the efficacy of durvalumab in glioblastoma (n = 113). Radiomics tumor features on pretreatment and first on-treatment time point MR imaging were extracted. The random survival forest algorithm was applied to clinical and radiomics features from pretreatment and first on-treatment MR imaging from a subset of trial sites (n = 60–74) to train a model to predict long overall survival and progression-free survival and was tested externally on data from the remaining sites (n = 29–43). Model performance was assessed using the concordance index and dynamic area under the curve from different time points.
RESULTS: The mean age was 55.2 (SD, 11.5) years, and 69% of patients were male. Pretreatment MR imaging features had a poor predictive value for overall survival and progression-free survival (concordance index = 0.472–0.524). First on-treatment MR imaging features had high predictive value for overall survival (concordance index = 0.692–0.750) and progression-free survival (concordance index = 0.680–0.715).
CONCLUSIONS: A radiomics-based machine learning model from first on-treatment MR imaging predicts survival in patients with glioblastoma on programmed death-ligand 1 inhibition immunotherapy.
ABBREVIATIONS:
- AUC
- area under the curve
- C-index
- concordance index
- ET
- enhancing tumor
- IQR
- interquartile range
- OS
- overall survival
- PFS
- progression-free survival
- PD-1
- programmed cell death protein 1
- PD-L1
- programmed death-ligand 1
- WT
- whole tumor
Glioblastoma is the most common primary malignant brain tumor among adults.1 The current standard of care is maximal surgical resection followed by radiation and temozolomide chemotherapy. However, eventual progression of the tumor is typical with limited further treatment options and a dismal median overall survival (OS) of 15 months and 5 -year survival of <10%.2 Despite advances in the understanding of molecular changes in glioblastoma, effective targeted therapies are lacking, and bevacizumab, a monoclonal antibody against the vascular endothelial growth factor, is the only approved addition to recurrent glioblastoma management.3
Preclinical studies of programmed cell death protein 1 (PD-1) pathway inhibition showed promising results in glioma.4,5 However, in clinical trials, PD-1 inhibition via nivolumab concurrently with chemoradiotherapy or radiation therapy did not improve progression-free survival (PFS) or OS in newly diagnosed glioblastoma6,7 or improve OS compared with bevacizumab in recurrent glioblastoma.8 Although the overall response rate to nivolumab was low (8%) in patients with recurrent glioblastoma, the response was more durable relative to bevazicumab.8 Durvalumab (MEDI4736) is a monoclonal antibody against human programmed death-ligand 1 (PD-L1) that has shown clinical efficacy with an acceptable safety profile9 and is being studied in multiple cancer subtypes, including glioblastoma.
Imaging assessments in glioma are challenging due to the overlap in the appearance of treatment-related changes with tumor progression, particularly in the setting of multimodality treatment.10,11 Considering the possible low response rate to immunotherapy12 and the poor median OS in glioblastoma, imaging-based metrics to predict response and improved survival early are desirable to make appropriate treatment decisions. Radiomics methods enable quantification of multisequence imaging data from spatially heterogeneous tissues, and machine learning techniques allow integration of these multiple quantitative metrics.
Here, we performed a post hoc analysis of a multicenter Phase II study (NCT02336165) of patients with glioblastoma undergoing durvalumab therapy with MR imaging radiomics and machine learning techniques. The aim of this study was to determine whether MR imaging radiomics-based machine learning can predict PFS and OS in patients with glioblastoma on PD-L1 inhibition immunotherapy.
MATERIALS AND METHODS
This was a post hoc analysis of data from a Phase II clinical trial to evaluate the clinical efficacy and safety of durvalumab (MEDI4736) in glioblastoma (NCT02336165) conducted at 8 sites (7 in the United States, 1 in Australia) and enrolling 162 patients between March 2015 and January 2017 into 5 noncomparative patient cohorts (Fig 1 and Online Supplemental Data). The Online Supplemental Data summarize the trial inclusion/exclusion criteria. The institutional review board (Dana-Farber Cancer Institute) approved this trial, and all patients provided written informed consent. Of the 162 patients enrolled, 3 did not receive MEDI4736 due to clinical decline (n = 1), seizure (n = 1), or withdrawal of consent (n = 1) before drug administration (Fig 1).

Flow chart of the study population.
Imaging
MR imaging was performed approximately every 2 months during treatment, once during on-study follow-up, and at least every 6 months during poststudy follow-up. Brain MR imaging was performed on 1.5T or 3T scanners before and after the administration of gadolinium-based contrast media. Brain MR imaging protocol included sagittal and/or axial T1-weighted images, axial T2, axial T2-FLAIR, postcontrast axial or coronal fast spin-echo or 3D T1-weighted gradient-echo images, and susceptibility weighted imaging (Online Supplemental Data).
Imaging data were not available for central review for the Australian site (n = 4) and for 1 US patient (n = 1); hence, these were excluded. For this study, imaging performed pretreatment and at the first on-treatment time point was analyzed. First on-treatment MR imaging refers to the first MR imaging obtained after starting treatment and was performed approximately 8 weeks after initiation of treatment. Only patients with complete T1 precontrast, T2, T2-FLAIR, and T1 postcontrast imaging were included in the study for each time point (Fig 1).
Progression was defined on the basis of the modified Response Assessment in Neuro-Oncology criteria13,14 if the patient met any one of the following criteria:
A 25% increase in the sum of the products of perpendicular diameters of enhancing lesions (over best response or baseline if no decrease) on stable or increasing doses of corticosteroids
Any new lesion
Clear clinical deterioration not attributable to other causes apart from the tumor
Failure to return for evaluation due to death or deteriorating condition.
Patients with suspected progression were permitted to continue therapy at least until confirmation of progression on follow-up imaging in 8 weeks.
Image Postprocessing
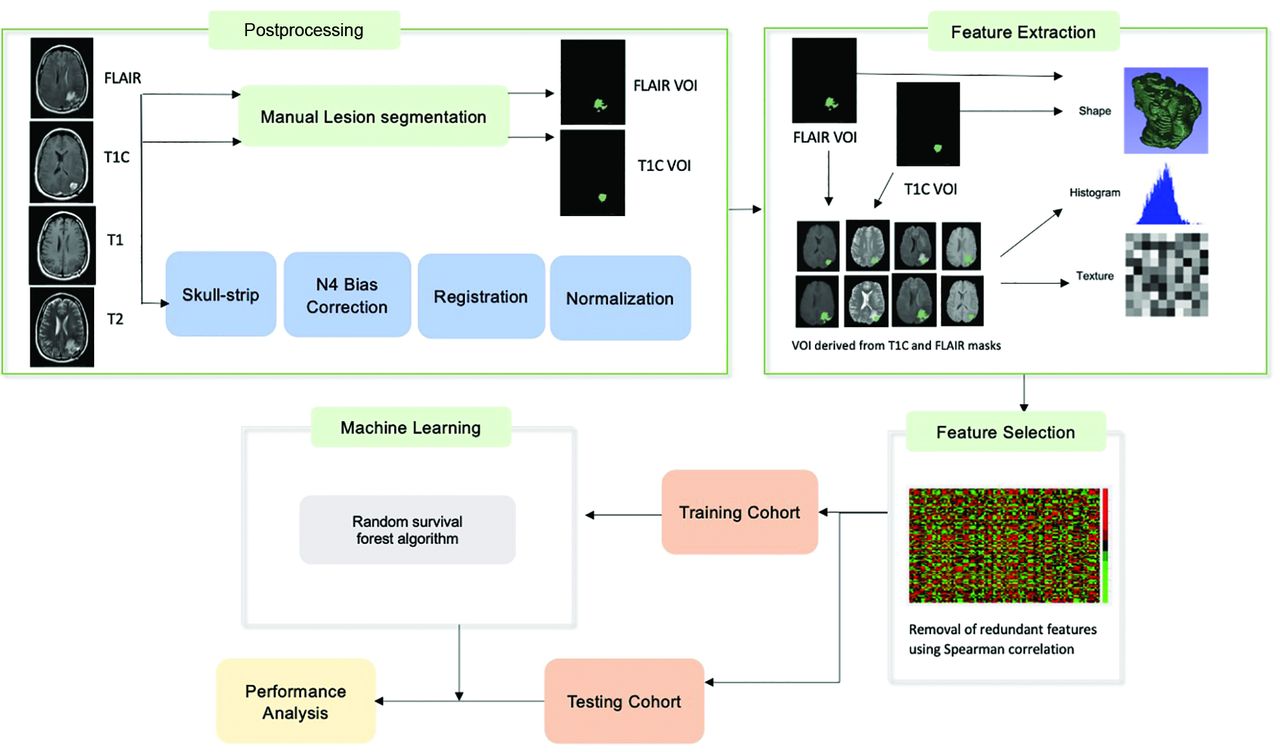
Image postprocessing methods are reported per the Image Biomarker Standardization Initiative guidelines (Online Supplemental Data).15 The T2-FLAIR images were used to segment the whole tumor (WT) VOI, which includes enhancing tumor, infiltrating tumor, and vasogenic edema while postcontrast T1 images were used to determine the enhancing tumor (ET) VOI on the pretreatment and first on-treatment time point MR imaging. For segmentation, we used a semiautomated level tracing tool on 3D Slicer, Version 4.4 (http://www.slicer.org). All included imaging sequences (T2, T2-FLAIR, T1, T1 postcontrast) were skull-stripped,16 and image intensities were corrected for low-frequency intensity nonuniformity via N4 bias field correction. Image intensities were then normalized using the median and interquartile range (IQR) of image intensities17 of the normal brain VOI (defined as the region outside the WT VOI, Fig 2) using Matlab (R2015a; MathWorks). All imaging sequences were resampled to 1 mm and spatially registered to the T1 postcontrast images using rigid followed by affine transformation with the Matlab Imaging Processing Toolbox.

Radiomics and machine learning workflow. T1C indicates T1 post contrast imaging.
Radiomics Feature Extraction and Feature Selection
The radiomics feature extraction was performed using Matlab and included features from the open-source radiomics package by Vallières et al18,19 (Online Supplemental Data). In this package, 3 feature categories were included to characterize the tumor shape (10 features), intensity histogram (18 features each for 4 sequences [T1, T2, T2-FLAIR, T1 postcontrast]), and texture (40 features each for the aforementioned 4 sequences).18,20 A total of 242 features were included for each VOI (WT and ET) for a total of 484 imaging features for each time point in addition to 5 clinical features of age, race, sex, study site, and treatment regimen. The treatment regimen was included as a feature to account for the heterogeneity in population (newly diagnosed versus recurrent glioblastoma and durvalumab monotherapy versus combination therapy).
Feature selection was performed using feature variability and redundancy. Feature variability, a measure of stability, was assessed as the percentage difference between the feature value before and after shifting the tumor VOI 3 voxels in all directions. The variability for each feature was obtained for each case and then averaged over all cases to obtain the average feature variability for each feature. Features with a variability of >150% were removed. Next, redundant features, defined as features with a Spearman correlation of >0.8, P < .05 with another feature, were removed.
Radiomics Model Training
The random survival forest algorithm21 was applied using the scikit-survival 0.17.1 Python module.22 Censored survival data (see Statistical Analysis section) including event (death or progression) and time to event were input into the algorithm along with the selected feature set. Tuning of hyperparameters was performed using a grid search, and the optimized parameters are included in the Online Supplemental Data.
Radiomics Model Performance
To assess the generalizability of radiomics models across multiple centers, we designed 3 separate experiments using data from different sites for model training and model testing, while keeping the ratio of the number of patients in training and testing groups to about 2–3:1 (Fig 1 and Online Supplemental Data). After each model was trained using the “training” group, the model performance was evaluated in an intentionally withheld external “testing” group.
Training with sites 2–6 (n = 70–72) and testing with site 1 (n = 31–32)
Training with sites 1 and 3–6 (n = 73–74) and testing with site 2 (n = 29)
Training with sites 1 and 2 (n = 60–61) and testing with sites 3–6 (n = 41–43).
These experiments were conducted separately for pretreatment and first on-treatment MR imaging–derived features (combined with clinical variables, Online Supplemental Data). Model performance was assessed using both the concordance index (C-index) and dynamic area under the curve (AUC) for different time points.23
Top-Performing Features
For each experiment, the top 20 features were reported along with their corresponding weights in the trained model (Online Supplemental Data). The top features were calculated using “out of bag” samples, which are sets of outcomes in the training set that are randomly excluded from model training. This step avoids overlap with the training data when analyzing the strength of a given feature.
Statistical Analysis
Overall survival was defined as the time from therapy initiation to death, and progression-free survival was defined as the time from therapy initiation to progression of disease. If the patient was alive at the last follow-up, the OS was censored at the time of last clinical follow-up; in patients with stable or improved disease at last follow-up, PFS was censored at the last imaging follow-up. These results are based on the data lock date of November 20, 2019, for OS and September 6, 2019, for PFS. The accuracy of the model was assessed using the C-index and dynamic AUC for different time points. Statistical analyses used Python, Version 3.7.6.
RESULTS
Patient Characteristics
A total of 113 patients with complete imaging of the 154 enrolled in this trial were included in this analysis, including 103 patients who had complete pretreatment imaging and 102 who had complete first on-treatment imaging (Fig 1). The demographics and treatment regimen of the included patients are presented in Table 1. Of the 113 patients included in the study, 103 had progression (median PFS = 106 days; IQR = 56–150.5 days) and the remaining 10 were censored at the last imaging follow-up available. Ninety of the 113 patients died during follow-up (median OS = 207.5 days; IQR = 150.5–393.5 days), and the remaining 23 were censored at the last clinical follow-up.
Patient characteristics
The median time from pretreatment imaging to the start of treatment was 7 days (IQR = 6–14 days) and from the start of treatment to first on-treatment imaging was 55.5 days (IQR = 54–56 days).
Radiomics Model Performance
After we removed high-variability features and redundant features from the original 489 features, the pretreatment models each included 162–267 features and the first on-treatment models included 168–200 features. The radiomics models trained using pretreatment imaging features showed poor performance in predicting OS and PFS (C-index = 0.472–0.521 for OS and C-index = 0.472–0.524 for PFS in the testing cohort). Conversely, the radiomics models trained using first on-treatment imaging features showed a high C-index for the prediction of OS in the out of bag training cohort (C-index = 0.690–0.721) and testing cohort (C-index = 0.692–0.750, Table 2). Dynamic AUC plots for the first on-treatment models predicting OS (Online Supplemental Data) showed a peak AUC between 300 and 600 days postenrollment.
Radiomics model performance for prediction of OS and PFS
The first on-treatment imaging features–based radiomics model also showed a high C-index for the prediction of PFS in the out of bag training (C-index = 0.641–0.660) cohort and in the testing cohort (C-index = 0.680–0.715, Table 2). Dynamic AUC plots for the first on-treatment models predicting PFS showed variable AUC peak times, ranging from approximately 125 to 400 days.
Top-Performing Features
Because the models trained using first on-treatment MR imaging features had the best performance, they were used for determination of top-performing features. In each experiment with first on-treatment MR imaging features, the 20 top-performing features were predominantly texture features with a few shape features included (Online Supplemental Data). The treatment regimen was feature 12 of 20 in one of the models (Online Supplemental Data), but it was not a top-performing feature in any of the other first on-treatment models. Demographics and study site were not included in the top features for any of the first on-treatment models.
DISCUSSION
There is a need for identification of specific imaging features for response assessment and reliable imaging-based prognostic markers in glioblastoma. Our multicenter study demonstrates that a radiomics model combining first on-treatment MR imaging features and clinical variables can accurately predict OS and PFS on durvalumab PD-L1 inhibition immunotherapy. The results were consistent across treatment sites with heterogeneous imaging protocols as confirmed by site-specific analysis with independent testing.
An increasing number of clinical trials are evaluating immunotherapy approaches for malignant glioma, but there are limited data assessing machine learning–based or other quantitative methods for imaging-based prognosis in patients with gliomas on immunotherapy. Radiomics prediction of survival on PD-L1 inhibition immunotherapy has previously been studied in other malignancies, including bladder cancer24 and non-small-cell lung cancer.25 In glioma, previous work has used radiomics features and machine learning to predict PD-L1 expression and subsequently found that the predicted high PD-L1 subgroup correlated with better prognosis.26 There is also an extensive body of literature that has assessed the role of machine learning in various other aspects of glioma imaging,27 including determination of glioma grade,28 genomic status,29 segmentation,30 and prediction of survival.31 Radiomics-based supervised machine learning algorithms have shown that shape and texture features extracted from conventional and advanced MR images can predict survival in gliomas of varying grades.32,33 In recurrent glioblastoma treated with bevacizumab, pretreatment texture and volumetric features were predictive of progression and survival.34,35 However, in recurrent high-grade gliomas treated with bevacizumab and radiation, posttherapy scan texture features were predictive of overall survival.36 Despite the differences in study populations, these models are similar to our results in which 75%–85% of top-performing first on-treatment features were texture features (Online Supplemental Data). A combination of deep and supervised learning using clinical features, tumor location, size, and features extracted from postcontrast T1 images, fMRI, and DTI have also been successful in predicting survival accurately in newly diagnosed glioblastoma.37
Our study identified texture features from all conventional imaging sequences for both enhancing and WT volume contributory to predicting survival from first on-treatment MR imaging. Our goal using first on-treatment MR imaging was to assess immunotherapy-related imaging changes as opposed to progression-related changes because progression timelines and types vary across the dataset. The predictive value of first on-treatment imaging features may reflect biologic differences in responders versus nonresponders to immunotherapy, including molecular alterations and changes in immune expression and infiltration.38 The heterogeneity of the study population and integration of varied imaging protocols are strengths of the study. Similar out-of-bag and testing C-index values in each of the site-specific first-on treatment analyses demonstrate that the first on-treatment imaging feature-based prediction model is generalizable (Table 2).
Although overall survival in the durvalumab study was low, with a median survival of 208 days, 20% of the study population was alive at the time of last follow-up. The response rate to immunotherapy in solid and hematologic malignancies is also reported to be 20%–30%.39 Although the efficacy of checkpoint inhibitors in glioblastoma is unclear, preliminary results suggest a durable response in a small subset of patients.40 Early imaging-based biomarkers that predict response to immunotherapy41 can inform clinical decision-making.
Our study has several limitations. The relatively small sample size is a limitation, and the results need verification in larger prospective trials and assessment for generalizability to other immune checkpoint inhibitors. The sample size also did not allow us to analyze advanced MR imaging variables such as DWI/ADC or perfusion and various molecular alterations or study the radiomics features in individual treatment regimens or progression patterns separately. Instead, the treatment regimen was included as a variable in the random forest survival analysis, where it was among the top-performing features in only one of the first on-treatment models. In a larger checkpoint inhibitor trial, we hope to conduct similar experiments to further investigate the impact of treatment variation on model performance, expand on this work to train models based on distinct progression mechanisms, and validate results across other checkpoint inhibitors. Last, while the variation in image-acquisition parameters in this study supports the potential generalizability of the model, it also limits the reproducibility of the imaging dataset used for model training.
CONCLUSIONS
We created and validated a robust machine learning model for prediction of OS and PFS in patients with glioblastoma on PD-L1 inhibition immunotherapy using first on-treatment MR imaging features across multiple institutions with varying imaging protocols. Future studies are necessary to further assess the generalizability of the model and to combine additional clinical and advanced imaging features for more robust prediction of survival and progression.
Acknowledgments
The authors acknowledge the Ludwig Institute for Cancer Research, Cancer Research Institute, AstraZeneca, and Cure Brain Cancer Foundation for supporting the conduction of the trial, the site investigators and their teams, and the patients and their families for participating in the study.
Footnotes
E. George and E. Flagg contributed equally to the study.
The clinical study was funded by Medimmune, the Cancer Research Institute, and the Ludwig Institute for Cancer Research. Dr Huang received support from the American Roentgen Ray Society/American Society of Neuroradiology Scholar grant. Dr George received support from the American Society of Neuroradiology Scholar Award. Dr Bai received support from the Radiological Society of North America Scholar grant. Research reported in this publication was supported by a training grant from the National Institute of Biomedical Imaging and Bioengineering of the National Institutes of Health under award No. 5T32EB1680 and by the National Cancer Institute of the National Institutes of Health under award No. F30CA239407 to Dr Chang and by the National Cancer Institute of the National Institutes of Health under Award No. R03CA249554 to Dr Bai. Dr Vallières acknowledges funding from the Canada CIFAR AI Chairs Program.
Disclosure forms provided by the authors are available with the full text and PDF of this article at www.ajnr.org.
References
- Received October 20, 2021.
- Accepted after revision February 17, 2022.
- © 2022 by American Journal of Neuroradiology


