
Abstract
BACKGROUND AND PURPOSE: We hypothesized that 3D T1-TSE “black-blood” images may carry an increased risk of contrast-enhancing lesion misdiagnosis in patients with MS because of the misinterpretation of intraparenchymal vein enhancement. Thus, the occurrence of true-positive and false-positive findings was compared between standard MPRAGE and volumetric interpolated brain examination techniques.
MATERIALS AND METHODS: Sampling perfection with application-optimized contrasts by using different flip-angle evolution (SPACE) images obtained from 232 patients with MS, clinically isolated syndrome, or radiologically isolated syndrome were compared with standard MPRAGE and volumetric interpolated brain examination images. The intraparenchymal vein contrast-to-noise ratio was estimated at the level of the thalami. Contrast-enhancing lesions were blindly detected by 2 expert readers and 1 beginner reader. True- and false-positives were determined by senior readers' consensus. True-positive and false-positive frequency differences and patient-level diagnosis probability were tested with the McNemar test and OR. The contrast-to-noise ratio and morphology were compared using the Mann-Whitney U and χ2 tests.
RESULTS: The intraparenchymal vein contrast-to-noise ratio was higher in SPACE than in MPRAGE and volumetric interpolated brain examination images (P < .001, both). There were 66 true-positives and 74 false-positives overall. SPACE detected more true-positive and false-positive results (P range < .001–.07) but did not increase the patient's true-positive likelihood (OR = 1 1.29, P = .478–1). However, the false-positive likelihood was increased (OR = 3.03–3.55, P = .008–.027). Venous-origin false-positives (n = 59) with contrast-to-noise ratio and morphology features similar to small-sized (≤14 mm3 P = .544) true-positives occurred more frequently in SPACE images (P < .001).
CONCLUSIONS: Small intraparenchymal veins may confound the diagnosis of enhancing lesions on postgadolinium black-blood SPACE images.
ABBREVIATIONS:
- BR
- beginner reader
- CEL
- contrast-enhancing lesion
- CNR
- contrast-to-noise ratio
- ER
- experienced reader
- FP
- false positive
- iV
- intraparenchymal vein
- Lw-FDR
- lesion-wise false discovery rate
- SPACE
- sampling perfection with application-optimized contrasts by using different flip-angle evolution
- TP
- true positive
- vFP
- venous-origin FP
- VIBE
- volumetric interpolated brain examination
MS is a chronic inflammatory, degenerative disease of the central nervous system typically affecting young people and often impairing their quality of life.1 To balance the efficacy and adverse event risk, pharmacologic treatment should be tailored according to disease activity.2 Evidence of disease activity on MR imaging may prompt treatment re-challenge because new lesions are linked to an increased risk of a future relapse.3 Crucially, it was shown that the occurrence of just 1 contrast-enhancing lesion (CEL) carries an increased risk of relapse and subsequent disability.4⇓-6
Previous studies demonstrated that 3D T1-weighted TSE images provide superior sensitivity to enhancing MS lesions (CELs) in the brain and minimize vessel enhancement confounders due to the 3D-TSE “black-blood” characteristics related to the intravoxel spin-dephasing mechanism.7⇓-9 Furthermore, 3D-TSE T1 yielded significantly improved conspicuity in the evaluation of brain metastases10 and meningeal abnormalities.11 However, cases of CEL misdiagnosis linked to misinterpretation of the enhancement of normal intraparenchymal veins (iVs) were also reported with this technique.8,12 Indeed, experience from routine clinical imaging shows that signal from slow-flowing blood may not be suppressed on 3D-T1-TSE images and enhancing iVs may be found within T2-visible lesions (Online Supplemental Data). Recent studies indicate that developmental venous anomalies, representing relatively common sources of intraparenchymal venous enhancement,13 may be more frequently visualized in patients with MS.14 iVs and CEL can be as small as a few voxels.15,16 Thus, they represent a risk for misdiagnosis in the clinical imaging routine and are an acknowledged challenge for automated CEL detection tools.15⇓⇓⇓-19
Our working hypothesis was that 3D-T1-TSE black-blood images may carry an increased risk of CEL misdiagnosis because of misinterpretation of iVs. Thus, the occurrence of true-positive (TP) and false-positive (FP) findings was compared between the 3D-T1-TSE black-blood and the MPRAGE and volumetric interpolated brain examination (VIBE) standard techniques. Information about the size, enhancement, and morphologic features of both TPs and FPs was extracted.
MATERIALS AND METHODS
Participants
This study was approved by the Ethics Committee of Canton Ticino. Written informed consent was obtained from all participants. Between April 2015 and May 2017, we enrolled 246 consecutive adult patients undergoing brain MR imaging at the Ospedale Regionale di Lugano (Lugano, Switzerland) for MS, clinically isolated syndrome,20 or radiologically isolated syndrome.21 Patients' neurologic statuses (according to the Expanded Disability Status Scale), attacks, disease duration, and disease-modifying treatments were assessed within 4 weeks of MR imaging. Exclusion criteria were the following: other known inflammatory and/or neoplastic diseases potentially causing CEL occurrence; impossibility of receiving paramagnetic contrast agent due to allergy and/or the patient's refusal; pregnancy; and incomplete MR imaging examination.
Data Acquisition
Participants were examined using three 3T Magnetom Skyra (Siemens) scanners with the same 20-channel head coil model and software version. An optimized protocol aimed at minimizing potential biases from the different sequence geometry parameters, scan duration, and time gap between the first and last acquired image after contrast injection was used (Online Supplemental Data).22 The sampling perfection with application-optimized contrasts by using different flip-angle evolution (SPACE) is a 3D-TSE T1-weighted MR imaging technique providing vessel signal suppression (black-blood) characteristics related to the intravoxel dephasing mechanism.7 The MPRAGE and VIBE are 3D fast gradient-echo T1-weighted commonly used MR imaging sequences without blood-signal-suppression image characteristics. One-millimeter SPACE, MPRAGE, and VIBE sequences were consecutively performed in a randomized order, the first scan being started 5 minutes after contrast injection of a constant dose of 0.1 mL/Kg of gadobutrol. Sagittal 1-mm 3D FLAIR and axial 3-mm dual-echo (T2/proton-density weighted) images were acquired before contrast administration and used during the reference consensus determination (see below) to colocalize T2-visible lesions. All patients received at least 1 follow-up MR imaging examination, including, in doubtful cases, additional SWI to help distinguish venous-enhancement sources.23
Image Analysis
Image Quality.
Image degradation due to artifacts was rated by an experienced neuroradiologist (E. Pravatà, with 15 years of experience) using a previously used 3-point scale:12,24 0 = no relevant artifacts; 1 = mild artifacts not preventing analysis; 2 = artifacts preventing analysis. Cases with grade 2 artifacts were excluded from analysis.
Vein Quantitative Conspicuity.
To obtain reproducible estimations of the conspicuity of iV enhancement, we calculated the contrast-to-noise ratio (CNR) at the level of the superior thalamic iV in all patients according to the procedure described in the Online Supplemental Data.
Reference Consensus.
TPs were determined by 2 senior readers, 1 neuroradiologist (E. Pravatà), and 1 neurologist (C.G., with 20 years of experience in MS neuroimaging), both having all examination sequences available, including multiplanar and MIP reconstructions of postgadolinium images, as well as follow-up examinations. As previously proposed,16 a CEL was defined as contrast-enhancement area of at least 3 contiguous voxels showing typical T2, proton-density, and/or T2-FLAIR hyperintensity.25 Absence of proton-density/T2-FLAIR signal hyperintensity, persistent (>3 months) enhancement on follow-up,26 spontaneous unenhanced T1-weighted hyperintensity, and/or “atypical” enhancement patterns25 were considered as unrelated findings of MS disease. CEL morphology was classified as nodular, tubular, and ring/open-ring. Images were reviewed on a PACS PC workstation running syngo via (Siemens).
Blind CEL Detection.
Two different experienced readers (ER 1 and ER 2) (E. Prodi and D.D., with 11 and 9 years of experience, respectively), and 1 beginner reader (BR) (A.D., with 1 year of experience) reviewed independently all SPACE, MPRAGE, and VIBE images. They were asked to mark CELs according to the above-specified 3-voxel size criterion. Images were presented in a randomized order using the same PC setting described above.
FP Determination and Classification.
In a separate session, the 2 senior readers again reviewed all images including follow-up examinations and determined the FP findings under consensus according to the readers' blinded annotations. Morphology was categorized using the same TP classification. FP location was assessed as periventricular, corticojuxtacortical, or infratentorial according to the Magnetic Resonance Imaging in Multiple Sclerosis consensus guidelines.9,27 Each FP was assigned to 1 of the following categories: venous (vFP, including intraparenchymal vein, developmental venous anomalies, capillary angioma); spontaneous T1-hyperintensity (spontaneously hyperintense FP, including cavernous malformation, bleeding, paramagnetic material); and other/undetermined FP. Finally, CNR and volume values were estimated (L.D.) applying the procedure for iVs.
Statistical Analysis
Sequence-acquisition order and TP and FP spatial distribution and morphology differences were tested using the χ2 test. The Wilcoxon signed-rank test was used to compare image-quality grading. Interrater agreement was reported with the Cohen κ, with values between 0.21 and 0.4 interpreted as fair; 0.41–0.6, as moderate; 0.61–0.8, as good; and 0.81–1.00, as excellent agreement. TP/FP frequency differences between sequences and readers were assessed using the McNemar test. The lesion-wise false discovery rate (Lw-FDR) was calculated adapting a previously proposed approach:17 Lw-FDRsequence = FPsequence/(TPsequence + FPsequence).
To assess the effect of volume on CNR differences, we categorized vFP and TP into small (≤14 mm3) and large (>14 mm3) by performing a median split of their volume value distribution. Differences in the frequency of morphology types, volume, and CNR, were assessed with Pearson χ2 and Mann-Whitney U tests, respectively.
By using a logistic regression model, we estimated the likelihood of the sequence to produce FPs compared with the others using ORs and their 95% confidence intervals as effect measures. The same approach was used separately for TPs. CNR and volume differences were assessed using the Mann-Whitney U test as appropriate based on data distribution. Correlations between CNR and volume were tested using the Spearman ρ. We applied the Bonferroni method to account for multiple comparisons whenever a single hypothesis was tested multiple times due to subgroup analyses, specifically when comparing each rater's heterogeneity in the TP or FP rate among SPACE, MPRAGE, and VIBE sequences, expressed as head-to-head comparisons, and assessing the association between the TP or FP rate and image characteristics among patients, grouped according to vFP and TP volume (higher or lower than the sample median). P values < .05 were considered significant. SPSS software, Version 20.0.0 (IBM) was used for analyses.
RESULTS
Images of 3 patients were excluded from analysis, one because of incomplete scan examination (1 scan was interrupted by the patient, 1 scan was interrupted due to patient's motion shortly after initiation) and one due to contrast refusal (Fig 1). Image quality was acceptable (grade 0 or 1 artifacts) in 99.6% (SPACE), 99.2% (MPRAGE), and 98.7% (VIBE) of cases. The overall artifact grading was comparable between SPACE and MPRAGE (P = .705) scans, but worse in VIBE (P = .022) compared with the SPACE scan because of a higher frequency of grade 1 artifacts (29.7% versus 8.5%, respectively). Unacceptable artifacts (grade 2) were found in scans of 3 patients (VIBE: 3 patients, MPRAGE: 2 patients; SPACE: 2 patients), and they were excluded. iVs could be identified and segmented in at least 1 sequence and 1 hemisphere in 232 (96.7%) patients; the remaining 8 were excluded from further analysis (Fig 1).

Flow chart shows the included and excluded participants and the TP and FP determination procedure including blinded readers' and senior readers' image review. CIS indicates clinically isolated syndrome; RIS, radiologically isolated syndrome.
Demographics, clinical characteristics, and disease-modifying treatments of the evaluable patients are listed in Table 1. Proportions of patients on moderate, high, and very high disease-modifying treatment28 were 60.9%, 4.3%, and 17.4% respectively, while 17.4% were untreated.
Included patients' main demographics, clinical characteristics, and DMT
Sequence-acquisition order after contrast administration was not significantly different among the sequences (P = .454). The mean iV CNR differed significantly among sequences (P < .001), being higher for SPACE (4.49 [SD, 1.61]) compared with MPRAGE (2.11 [SD, 1.09], P < .001) and VIBE (2.28 [SD, 0.99], P < .001).
TP Enhancement Sources
Senior readers identified 66 CELs in 21 (9.1%) of the 232 patients. Of these, 38 (57.6%) were periventricular; 21 (31.8%), corticojuxtacortical; and 7 (10.6%), infratentorial.
The results of the readers' blinded review are reported in Table 2. The agreement between the 2 ERs was good (κ = 0.67, 0.72, and 0.78 for SPACE, MPRAGE, and VIBE, respectively). TPs occurred more frequently with SPACE acquisitions, except for ER 1 with MPRAGE, but this difference did not reach statistical significance (P = .070). The BR's reading performance for all sequences (P range .008–.039) was poorer than that of the ERs, suggesting an effect of the reader's experience on CEL-detection sensitivity. Furthermore, similar to the ERs, the BR was able to detect significantly more TPs in scans acquired with SPACE compared with MPRAGE and VIBE (P range = .008–.016).
Frequency of TP and FP sources of enhancement for each SPACE, MPRAGE, VIBE sequence, and blind readers
FP Enhancement Sources
Considering all readers' blinded reviews and sequences, 126 FPs were reported on SPACE, VIBE, and MPRAGE images of 46 patients. Of these, 52 FPs were recorded as the same findings by ≥2 readers, leading to 74 univocal FP findings in all sequences. FP spatial distribution differed compared with TP, being relatively more frequent in the infratentorial (41.8%) and less frequent in the periventricular (26.2%) compartment (P = .048). Both ERs misdiagnosed FP more frequently in SPACE (Lw-FDR = 0.31 for both) than in MPRAGE (Lw-FDR = 0.15 and 0.14), and VIBE (Lw-FDR = 0.16 and 0.18) (P range = .004–.008) (Table 2). Contrary to TP detection, the BR's performance was not significantly different from that of the ERs for all sequences (P range = .15–1), suggesting no advantage of the reader's experience to discriminate FP. However, similar to the ERs, the BR reported significantly more FPs on SPACE (Lw-FDR = 0.42) than MPRAGE (Lw-FDR = 0.16, P < .001) and VIBE (Lw-FDR = 0.27, P = .006) scans.
Patient-Level Diagnostic Accuracy
The average diagnostic sensitivity was 76% for SPACE (specifically 90% for ER 1, 71% for ER 2, and 67% for the BR), 67% for MPRAGE (specifically 76% for ER 1, 71% for ER 2, and 62% for the BR), and 66% for VIBE (specifically 71% for ER 1, 71% for ER 2, and 57% for the BR); while specificity was 89% for SPACE (specifically 91% for ER 1, 89% for ER 2, and 87% for the BR), 97% for MPRAGE (specifically 97% for ER 1, 97% for ER 2, and 97% for the BR), and 96% for VIBE (specifically 97% for ER 1, 96% for ER 2, and 95% for the BR). The Online Supplemental Data present the summary confusion matrix for each sequence and all raters averaged.
The patient's likelihood of being diagnosed with at least 1 CEL was moderately, but not statistically, significantly higher when using the SPACE rather than MPRAGE (OR = 1.2 and 1, respectively) or VIBE (OR = 1.29 and 1, respectively) (P range = .478–1) techniques. However, the FP misdiagnosis likelihood was significantly higher for the SPACE technique than for MPRAGE (OR = 3.55 and 3.53, respectively) and VIBE (OR = 3.03 and 3.08, respectively) (P range = .008–.015). Similar results were obtained by the BR (Table 3).
Patient-wise diagnostic accuracy results by OR analysisa
FP Categories
Of the 74 univocal FPs, most were vFPs (n = 59, 79.7%) and only 8 (10.8%) were spontaneously hyperintense FPs and 7 (9.5%) were other/undetermined FPs. Significantly more vFPs were encountered on SPACE (n = 38, 64.4% of cases) compared with VIBE (n = 10, 16.9%) and MPRAGE (n = 11, 18.6%) (P < .001, both). Exemplary cases of vFP are given in Figs 2 and 3 and in the Online Supplemental Data, and cases of spontaneously hyperintense FPs and other/undetermined FPs are presented in the Online Supplemental Data.

Illustrative case of nodular vFP enhancement. A tiny juxtacortical enhancement source on SPACE (circle in A), corresponding to a triangle-shaped hypointensity on the high-resolution susceptibility-weighted image (A1), is not detected on MPRAGE and VIBE images (circles in B and C, respectively). The corresponding FLAIR T2-weighed image (D) shows no evidence of demyelinating lesions at this level. This vFP was reported by ER 1 and the BR.

The upper panel shows an open-ring vFP enhancement consistent with a developmental venous anomaly and mimicking a TP enhancing juxtacortical CEL on SPACE images. Characteristic arcuate enhancement on SPACE image with subtle margins (circles) in the juxtacortical white matter (A), associated with faint hyperintensity on FLAIR T2 image (B), is barely visible on MPRAGE (C) and VIBE (D) images. This vFP was reported by the BR only. TP CELs with morphology similar to that of A on SPACE image (E) exhibits characteristic T2-FLAIR hyperintensity (F). In this case, CEL enhancement is clearly detected on MPRAGE (G) and VIBE (H) images as well.
vFP Features on SPACE Images
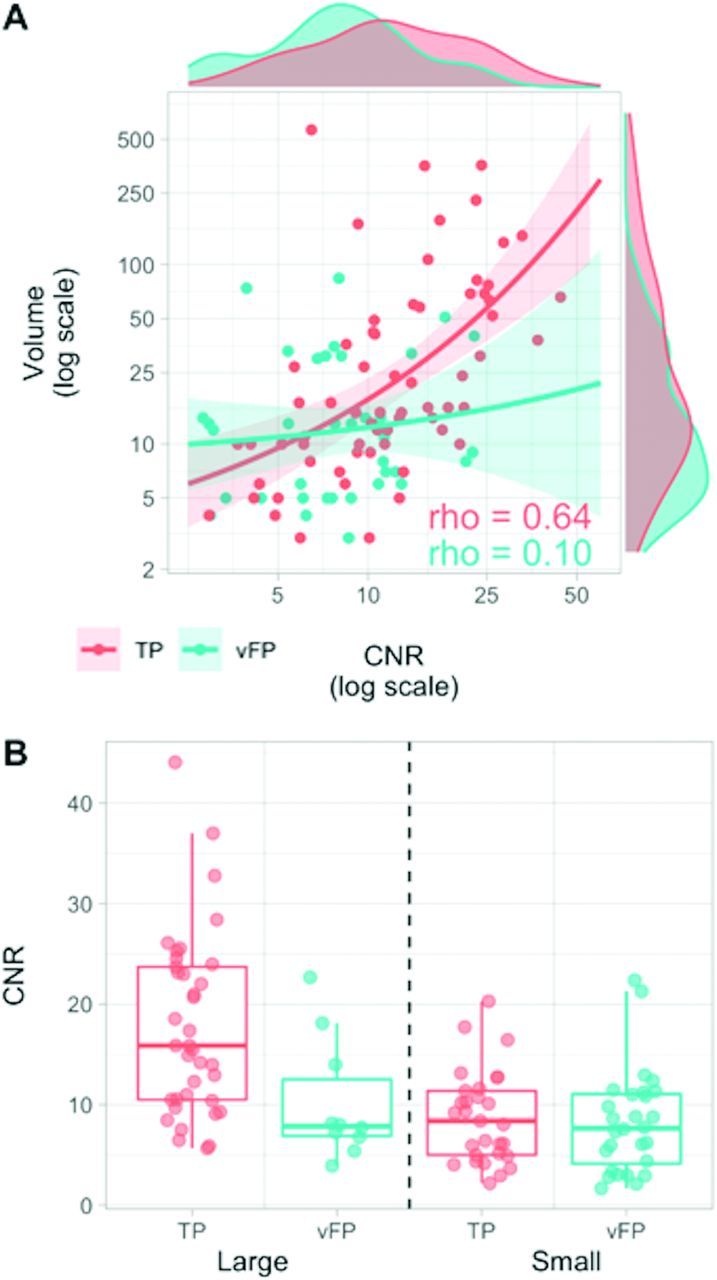
Table 4 illustrates the contrast-enhancement volume, CNR, and morphology features of vFP compared with TP. Overall, vFPs were smaller (P = .027) and had lower CNR values (P = .003) than TPs (Table 4). Higher CNR values were associated with larger volumes in TPs (ρ = 0.644, P < .001), but not in vFPs (ρ = 0.096, P = .568) (Fig 4).

A, Relationships between CNR and volume variables in TP (red) and vFP (cyan) findings. Higher CNR and larger volume values are more frequently represented in TP than in vFP (marginal density plots). The variables are significantly correlated in TP (ρ = 0.644, P < .001), but not in vFP (ρ = 0.096, P = .568). B, Boxplots represent CNR value-distribution differences between TP and vFP after median split categorization into small (≤14 mm3) and large (>14 mm3). CNR values are lower in vFP compared with TP in the large category only, but similar in the small category.
Quantitative characteristics of vFP and TP contrast-enhancement sources on SPACE imagesa
While the CNR was significantly lower in vFPlarge than in TPlarge, (P = .01), it was similar between vFPsmall and TPsmall (P = .544) (Fig 4).
The most frequent morphology was the “nodular” in both vFPs (68.4%) and TPs (78.8%). The “ring/open ring” presentation was found in 28.1% and 21.2%, and the “tubular,” in 10.5% and 0% of vFPs and TPs, respectively. Morphology category distribution was significantly different between vFPlarge and TPlarge only (P = .036), with less frequent nodular and more frequent ring/open ring presentations found in vFPlarge.
DISCUSSION
This study corroborates previous evidence from the literature demonstrating the superiority of black-blood 3D-T1-TSE with respect to standard 3D T1 gradient recalled-echo images in the detection of enhancing MS lesions.8,9 This finding is in line with the results obtained with enhancing brain tumors.22,29,30 SPACE is a 3D-T1-TSE MR imaging technique providing inherent black-blood characteristics related to the intravoxel dephasing mechanism, resulting in suppression of confounding high signal coming from high-flow and relatively larger vessels.7 Despite such characteristics, we show that in fact, small iVs may not be suppressed when using the 3D-T1-TSE SPACE technique, potentially mimicking CEL and leading to misdiagnosis of active inflammation. These findings are particularly relevant for both radiologists and neurologists involved in MS imaging and additionally for the design of automated CEL-detection software tools. Indeed, the classification of enhancement sources into a lesional or nonlesional origin relies on the colocalization of a typical hyperintensity on the corresponding T2, proton-density, and/or T2 FLAIR-weighted sequences. Whereas contrast enhancement in active demyelinating lesions is caused by the development of blood-brain barrier permeability, which follows the pathophysiologic MS-related inflammation cascade,31 venous enhancement derives from shortening of the blood T1-relaxation time after gadolinium injection. Because iVs may sit within a T2-visible lesion (Online Supplemental Data), these might mimic active and/or re-activating inflammation. It was previously acknowledged16,17 that relying on T2-visibile lesion correlation alone may be challenging due to segmentation and colocalization errors, particularly when dealing with small lesions. In addition, developmental venous anomalies, representing potential sources of nonlesional contrast enhancement in up to 9.6% of the adult population,13 may also exhibit some T2-FLAIR signal hyperintensity,14,32 thus potentially mimicking inflammation-related edema and/or demyelination.
Impact of the Reader's Experience
Two relevant findings emerged from the performance of readers with different levels of experience. First, SPACE images facilitated both TP detection and FP misdiagnosis in a similar manner between ERs and BRs. Second, even though the BR performance was expectedly lower than the ERs' performance in terms of TP detection, it was remarkably similar for FP misdiagnosis. Taken together, these results indicate a strong effect of the sequence choice for the assessment of TPs and FPs, being relatively independent of the level of the reader's experience.
Impact on MRI Estimation of Disease Activity
Even though SPACE sequences detected significantly more CELs, the superiority did not lead to a statistically significant advantage in terms of diagnosis probability at the patient level. More specifically, the probability of diagnosing 1 patient with at least 1 CEL was only slightly higher but not statistically significant compared with MPRAGE and VIBE. This intriguing finding might be explained, at least in part, by the relatively low prevalence of patients with at least 1 CEL in our cohort (9.1%), providing insufficient statistical power to test small sensitivity differences. Most important, however, this finding is in line with other recent studies reporting a relatively low incidence of patients with active lesions.33⇓-35 This is likely representative of the disease-activity features encountered in the current MS population and reflects the availability of increasingly effective drugs to suppress inflammation. Different MR imaging activity thresholds were suggested as a cutoff to define a patient as a nonresponder to a given treatment, but in several previous studies, even a single CEL was found to correlate with subsequent clinical worsening.4⇓-6 Crucially, misclassification of nonlesional enhancement as an MS CEL might lead to unnecessary change of treatment, with highly effective disease-modifying treatment being generally associated with a higher risk of adverse events.
Quantitative vFP Features
Because CEL detection and segmentation can be time-consuming and subject to intra- and interrater variability, there is a growing interest in obtaining robust automated detection and/or segmentation tools, especially for processing large amounts of data in clinical trials.15⇓⇓⇓-19 Various strategies were proposed to minimize errors on the basis of prior T2-visible lesion segmentation,18 adaptive local segmentation size,18 shape and anatomic location,19 conditional random field framework,16 and deep learning17 techniques. Despite the effort, misdiagnosis risk remains an acknowledged limitation, mainly due to the small size of both CELs and vFPs, leading to T2-lesion mislocalization and misregistration, unless conservative limitations in terms of detectable lesion size17 and/or dedicated pulse sequences15 are used. Here, we provided descriptions of the size, enhancement conspicuity, and morphology features of iV enhancement sources virtually indistinguishable from active demyelinating lesions when using SPACE images alone. In our cohort, small (≤14 mm3) vFPs could not be distinguished from CELs on the basis of the overlapping enhancement and morphology features. Indeed, the CNR (reflecting the enhancement conspicuity with respect to the background parenchyma) was similar and the nodular morphology was the most frequent one in vFPsmall and TPsmall. Thus, the vFP and TP features presented in this work provide previously undescribed knowledge about inherent limitations to the categorization of lesional and nonlesional sources of enhancement in patients with MS. On the basis of the groundwork laid in the present study, future investigations may test the benefit of multicontrast data set training (including SPACE, MPRAGE, and/or VIBE images, together with T2-FLAIR weighting) on the diagnostic accuracy of computer-assisted and neural network CEL-detection tools.
Limitations
SPACE black-blood intrinsic characteristics may be further explored using optimized techniques,7,9,36 potentially leading to an improved vFP suppression not assessed in the present study. Furthermore, we did not assess the variability of different magnetic field strengths and other black-blood techniques from different MR imaging vendors. Therefore, our results cannot be generalized to other settings. Readers could not have been completely blinded to the sequence type because they might have easily recognized each typical image appearance.22,37 The vFP number misdiagnosed in MPRAGE and VIBE scans was too low and prevented descriptive and comparative analyses for these techniques. Finally, we have not tested whether patients with specific T2-lesion-burden profiles may be more prone to have vFP findings. This issue deserves future computer-assisted investigations, possibly using lesion feature-extraction approaches.
CONCLUSIONS
Postgadolinium black-blood 3D-T1-TSE SPACE images provide superior sensitivity for the detection of active MS lesions compared with MPRAGE and VIBE scans. However, small venous enhancement sources may be indistinguishable on SPACE images alone, due to the overlapping enhancement and morphology features.
ACKNOWLEDGMENTS
The Authors thank Liliane Petrini for her help with manuscript editing.
Footnotes
C. Zecca and E. Pravatà contributed equally to this work.
This study received a grant from the Advisory Board of Research of Ente Ospedaliero Cantonale, Bellinzona, Switzerland.
Disclosure forms provided by the authors are available with the full text and PDF of this article at www.ajnr.org.
References
- Received August 21, 2021.
- Accepted after revision April 8, 2022.
- © 2022 by American Journal of Neuroradiology


