
Abstract
BACKGROUND AND PURPOSE: DSC-PWI has demonstrated promising results in the presurgical diagnosis of brain tumors. While most studies analyze specific parameters derived from time-intensity curves, very few have directly analyzed the whole curves. The aims of this study were the following: 1) to design a new method of postprocessing time-intensity curves, which renders normalized curves, and 2) to test its feasibility and performance on the diagnosis of primary central nervous system lymphoma.
MATERIALS AND METHODS: Diagnostic MR imaging of patients with histologically confirmed primary central nervous system lymphoma were retrospectively reviewed. Correlative cases of glioblastoma, anaplastic astrocytoma, metastasis, and meningioma, matched by date and number, were retrieved for comparison. Time-intensity curves of enhancing tumor and normal-appearing white matter were obtained for each case. Enhancing tumor curves were normalized relative to normal-appearing white matter. We performed pair-wise comparisons for primary central nervous system lymphoma against the other tumor type. The best discriminatory time points of the curves were obtained through a stepwise selection. Logistic binary regression was applied to obtain prediction models. The generated algorithms were applied in a test subset.
RESULTS: A total of 233 patients were included in the study: 47 primary central nervous system lymphomas, 48 glioblastomas, 39 anaplastic astrocytomas, 49 metastases, and 50 meningiomas. The classifiers satisfactorily performed all bilateral comparisons in the test subset (primary central nervous system lymphoma versus glioblastoma, area under the curve = 0.96 and accuracy = 93%; versus anaplastic astrocytoma, 0.83 and 71%; versus metastases, 0.95 and 93%; versus meningioma, 0.93 and 96%).
CONCLUSIONS: The proposed method for DSC-PWI time-intensity curve normalization renders comparable curves beyond technical and patient variability. Normalized time-intensity curves performed satisfactorily for the presurgical identification of primary central nervous system lymphoma.
ABBREVIATIONS:
- AUC
- area under the curve
- NAWM
- normal-appearing white matter
- nTIC
- normalized time-intensity curve
- MSID
- maximal signal intensity drop
- PCNSL
- primary central nervous system lymphoma
- PSR
- percentage of signal recovery
- TIC
- time-intensity curve
- CE-T1WI
- contrast-enhanced T1WI
- TTA
- time-to-arrival
- rCBV
- relative cerebral blood volume
The presurgical diagnosis of brain tumors is highly relevant to patient management. Although histopathology remains the criterion standard, a presurgical suggestion of particular tumor types, such as primary central nervous system lymphoma (PCNSL) or metastasis, may greatly influence further procedures.1⇓⇓-4
MR imaging plays a pivotal role in the presurgical identification of brain tumors. Conventional MR imaging findings have been widely described; nevertheless, their performance is limited.5⇓⇓⇓⇓⇓-11 Given this limitation, an increasing number of studies have focused on monitoring physiologic and metabolic characteristics. In this sense, parameters derived from DSC-PWI have shown promising results in the diagnosis of brain tumors, and especially PCNSL.12⇓⇓⇓⇓⇓⇓⇓-20 DSC-PWI generates time-intensity curves (TICs) from dynamic monitoring of T2* signal intensity changes during contrast administration. Specific well-known parameters such as relative cerebral blood volume (rCBV) and percentage of signal recovery (PSR) are extracted from these TICs. Although visual evaluation of the entire TICs has been suggested by some authors,21 to the best of our knowledge, there are no previous studies that have quantitatively evaluated the whole range of points that form the TIC altogether. This is probably because technical variability and patient physiologic characteristics hinder direct point-by-point comparisons.22⇓-24
Constructing normalized TICs (nTICs) would minimize the influence of physiologic and some technical parameters (especially regarding the timing of dynamics) on the TIC, offering interesting advantages: 1) It enables the possibility of performing a direct comparison of the entire nTIC between tumor types on a point-by-point basis, not limited to concrete parameters such as rCBV or PSR; and 2) it enhances the construction of user-friendly classifiers based on quantitative and visual comparison of particular cases to a data set of brain tumors.
The present article has 2 aims: first, to design an applicable method of processing TICs from DSC-PWI that allows obtaining normalized and comparable curves beyond technical and patient variability; and second, to test the applicability of this method by evaluating its diagnostic performance in a large series of patients with PCNSL.
MATERIALS AND METHODS
This article has been revised for publication by the research ethics committee of our tertiary hospital (Hospital Universitari de Bellvitge). The patient data were anonymized for this analysis. The confidential information of the patients was protected in accordance with national and European norms. Unspecific informed consent to participate in research projects was obtained from all patients. A waiver of a specific informed consent was provided by the ethics committee for this retrospective study.
Patients
Newly diagnosed patients with histologically confirmed PCNSL (2006–2019) were retrieved from our center database. Correlative cases by date and number, of glioblastoma, anaplastic astrocytoma, metastasis, and meningioma were retrieved from the same database for comparison.
Patients without PCNSL were selected to achieve the same number of patients with PCNSL, matched by year of acquisition. The rationale was to equalize the influence of technical differences of MR imaging sequences during such a long period (2006–2019) among tumor types. Inclusion criteria for the study were as follows: 1) confirmed tumor diagnosis by histology according to The World Health Organization 2007 or 2016 criteria, 2) an available diagnostic MR imaging examination including DSC-PWI and axial contrast-enhanced T1WI (CE-T1WI), 3) absence of previous oncospecific treatment at the time of the MR imaging examination, and 4) enhancing tumor on CE-T1WI with a shortest diameter of at least 10 mm. The flow diagram of study participants is shown in the On-line Figure.
Imaging
All the MR imaging examinations included in the study were acquired in the same tertiary hospital with 1 of 3 different scanners: Ingenia 3T with a 32-channel head coil, Ingenia or Intera 1.5T with a 16-channel head coil (Philips Healthcare). Acquisition parameters for DSC-PWI sequences (all gradient-echo) are summarized in On-line Tables 1 and 2. The intravenous contrast (gadobutrol; 1 mmol/mL, 0.1 mmol/kg) injection protocol was as follows: 18- or 20-ga peripheral intravenous access. No preload was performed. Baseline acquisition was on the order of 10 points. The start of the automatic injection (power injector at 4–5 mL/s) was by a manual setting. A final bolus of saline (25–50 mL) was injected at the same speed. The time and number of dynamics ranged from 1.26 to 3.55 seconds and 30 to 60, respectively.
Summary of the results in training and test subsets
The quality of the sequences was evaluated by visual inspection by 2 neuroradiologists (A.P.-E. and C.M.) with 5 years of experience in MR imaging of brain tumors. The examinations were labeled as poor quality and excluded from the study under the following circumstances: 1) artifacts prevented enhancing tumor segmentation on CE-T1WI or coregistration of CE-T1WI and DSC-PWI, or 2) an obvious low signal-to-noise ratio was observed in the raw TICs.
Postprocessing
Supervised semiautomatic volumetric segmentations (histogram thresholding and morphologic operations) of the enhancing tumor and normal-appearing white matter (NAWM) were performed on CE-T1WI and coregistered with DSC-PWI. Necrosis and nonenhancing components of the tumors were excluded from the segmentation. Semiautomatic volumetric segmentation of the whole enhancing lesion instead of partial, manual, or single-section ROI selection methods was chosen to minimize operator-dependency as well as to include all the intrinsic heterogeneity of the tumors in the analysis. 3D Slicer, Version 4.10 (http://www.slicer.org) was used for segmentation,25 and the BRAINSFit module of 3D Slicer, for coregistering.26
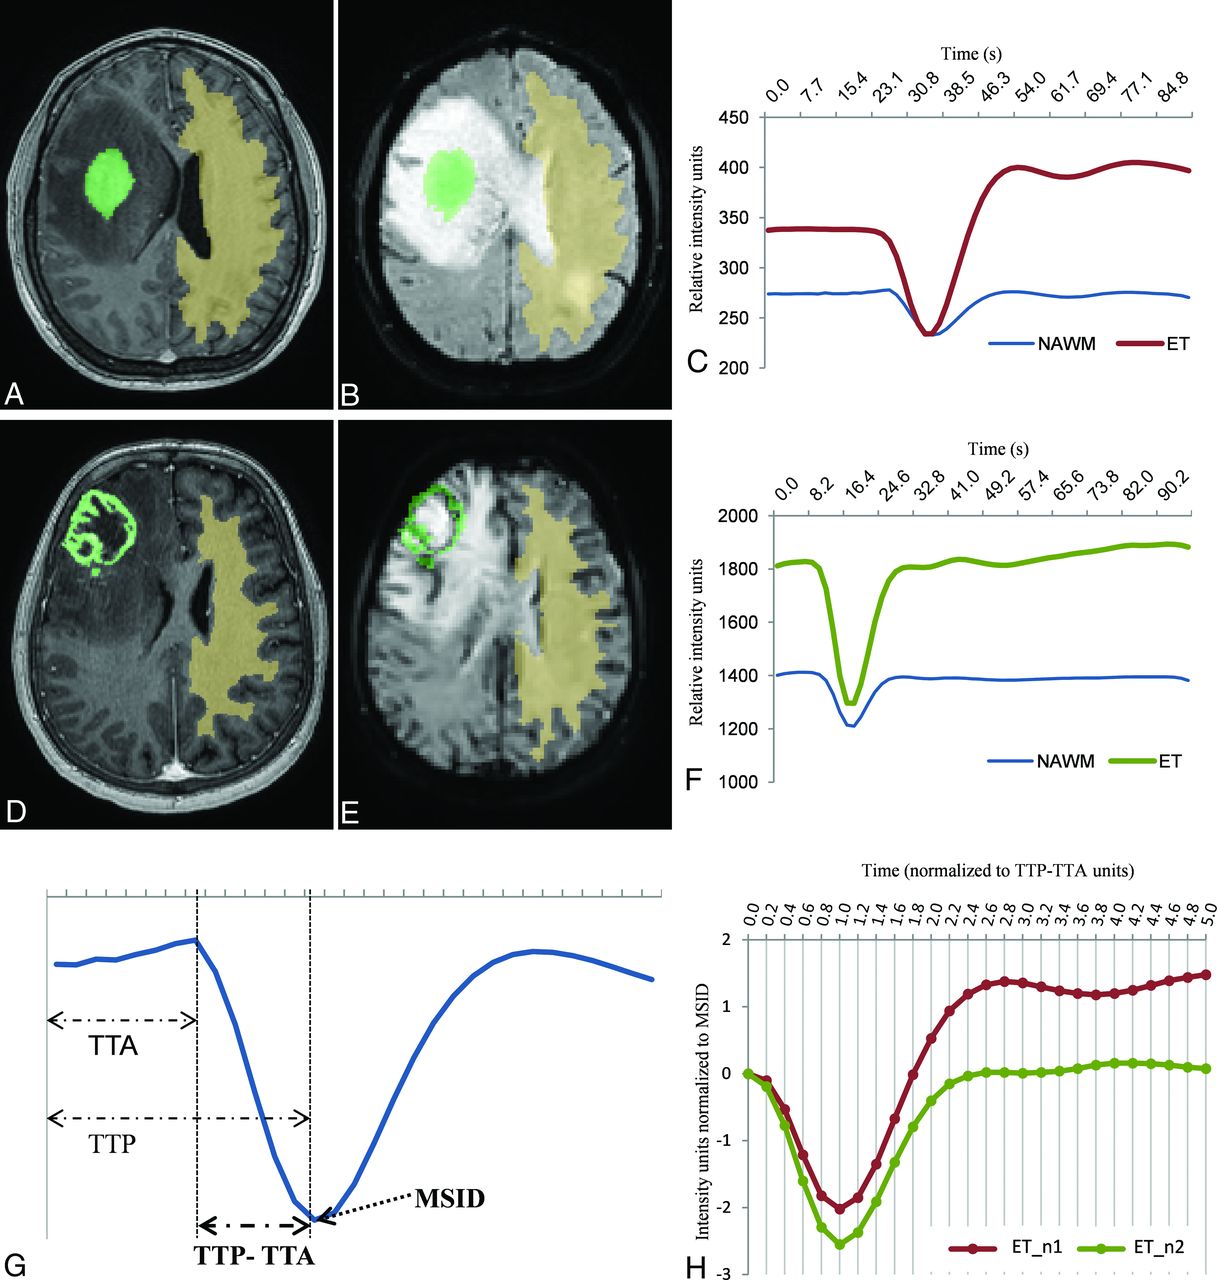
Two TICs for each case, 1 of the enhancing tumor and 1 of the NAWM, were obtained by averaging the TICs for all voxels within the segmented area. Baseline and the initial point of the descending curve were aligned. Signal intensity values (SIi) of the enhancing tumor TIC were normalized by dividing by the maximal signal intensity drop (MSID) of the NAWM (SIi/MSIDNAWM). Time values (Ti) were normalized as relative to the period of the descending curve on NAWM, which is the subtraction of time-to-peak (TTP) minus time-to-arrival (TTA) [Ti / (TTPNAWM – TTANAWM)]. We used TTP-TTA instead of TTP to normalize time values to avoid the potential human operator variability of TTA, mainly due to differences in the coordination between contrast infusion and sequence start. Finally, the same constant time points (0.2 TTP-TTA fractions from 0 to a total of 5, resulting in 26 constant time points) were extrapolated for all the curves (Fig 1). To detect the initial point of the descending curve necessary for alignment and TTA calculation, we calculated the average slope and SD of the 4 points before and after the MSID, and the first point where the curve slope became greater than the average minus the SD was established as the initial descending point.

Solid (A and B) and necrotic (D and E) tumors and respective NAWM segmentations on axial CE-T1WI (A and D) and coregistered on DSC-PWI (B and E). Resultant raw curves by averaging the TIC for each voxel within the segmented areas (C and F), noncomparable due to differences in time, intensity, baseline, or initial point of the descending curve. Exemplification of the parameters used to normalize the curves, MSID, and TTP-TTA, relative to NAWM (G). Resultant normalized tumor curves, superimposable and comparable point by point (H). Curves with the exact same number of time-matching points and sharing common units of time (relative to TTP-TTA of the NAWM) and intensity (relative to MSID of the NAWM).
The TICs were processed using Python 3.6 software (https://www.python.org/downloads/release/python-360/).
As a secondary subanalysis, to compare our method with conventional rCBV and PSR measures, we obtained mean rCBV and PSR values. rCBV was obtained with leakage correction27 and normalized to the NAWM; PSR was obtained as described by Cha et al.28 Both parameters were calculated using the same volumetric segmentation and coregistration as in the main analysis.
Statistics
The study sample was split into training (70%) and test (30%) subsets, which were balanced by the date of examination to minimize the impact of quality and technical differences between TICs of the more distant-in-time examinations. For the statistical analysis, pair-wise comparisons between PCNSL and each of the other tumor types were made. First, a stepwise selection was run in the training set, which rendered the 5 best discriminatory points per comparison pair. Stepwise selection is an unsupervised automatic procedure for variable selection, which can be used in cases of a large number of potential explanatory variables but with no underlying theory on which to base the model. Subsequently, predictive models were trained using logistic binary regression in each pair of the training set. Finally, the constructed classifiers based on the algorithms from the training set were applied to the test set.
All the statistical computations were performed with R statistical and computing software, Version 3.5.1 (http://www.r-project.org).29
RESULTS
Patients
Fifty PCNSLs fulfilled the inclusion criteria and were included in the study. An additional 50 glioblastomas, 45 anaplastic astrocytomas, 50 metastases, and 50 meningiomas balanced with PCNSLs by date were included for comparison. The entire initial dataset included 245 patients (133 men; mean age, 59 years; range, 18–85 years). Demographics of the study sample are summarized in On-line Table 3.
Anaplastic astrocytoma was the only tumor type whose number of cases could not match the total of PCNSLs. Although the prevalence of anaplastic astrocytoma was higher than that of PCNSL, this was because only 45 cases fulfilled inclusion criterion number 4, “Enhancing tumor on CE-T1WI with a shortest diameter of at least 10 mm.”
A total of 3 PCNSLs, 2 glioblastomas, 6 anaplastic astrocytomas, and 1 metastasis were ruled out by the quality filter. As a result, 47 PCNSLs, 48 glioblastomas, 39 anaplastic astrocytomas, 49 metastases, and 50 meningiomas were included in the final dataset (total n = 233). The patient dataset was split into training (70%) and test (30%) subsets balanced by the date of examination (training: 33 PCNSLs, 35 glioblastomas, 29 anaplastic astrocytomas, 36 metastases, and 36 meningiomas; test: 14 PCNSLs, 13 glioblastomas, 10 anaplastic astrocytomas, 13 metastases, and 14 meningiomas) (On-line Figure).
Normalized Curve Analysis and Pair-Wise Comparisons with PCNSL
Mean nTICs obtained from the training subset for each tumor type are shown in Fig 2. These mean curves are superimposable and comparable in a single graph due to the applied normalization method. This format provides a user-friendly tool for visual comparisons of nTICs. In this sense, notable differences were found between tumor-type nTICs on a first visual assessment, the most obvious around the MSID and the signal recovery segments. It is remarkable that all the curves in Fig 2 have the same number of time-matching points as well as sharing common units of time (relative to TTP-TTA of the NAWM) and intensity (relative to MSID of the NAWM). These features enable point-by-point absolute quantification of differences.

Normalized mean tumor curves for each type (PCNSL, glioblastoma, anaplastic astrocytoma, metastasis, and meningioma) obtained in the training subset (A). The curves are superimposable and comparable in a single graphic. This format provides a user-friendly tool for visual comparison of curves. Paired comparisons of normalized mean tumor curves for PCNSL against glioblastoma (B), anaplastic astrocytoma (C), metastasis (D), and meningioma (E), as well as representation of the 5 stepwise selected discriminatory TTP-TTA time points per pair (black dots).
The 5 best discriminatory time points per pair of tumors achieved by stepwise selection are represented in Fig 2. The classifier algorithms, based on the logistic binary regression with the intercept and the relative power (coefficient) for each stepwise selected time point, are shown in On-line Tables 4 and 5.
Satisfactory results were obtained to enable segregating tumor types in all pair-wise comparisons in the training set. In summary, the area under the curve (AUC) values for all bilateral comparisons ranged between 0.86 (PCNSL versus anaplastic astrocytoma) and 1.00 (PCNSL versus meningioma), while the classification accuracies ranged between 74% (PCNSL versus anaplastic astrocytoma) and 97% (PCNSL versus meningioma). The same algorithms were applied to the test subset of tumors, confirming satisfactory classifications with AUC values between 0.83 (PCNSL versus anaplastic astrocytoma) and 0.96 (PCNSL versus glioblastoma) and accuracies between 71% (PCNSL versus anaplastic astrocytoma) and 96% (PCNSL versus meningioma) (Table).
The discriminating threshold of the constructed predictive model was set to zero to calculate the exposed results. Zero value corresponds to the point of maximum accuracy in binary logistic regressions. Nevertheless, this threshold can be easily modified, allowing the algorithm to be adapted to different clinical scenarios requiring specific sensitivity or specificity profiles.
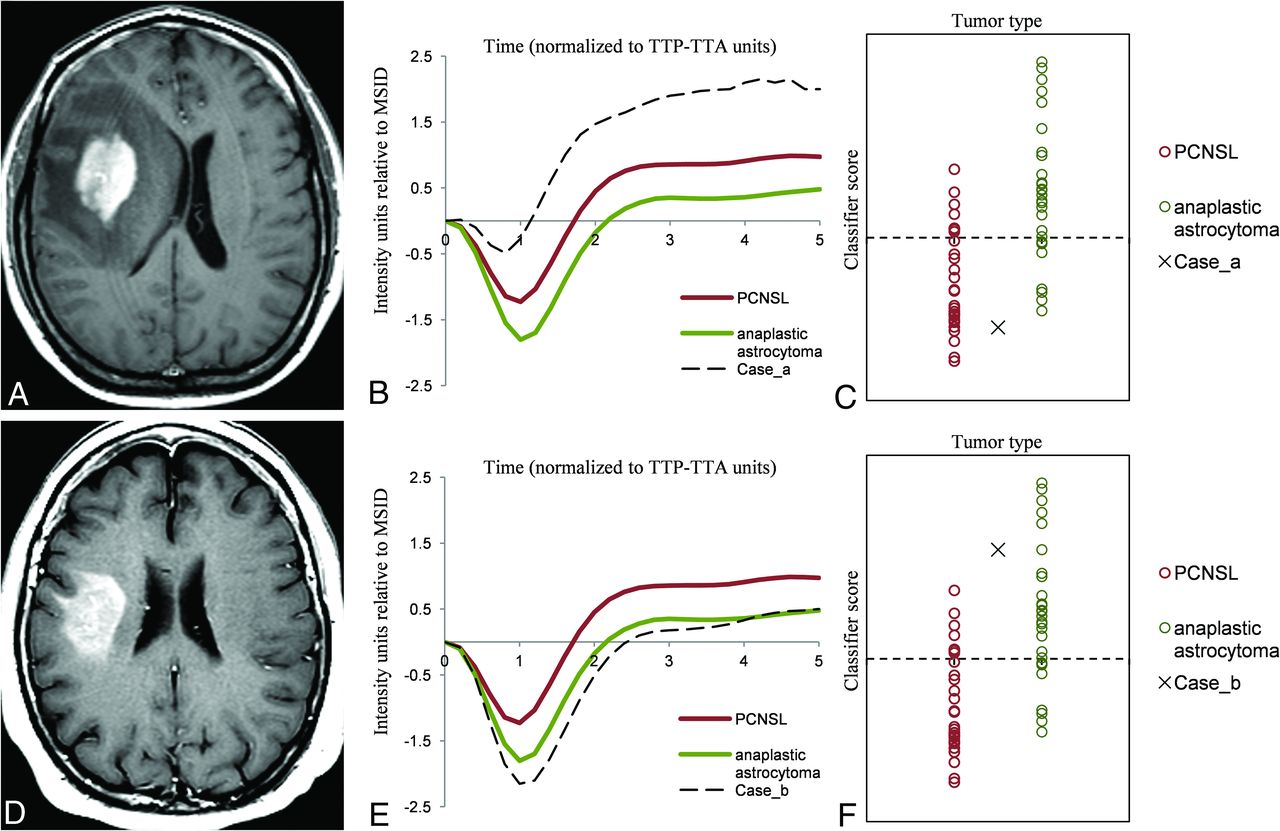
Figures 3 and 4 are real clinical examples of the classifier user-friendly applicability. The nTIC curves of particular “problem” cases are overlapped on mean nTIC curves of each tumor type to visually assess similarities. The values after running the algorithm on the “problem” cases are depicted in a scatterplot to visually assess the likelihood of a particular diagnosis.

Example of clinical applicability on a “real” problem case. Axial CE-T1WI of 2 different patients (A and D) depicting 2 subcortical right frontal, solid enhancing tumors. PCNSL and anaplastic astrocytoma may be diagnostic possibilities to consider. Tumor normalized curves of each case overlapped to PCNSL, and anaplastic astrocytoma mean curves for visual assessment (B and E) show that the case in the upper row has similarities with PCNSL while in contrast, the case in the lower row has similarities with anaplastic astrocytoma. Representation of the classifier results on a scatterplot (C and F) demonstrates that the case in the upper row remains on the inferior side and may likely be a PCNSL, while the case in the lower row is more likely to be an anaplastic astrocytoma. We pathologically confirmed both diagnoses: case in the upper row, PCNSL; case in the lower row, anaplastic astrocytoma.

Example of clinical applicability on a “real” problem case. Axial CE-T1WI of 2 different patients with similar tumors (A and D): well defined, solid, avidly enhancing and right frontal peripherally located. PCNSL and meningioma were the 2 main diagnostic options considered. The tumor normalized curve of each case overlapping with PCNSL and meningioma mean curves (B and E) show that the case in the upper row is similar to PCNSL while the case in the lower row is close to meningioma. Representation of the classifier results on the scatterplot (C and F) suggests that the cases are likely to be PCNSL and meningioma, respectively. We pathologically confirmed both diagnoses: case in the upper row, PCNSL, case in the lower row, meningioma.
Regarding the rCBV and PSR subanalyses, the performance of these parameters is summarized in On-line Tables 6 and 7. In a general sense, mean rCBV and PSR showed inferior diagnostic performance to nTICs, with the only accuracies being slightly superior for PSR in PCNSL versus anaplastic astrocytoma and PCNSL versus metastasis in the test subgroups.
DISCUSSION
In this study, we have reported the design of an innovative method to obtain normalized TICs from DSC-PWI beyond patient and technical differences, which allows the following: 1) constructing mean curves for visual analysis, 2) performing point-by-point statistical comparisons between curves, and 3) building classifiers. We have tested its applicability in the presurgical identification of PCNSL and obtained satisfactory results.
DSC-PWI is an MR imaging technique that can be performed on most MR imaging units currently and provides noninvasive in vivo assessment of microvascular systems. It consists of a dynamic temporal acquisition during the vascular first pass of a contrast bolus. The injection of gadolinium results in an initial reduction in T2 signal intensity of tissues and subsequent signal recovery during contrast washout. TICs can be generated from this process. Well-studied parameters such as rCBV and PSR are extracted from these curves. The rCBV corresponds to the AUC, is usually measured relative to the NAWM, and has been related to histologic measurements of tumor vascularization.22,24,30 The PSR is measured relative to the TIC baseline and may quantify the predominant T1 (signal recovery above baseline) or T2 (signal recovery below baseline) effects. These effects represent different leakage phenomena, which are explained by a complex combination of blood-brain barrier permeability, vascular volume fraction and vessel size, and tumor cell size and density.22,30,31 The extraction of rCBV or PSR from TICs may represent an oversimplification of the information contained in the entire TIC. In fact, the curves have many other points that remain excluded from these parameters. Along this line, some studies have suggested analyzing the whole curve to obtain improved information. Unfortunately, the proposed analysis was qualitative and limited to the visual pattern evaluation of the curve.21 Quantitative assessment of the entire curve has not been accomplished to date, to our knowledge. This could be due to differences in the acquisition technique (including operator-dependency on some parameters) and patient physiologic features, which produce noncomparable TICs between different examinations or patients.22,23 For example, there may be differences in the number and time of dynamics, in contrast injection start point and speed, or in patient heart rate preventing TICs from being comparable.16,22⇓-24
With these considerations in mind, we have developed a novel method for obtaining standardized, normalized, and comparable TICs independent of some technical and patient variability. We considered 2 parameters to be normalized to obtain comparable curves: time and intensity signal. Time was normalized as constant proportions of TTP-TTA from NAWM, and the time axis was re-dimensioned from seconds to fractions of 0.2 TTP-TTA units. Signal intensity was normalized to the MSID in NAWM. This normalization approach provided superimposable curves that could be visually analyzed and a list of point values that could be statistically compared among cases. Indeed, after normalization, mean curves for each tumor group could be constructed, allowing visual comparisons; the best discriminatory points with their optimal weighting for discrimination could be statistically determined, enabling the construction of classifiers; and particular cases could be displayed on scatterplots, providing visual representations of the likelihood of the diagnostic classification. Accordingly, we consider that this methodology could be further applied to construct user-friendly classifiers for the diagnosis of brain tumors. Examples of this potential application are shown in Figs 3 and 4.
We tested the performance of our method in the presurgical identification of PCNSL.
Reliable presurgical identification of PCNSL is vital because its management greatly differs from that of the other most prevalent enhancing brain tumors.1⇓-3,32 Maximal PCNSL resection is not recommended, and early stereotactic biopsy before corticosteroid administration is mandatory when it is suspected from imaging.32⇓⇓-35 Conventional MR imaging in PCNSL has been widely analyzed and may be useful for guiding initial management.5⇓-7 Nevertheless, these features may vary between patients and may overlap with other tumors.8⇓⇓-11 Thus, radiologic diagnosis of PCNSL remains a challenge, and additional advanced imaging techniques such as DSC-PWI are increasingly being evaluated. Many articles have evaluated the potential of DSC-PWI for differentiating PCNSL from other tumors with excellent results. These studies focus on rCBV and PSR quantifications. Basically, PCNSL shows low rCBV and high PSR.12⇓⇓⇓⇓⇓⇓⇓-20 Some authors recently reported an additional parameter directly extracted from TICs termed “peak height,” which has shown promising results.12,15 However, the lack of technique standardization, which causes variability in the identification of the best discriminating parameter and its relevant thresholds between different studies, as well as the lack of a user-friendly way to depict the results, impedes the widespread clinical application of these perfusion parameters.16,22⇓-24
We obtained satisfactory accuracy values in the comparisons between PCNSL and glioblastoma, anaplastic astrocytoma, metastasis, and meningioma in the test subset. Accuracies ranged between 71% (versus anaplastic astrocytoma) and 96% (versus meningioma). Moreover, the performance of the new method is overall superior compared with the analysis of conventional rCBV or PSR measures in our dataset (On-line Tables 6 and 7). Visual differences between the standardized nTICs of the different tumors were noted, especially in the segments around the MSID and the return to baseline (Fig 2). Statistical analysis confirmed that the best discriminatory points were situated around those segments of the curves that may somehow be related to the traditional rCBV, peak height, and PSR, which can be evaluated on conventional raw TICs. Indeed, we hypothesize that our method evaluates a mixture of these known relevant values along with other potentially discriminatory and otherwise hidden values of the curve, all together in a single step. Additionally, the method enables a user-friendly representation of the results (Figs 3 and 4). For this, we used a pair-wise model that takes advantage of the radiologist’s interaction by narrowing the most probable diagnoses. Then, the classifier is used as a support tool for diagnosis and not as an independent reader.
The variety of DSC pulse sequence parameters included in this retrospective study deserves special attention. Differences on these parameters (flip angle, TE, TR) affect the curve morphology and indeed seem to partially justify the variability in values and thresholds found in the literature regarding both rCBV and PSR.31 In this sense, an overall predominantly high T1-weighting of the sequences in our study (On-line Table 1) seems to be carrying higher PSR values if compared with some prior studies.20
Several limitations of our study must be considered. The single-site and retrospective character of the study may affect reproducibility. Nevertheless, the single-site origin may confer homogeneity that could be useful for this pilot study. At any rate, multicentric and prospective studies in new real clinical scenarios are needed for validation. The inclusion of a wide range of MR imaging examination dates and consequent technical differences may have affected the consistency of results. Some of them, such as the timing of dynamics or little heterogeneities in technical parameters, may be considered positive for the study by demonstrating the robustness of the method. Other parameters, such as variations in TE, TR, or flip angle, may be considered potentially confusing. In particular, higher T1-weighting of older sequences in our study may overestimate PSR values.20,31 Balancing of cases between tumor types and training and test cohorts was an attempt to minimize its impact on the results. Finally, we did not stratify subtypes of tumors or DSC sequence parameters used to avoid excessive fragmentation of the dataset.
On the other hand, our study has several strong points. First, a large sample of PCNSL was included, which provides a robust method and very high accuracy rates despite heterogeneity. Second, a wide-but-logical differential diagnosis was considered in the comparisons, which emphasizes the clinical usefulness of the results. Third, there is the semiautomatization of the image segmentation and coregistration as well as the TIC processing, which minimized operator-dependency in favor of reproducibility. Last, the method allowed including all the nTIC point values in the analysis without supervision, which provides an objective approach to the classification process.
CONCLUSIONS
The novel proposed method of assessing DSC-PWI renders normalized point-by-point comparable TICs beyond technique and patient variability, enables the construction of classifiers that can be presented in user-friendly interfaces, and shows good performance when tested, with excellent results in the presurgical identification of PCNSL.
Acknowledgments
We want to thank Marcel Vidal for assistance with statistics in an earlier version of the article.
Footnotes
Disclosures: Raquel Perez-Lopez—UNRELATED: Employment: Vall d’Hebron Institute of Oncology; Expert Testimony: Roche; Grants/Grants Pending: Astra Zeneca, CRIS Foundation, Prostate Cancer Foundation, FERO Foundation, Carlos III Research Institute*; Payment for Lectures Including Service on Speakers Bureaus: Roche. *Money paid to the institution.
References
- Received May 5, 2020.
- Accepted after revision July 3, 2020.
- © 2020 by American Journal of Neuroradiology


Jump to section
Related Articles
Cited By...
- Imaging of Lymphomas Involving the CNS: An Update-Review of the Full Spectrum of Disease with an Emphasis on the World Health Organization Classifications of CNS Tumors 2021 and Hematolymphoid Tumors 2022
- Diffuse Large B-Cell Epstein-Barr Virus-Positive Primary CNS Lymphoma in Non-AIDS Patients: High Diagnostic Accuracy of DSC Perfusion Metrics