
Abstract
Summary: High-speed biplane angiography is used to determine the path and velocity of microdroplets of contrast material in three dimensions. By allowing more accurate determination of detailed blood flow in feeding vessels and draining veins of cerebral arteriovenous malformations than available with standard angiography, the new method offers the potential for more accurate treatment and further study of neurovascular/cerebrovascular hemodynamics. The first study of the method is presented.
Details of blood flow can influence the progression of vessel disease (1–4). Also, for improved endovascular treatment of arteriovenous malformations (AVMs) with n-butyl cyanoacrylate (enbucrilate) embolic material, it is essential to determine accurately its transit time from the feeding vessels through the arteriovenous fistulas of the AVM as well as to ascertain the detailed architecture of the AVM. Because of the rapid convection and mixing that soluble contrast medium undergoes even in simple in vitro models (5), conventional angiographic methods have had difficulty in accurately measuring detailed velocities and transit times, especially under high-flow conditions (6, 7). Angiographic methods involving droplets of insoluble contrast material (Ethiodol and Lipiodol) with high-speed film cameras were first reported in the 1960s (8) for the measurement of detailed arterial flow in canine cardiac studies; however, there appears to have been no clinical application of the method. In this report, we illustrate a method for measuring microdroplets with the use of modern biplane digital subtraction angiography (DSA) equipment and describe how detailed quantitative information on vascular blood flow velocity far distal from the catheter tip can be obtained and used to improve endovascular interventions, using a clinical AVM as an example.
Technique
To determine velocity, we first find the droplet locations in three dimensions and calculate velocity from the droplet's change in location over time. The method to derive absolute locations of discrete droplets from biplane images was described in detail in a report of preliminary in vitro experiments (9).
A Toshiba Super Angiorex biplane DSA system consisting of a floor-mounted CAS30B C arm and a ceiling-mounted CAS110A C arm was used for all studies. Both imaging chains had 12-inch image intensifiers used in the 9-inch mode for the selective studies (vertebral injection) and in the 6-inch mode for the superselective (pedicle injection) studies. Standard DSA imaging procedures were performed prior to the experimental microdroplet runs and used for comparison. For the insoluble contrast media microdroplet runs, 20 μL of Ethiodol (Savage Laboratories, Melville, NY) was injected through a catheter positioned in an arterial pedicle of the AVM. The injection of such small amounts of Ethiodol for angiographic study required a specially modified Y connection with minimal dead space. One port of the Y connector was used to infuse small amounts of Ethiodol while the other port served for simultaneous saline flush.
This is the first report of quantification of droplet paths and detailed droplet velocity analysis; however, a previous work (6) reported the use of Ethiodol microdroplets compared with soluble contrast media to measure transit times in 24 AVM pedicles prior to embolization. It was found in that study that the ability to determine the transit time for the droplets to an accuracy of less than one frame-to-frame period was independent of observer (four clinical and three technical) because of the unambiguous localization of droplets in successive frames. The droplet transit times, however, can in principle have some variability depending on which path a given droplet follows and the phase of the cardiac cycle experienced. Because flow pulsatility is reduced for intracranial flow in small feeding vessels (6), the dependence of transit time on the cardiac cycle should not be great. Although the clinical research protocol called for only one injection of insoluble contrast material per pedicle, the subsequent treatment with a glue/insoluble contrast mixture appeared generally to confirm the path and transit times whereas transit times derived from soluble contrast material were on average twice as large (6). Thus far, no complications whatsoever can be attributed to this novel DSA technique, which uses one additional injection. The research was approved by the institutional human use review board and informed consent was obtained after the nature of the procedure had been fully explained.
Once the absolute locations of droplets were calculated, the complete path was plotted for the anteroposterior and lateral projections and a 3D rendering of the paths was made using MATLAB 5 (The Math Works, Natick, MA). The velocities along the path of the droplets were determined from the difference between successive images, and the magnitude of this 3D velocity was plotted as a function of time from injection.
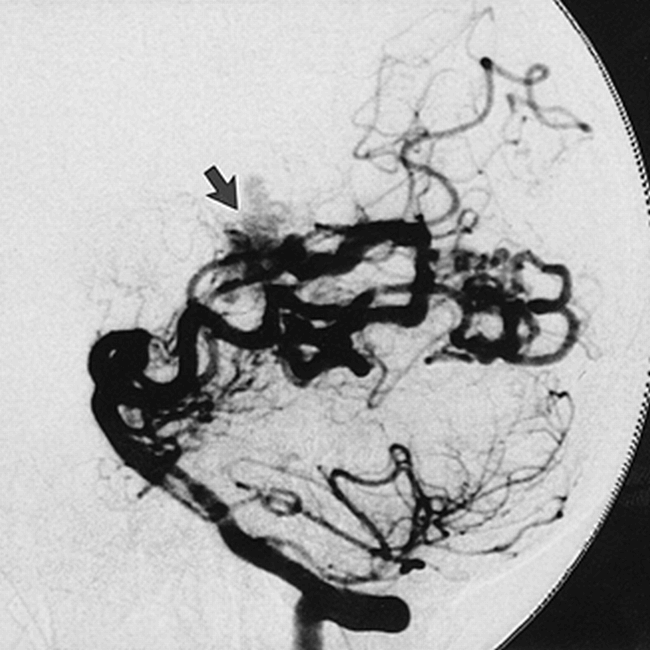
The illustrated case (Figs 1 and 2) is of a 47-year-old woman with a large parenchymal hemorrhage. Diagnostic angiography revealed a left temporoparietal AVM fed through multiple temporal and parietal branches of the posterior and middle cerebral arteries. The vertebrobasilar system used for the subsequent superselective approach was first depicted with biplane angiography (Fig 1). The vertebral angiogram shows AVM supply through temporal branches of the posterior cerebral artery, which are functionally enlarged.

Vertebral injection DSA using Optiray soluble contrast material: lateral view of arterial phase with technique parameters of 86 kVp, 320 mA, 23 milliseconds at 2.5 fps, 10242 × 10 bit images. Arrow indicates AVM

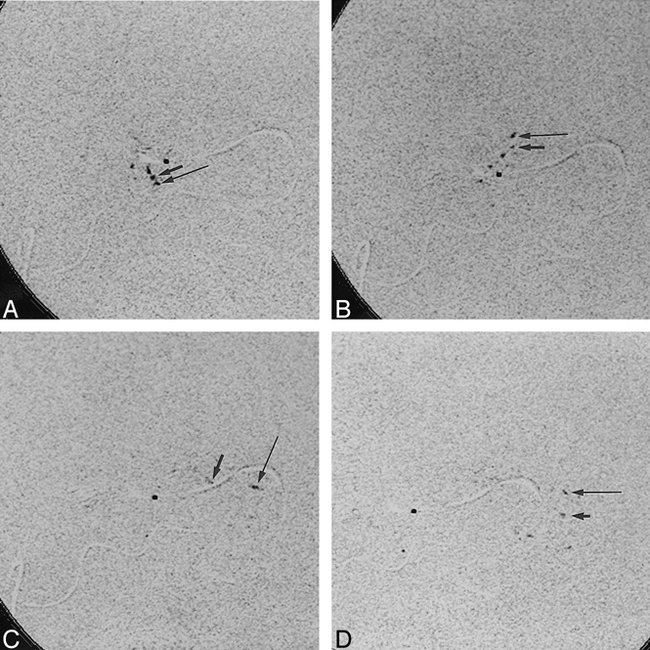
A–D, Superselective 15 fps DSA sequence of Ethiodol insoluble contrast medium shows transition from arteriovenous fistulas of the AVM to venous drainage: lateral view at 80 kVp, 400 mA, 4 milliseconds. Long arrow indicates droplet 1; short arrow, droplet 2
Frames from the superselective DSA sequence (Fig 2) were chosen to depict the time when contrast medium passes from the AVM feeding artery to the draining vein just prior to when the highest flow velocity of contrast material occurs. The arterial segment, adjacent to the venous part where the highest velocities are seen, represents the arteriovenous transition where the embolic agent should occlude the AVM. The beginning of the passage of contrast medium from the AVM feeder to the draining vein can be seen in the contrast agent's movement toward the right (Fig 2B). For the superselective DSA sequence with soluble contrast material, the transit time was read to be 0.26 second (four frame times) whereas that for insoluble medium (Fig 2) was read to be 0.13 second (two frame times).
The locations of three different droplets were manually recorded on each frame; the first two droplets were tracked from the catheter tip while the last droplet could only be tracked from the venous aneurysm. There were two other smaller droplets in some of the images; however, these are not included in the demonstration. The collection of all calculated locations of the three droplets was plotted to show the anteroposterior (Fig 3A) and lateral (Fig 3B) views of the path locations accumulated from the complete set of images (of which Fig 2A–D are a part). One 3D-rendered view of the droplet paths is shown (Fig 3C) and demonstrates the type of image that can be rapidly and interactively generated. Such a view can be better appreciated with an interactive rotating frame of reference.

A–C, Plots of the paths of three droplets: A, anteroposterior; B, lateral; C, 3D-rendered view
Path location data were used to calculate droplet velocities (Fig 4A–C) for each of the three droplets individually, and approximately similar locations were designated by letter labels (Fig 4A–C). The label T indicates the catheter tip; A, the droplet passing from the AVM arterial feeder to the draining vein; B, a location within the transmedullary vein; C, a location just proximal to the large venous aneurysm; D, the part of the aneurysmal pouch close to the outflow tract; and E, a location just distal to the venous aneurysm. Droplets 1 and 2 enter the aneurysm at location C and promptly leave, while droplet 3 gets caught in the vortex flow within the aneurysmal pouch and travels around at least three times before exiting to follow the paths of the other droplets. Droplet 3 could not be traced clearly between the catheter tip, T, and the time it entered the aneurysm, D; and thus there is a gap at the beginning of the plot (Fig 4C). The Table gives the average velocities for segments of the droplet tracks indicated by horizontal line segments (Fig 4).
Mean droplet velocities (cm/s) along segments of the droplet paths

A–C, Plot of absolute velocity as a function of the time from catheter emission for each of three droplets with letter labels indicating approximately similar locations (see text): A, leading droplet; B, second droplet; C, trailing, or third, droplet
Discussion
Although rapid superselective DSA sequences and especially droplet tracking studies can provide detailed information on flow, information regarding the vessel lumen must still be obtained from conventional lower-frame-rate, superselective, soluble contrast medium sequences (Fig 1), in which contrast material is diluted too rapidly to allow flow visualization away from the site of injection. Conversely, the droplet sequences do not give detailed information about the vessel lumen. Most recently, microdroplets of soluble contrast media and insoluble contrast media have been combined in one injection to achieve the advantages of both types of media in one imaging sequence (7, 10, 11).
Conventional frame rates for diagnostic neurovascular procedures, usually in the range of two to six frames per second (fps), are not sufficient to follow details of the rapidly flowing blood near disease processes such as AVMs. This study with a short high-flow-rate arterial segment feeding the AVM indicates that even frame rates as high as 15 fps may be insufficient in some instances to delineate smoothly the paths of droplets exiting the AVM and traversing an aneurysm (venous aneurysm in this case). Although the 4-millisecond X-ray pulse duration for droplet velocities of 25 cm/s would result in a 1-mm location blur, the 15 fps result in data sampling in each plane only after the droplet travels 17 mm and helps to explain the roughness of the paths illustrated in Figure 3 created by a straight line connection of these widely spaced points. By assuming straight-line paths between frames, the calculated droplet velocities are minimum values.
Although an increased frame rate for the droplet study could improve data smoothness, the insoluble contrast media DSA study nevertheless demonstrates substantial improvement in the ability to depict the sequential movement of insoluble contrast material within the AVM and its transition from the AVM to the draining vein. The droplets appear first to go downward from the catheter tip (Fig 2) and then to go through small loops within the microarchitecture of the AVM before proceeding upward toward the draining vein. The lumen of the loops appears better in the soluble contrast runs; however, they seem to fill together. The filling sequence and hence the connectivity of the microarchitecture can be appreciated only from the insoluble droplet study. For the droplet DSA sequences, the transition from the AVM to the draining vein is marked by a clear upward movement of droplets (Fig 2B) followed by a rapid movement toward the right (from Fig 2B to Fig 2C and D).
The inability to differentiate a clear edge to the soluble contrast agent due to its dilution and mixing may in part explain why the AVM transit time observed in this study was approximately two times the transit time observed when using insoluble droplets. A more extensive study of many AVM pedicles that applies both contrast materials supports this transit time relationship (6).
Increased exposure of patients to radiation must be considered as a possible disadvantage of adding one high-speed DSA sequence to procedures that are already of concern for short-term effects of epilation and erythema. Nonetheless, our experience is that the increase in dose is less than 10%. In the present study, the fact that the short pulse duration reduced the per-frame exposure by about a factor of 4 makes the sequence comparable in dose to one additional conventional DSA sequence taken at about 4 fps. Additionally, the simultaneous implementation of ROI radiologic methods (12) can reduce the patient dose across 80% of the field of view by factors of 3 to 10. When properly implemented, it is difficult to see how conservative use of droplet DSA imaging together with ROI radiologic techniques would significantly increase the probability that patient dose would surpass the threshold for the onset of deterministic effects.
A unique by-product of this study is the velocity map (Fig 4). The velocity plot for the two droplets tracked through the AVM clearly shows a substantial increase in velocity as the droplets leave the arterial feeder of the AVM while entering the venous segment. In fact, this characteristic is being used presently in clinical procedures at our institution to determine the extent to which embolic material should be allowed to penetrate the AVM. The rapid temporary increase in flow velocity at the outlet of the arteriovenous fistula may be explained by a sudden impedance change at that point of transition from a small artery to a larger, more compliant vein and by the increase in total flow through the draining vein from other fistulas feeding into the same location. A sudden impedance change at the arteriovenous fistula is hemodynamically analogous to a stenosis leading to increased flow velocity. In addition, the phase of the cardiac cycle during which droplets pass through the fistula may contribute to variability in droplet velocity; simultaneous recording of ECG signals may be of help in future measurements of droplet paths to correlate with more accurate velocity determination.
Further comparison of the droplet velocities (Fig 4) indicates a corresponding slowing down for droplets 1 and 2 at location B, where there appears to be a sharp turn in the paths. However, there does not appear to be much correlation in details of velocity at location C, proximal to the aneurysm, at location D, within the aneurysm, and at location E, distal to the aneurysm. This apparent lack of simple correlation may be due to the inadequate data sampling caused by the limited frame rate, to differences in the actual paths taken by the droplets and hence to differences in detailed flow experienced by them, and also to differences in the cardiac phase for droplet 3, which was the last droplet temporally. Nevertheless, the mean velocities of the droplets not including the passage in the AVM and aneurysm appear about the same, as indicated in the Table, where, especially near location E, the average velocity of all three droplets can be compared and is about 15 cm/s.
Conclusion
The microdroplet tracking method enables observation of the connectivity and filling sequence of the detailed AVM microarchitecture. Also, the AVM to vein transition can be accurately demarcated by means of the new microdroplet tracking technique, because it allows quantitative measurements of velocity. Finally, detailed flow in vessels, including aneurysms, can be demonstrated. Further development may include droplet tracking at higher frame rates, ECG correlation, animal model experiments to assess path variability and correlation with glue treatment, and development of new contrast media for use in wider vascular applications.
Footnotes
↵1 Supported in part by grant R01NS31883 from the National Institutes of Neurological Disease and Stroke, National Institutes of Health; by Whitaker Foundation Biomedical Engineering Research grant 95–0028; and by an equipment grant from Toshiba Corp.
↵2 Address reprint requests to Stephen Rudin, PhD, Department of Radiology, Division of Radiation Physics, State University of New York at Buffalo, 462 Grider St, Buffalo, NY 14215.
- Received July 1, 1998.
- Copyright © American Society of Neuroradiology
In this issue


Jump to section
Related Articles
Cited By...
- No citing articles found.