
Abstract
BACKGROUND AND PURPOSE: The clinical relevance of proton MR spectroscopy needs further clarification as to its usefulness and limitations. The purpose of this study was to investigate the correlation between the semiquantitative choline-containing compound level (Cho value) measured by MR spectroscopy and the Ki-67 labeling index in gliomas.
METHODS: Localized proton spectra were obtained in 26 consecutive patients with glioma who subsequently underwent surgery for tumor removal. Metabolic values in the spectra were measured semiquantitatively using an external standard of reference. The Ki-67 labeling index was measured in the surgical specimen. Because the semiquantitative metabolic values may be affected by tissue components included in the spectroscopic voxel, the MR imaging appearance of the voxel within the tumor was classed as homogeneous or heterogeneous through visual evaluation of the presence of necrosis, cyst, hemorrhage, and calcification, and pattern of enhancement.
RESULTS: We found a strong linear correlation between the Cho value and the Ki-67 labeling index in the 18 homogeneous gliomas, but no correlation was found in the eight heterogeneous gliomas, which turned out to be malignant.
CONCLUSION: The semiquantitative Cho value is a reliable predictor of proliferative activity of gliomas when the tumor appears homogeneous on MR images.
Preoperative assessment of tumor proliferative activity or malignancy has a potentially significant impact on the therapeutic strategy for patients with brain tumor. Positron emission tomography has been the method of choice for evaluating metabolism and malignancy (1–4). Recently, single-photon emission CT with thallium-201 has shown that higher uptake reflects higher cell growth rates and greater malignancy of gliomas (5, 6). Both these methods, however, use radioactive isotopes that are invasive and involve handling problems. Histologic examination using a Ki-67 labeling index is a promising proliferation marker, as a higher rate of Ki-67-positive cells corresponds to greater malignancy in gliomas (7–9), but this method is applicable only to tumor specimens obtained by surgery.
Proton MR spectroscopy is a noninvasive method that allows measurement of various metabolites in vivo, such as choline-containing compounds (Cho), creatine and creatine phosphate (Cr), N-acetyl aspartate (NAA), and pathologic levels of lactate (10). Increased Cho and decreased NAA levels are common findings in brain tumors, and various levels of lactate and lipid may be detected (11–21). Prediction of tumor malignancy by MR spectroscopy remains controversial (13, 14, 20, 22–25), but our previous study suggested that the Cho level may be a reliable index for predicting the malignancy of gliomas (26).
In this study, we investigated the possibility of a noninvasive means of predicting tumor proliferation activity by semiquantitatively measuring Cho levels in a tumor, using an external standard of reference, to give a Cho/reference ratio (the Cho value) and by comparing these levels with the Ki-67 labeling index of the tumor specimen obtained at surgery.
Methods
Twenty-six consecutive patients with glioma, 15 men and 11 women, 24 to 79 years old (mean age, 46 years), were enrolled in the study after giving informed consent. All patients underwent the current MR imaging/spectroscopy protocol and subsequent surgery for subtotal or total tumor removal. The MR study was performed within 2 weeks prior to surgery. The spectroscopic voxel of interest was located within the assumed tumor body, the high-quality spectra allowed reliable peak area measurements, and the histologic diagnosis, including the Ki-67 labeling index, was robust in all patients (Table). We did not include patients with gangliogliomas, because our recent study showed different spectroscopic and proliferative characteristics in these cases (27).
Findings in 26 patients with glioma
Routine MR imaging included T1-weighted spin-echo, T2-weighted fast spin-echo, and contrast-enhanced T1-weighted axial imaging several days before the spectroscopic study.
Single-voxel point-resolved spectroscopy was performed using a 1.5-T system and a standard head coil for imaging with a spectral width of 2500 Hz, 2048 data points, and 2000/272/128–256 (TR/TE/excitations). Shimming and water suppression were done with automatic software (PROBE, General Electric Medical Systems, Milwaukee, WI). The voxel of interest varied from 12 × 12 × 16-mm to 20 × 20 × 20-mm depending on the tumor size. The size and location of the voxel were carefully adjusted to include the most homogeneous tumor parenchyma as determined from the previously obtained MR images and from the T1- and T2-weighted axial images obtained at the spectroscopic examination. More specifically, we intended to avoid inclusion in the voxel of obvious necrosis, cyst, hemorrhage, or calcification, which can be discerned on T1- and T2-weighted images. We also intended to include the part of the tumor showing the most homogeneous enhancement, regardless of its strength, as depicted on the previously obtained contrast-enhanced T1-weighted images. The present spectroscopic measurements were performed before contrast agent administration. After spectroscopy, T1-weighted imaging was performed with contrast enhancement to confirm the spatial relationship between the spectroscopic voxel and the enhanced tumor region.
The MR imaging appearance of the tumor contained within the spectroscopic voxel was assessed retrospectively. The voxel appearance was considered homogeneous if no evidence of necrosis, cyst, hemorrhage, or calcification was seen on T1- and T2-weighted images. If one or more of these features were obviously included in the voxel (eg, because of the small size of the tumor or location of the features at the tumor center), the voxel appearance was considered to be heterogeneous. The voxel appearance on contrast-enhanced T1-weighted images was judged as absent, faint, homogeneous, or heterogeneous (including ringlike) enhancement.
Numerical analysis of MR spectroscopy used the area under the Cho peak at 3.2 ppm measured using a macro (PROBE pro-macro). Four dominant peaks were analyzed in the brain: NAA at 2.0 ppm, Cr at 3.0 ppm, Cho at 3.2 ppm, and lactate at 1.3 ppm (10). The lactate assignment was made on the basis of the formation of the characteristic doublet due to J coupling or to inversion of the peak at a TE of 136 or both due to the J modulation (13). The lactate peak is often irregular in shape, small in size, or contaminated by lipid signal, thus preventing reliable area measurement under the peak. Therefore, lactate was evaluated as −, not detected; +, a peak with signal-to-noise ratio (SNR) less than 5; ++, SNR between 5 and 10; +++, SNR between 10 and 15; and ++++, SNR more than 15. When the lipid signal was prominent, lactate was not evaluated.
The semiquantitative measurement protocol has been described previously (26). Briefly, a 200-mM solution of N-acetyl >/SCAP<L-alanine (Sigma, St Louis, MO) containing 5 mM of NiCl2 was positioned adjacent to the patient's head and used as an external standard of reference. All signal intensities were divided by the size of the voxel to generate volume-corrected signal intensities. The semiquantitative metabolic values were expressed as ratios of the N-acetyl >/SCAP<L-alanine peak area (the metabolic values). The reproducibility of the present semiquantitative method was within acceptable limits (26). A study of healthy volunteers (all male, aged 24 to 38 years) showed that the normal NAA, Cho, and Cr values were 3.59 ± 0.34, 1.96 ± 0.33, and 1.53 ± 0.32, respectively (mean ± SD, arbitrary unit, frontal white matter, n = 17). In the same study, mean conventional metabolic ratios were Cho/Cr, 1.35 ± 0.37; and Cho/NAA, 0.54 ± 0.10.
All patients underwent surgical tumor removal. The tumor was resected en bloc when possible and by several parts otherwise. The histologic diagnosis was made according to the World Health Organization classification (28). The tissue sample nearest to the spectroscopic voxel was visually identified during sectioning through comparison with MR images and served for the Ki-67 staining. Ki-67 staining of paraffin-embedded sections with monoclonal antibody MIB-1 used a modification of the technique of Shi et al (29). Briefly, the sections were deparaffinized then placed in 300 mL of citrate buffer (pH 6.0) and heated five times for 3 minutes each at full power in a 500-W microwave oven to activate the epitope of Ki-67 protein. After heating, the sections were reacted for 12 hours with MIB-1 diluted 1:50 in phosphate-buffered saline containing 1% normal rabbit serum, stained by the avidin-biotin complex method, developed with diaminobenzidine, and counterstained with methyl green. More than 1000 cells were counted in several areas of the section that were as representative as possible of the pathologic characteristics, and the Ki-67 labeling index was calculated as the percentage of positively stained nuclei.
Data are expressed as mean ± SD. Differences in the Ki-67 labeling index and the Cho value between histologic grades were assessed for grade 1 and grade 2 gliomas (combined as low-grade gliomas because there were only five cases) and grade 3 and grade 4 gliomas both separately and combined as malignant gliomas. The factor analysis of variance was used followed by the Scheffe F test for multiple comparisons. An unpaired t-test was used for comparison between benign and malignant gliomas. Differences of P < .05 were considered to be statistically significant. Linear regression analysis was performed to assess the relationship between the Ki-67 labeling index and the Cho value.
Results
The Table lists the findings in all patients. There were five low-grade (grades 1 and 2) gliomas, 12 grade-3 gliomas, and nine grade-4 gliomas. Homogeneous spectroscopic voxels on plain T1- and T2-weighted images receiving no, faint, or homogeneous contrast enhancement were seen in all five low-grade gliomas, in 11 of 12 grade-3 gliomas, and in two of nine grade-4 gliomas. On the other hand, in cases 17 through 24, the spectroscopic voxel appearance was heterogeneous on plain or contrast-enhanced MR images or both (indicated by parentheses in the Table). Moderate to high (++) lactate or lipid levels were detected in one of five low-grade gliomas and in 12 of 21 high-grade gliomas. Absent or low (− or +) lactate levels were observed in four of five low-grade gliomas and in nine of 21 high-grade gliomas.
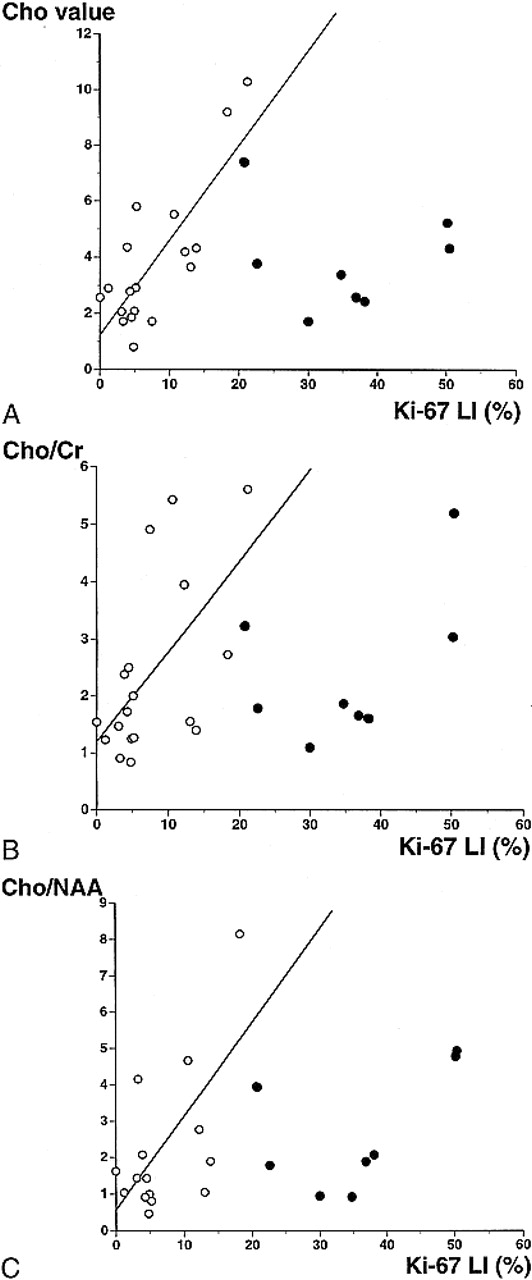
Linear regression analysis of the Ki-67 labeling index and the Cho value from the homogeneous spectroscopic voxels showed a good linear relationship (r = .81, P < .0001) (Fig 1A). There was also a weak linear relationship between the Ki-67 labeling index and the Cho/Cr ratio (r = .58, P < .02) (Fig 1B) and between the Ki-67 labeling index and the Cho/NAA ratio (r = .60, P < .02) (Fig 1C).

A–C, Relationships between the Ki-67 labeling index and the Cho value (A), the Cho/Cr ratio (B), and the Cho/NAA ratio (C). Open circles indicate that the spectroscopic voxel is homogeneous on MR images with absent, faint, or homogeneous enhancement by contrast material. Closed circles indicate that the spectroscopic voxel is heterogeneous on MR images before or after contrast administration (cases 17–24, Table). There is a strong linear relationship between the Ki-67 labeling index and the Cho value, indicated by open circles (y = 1.24 + 0.34 * x, r = .81, P < .0001). There is a weak correlation between the Ki-67 labeling index and the Cho/Cr or Cho/NAA ratio, indicated by open circles (y = 1.22 + 0.15 * x, r = .58, P < .02 and y = 0.65 + 0.23 * x, r = .60, P < .02, respectively). Extreme data for the Cho/NAA ratio from cases 6, 13, and 25 are not shown in the graph.
No relationship was found between the Ki-67 labeling index and the Cho value, the Cho/Cr ratio, or the Cho/NAA ratio when all cases were included in the analysis. The Ki-67 labeling index was higher than approximately 20% when the spectroscopic voxel was heterogeneous and spectroscopic values were relatively low.
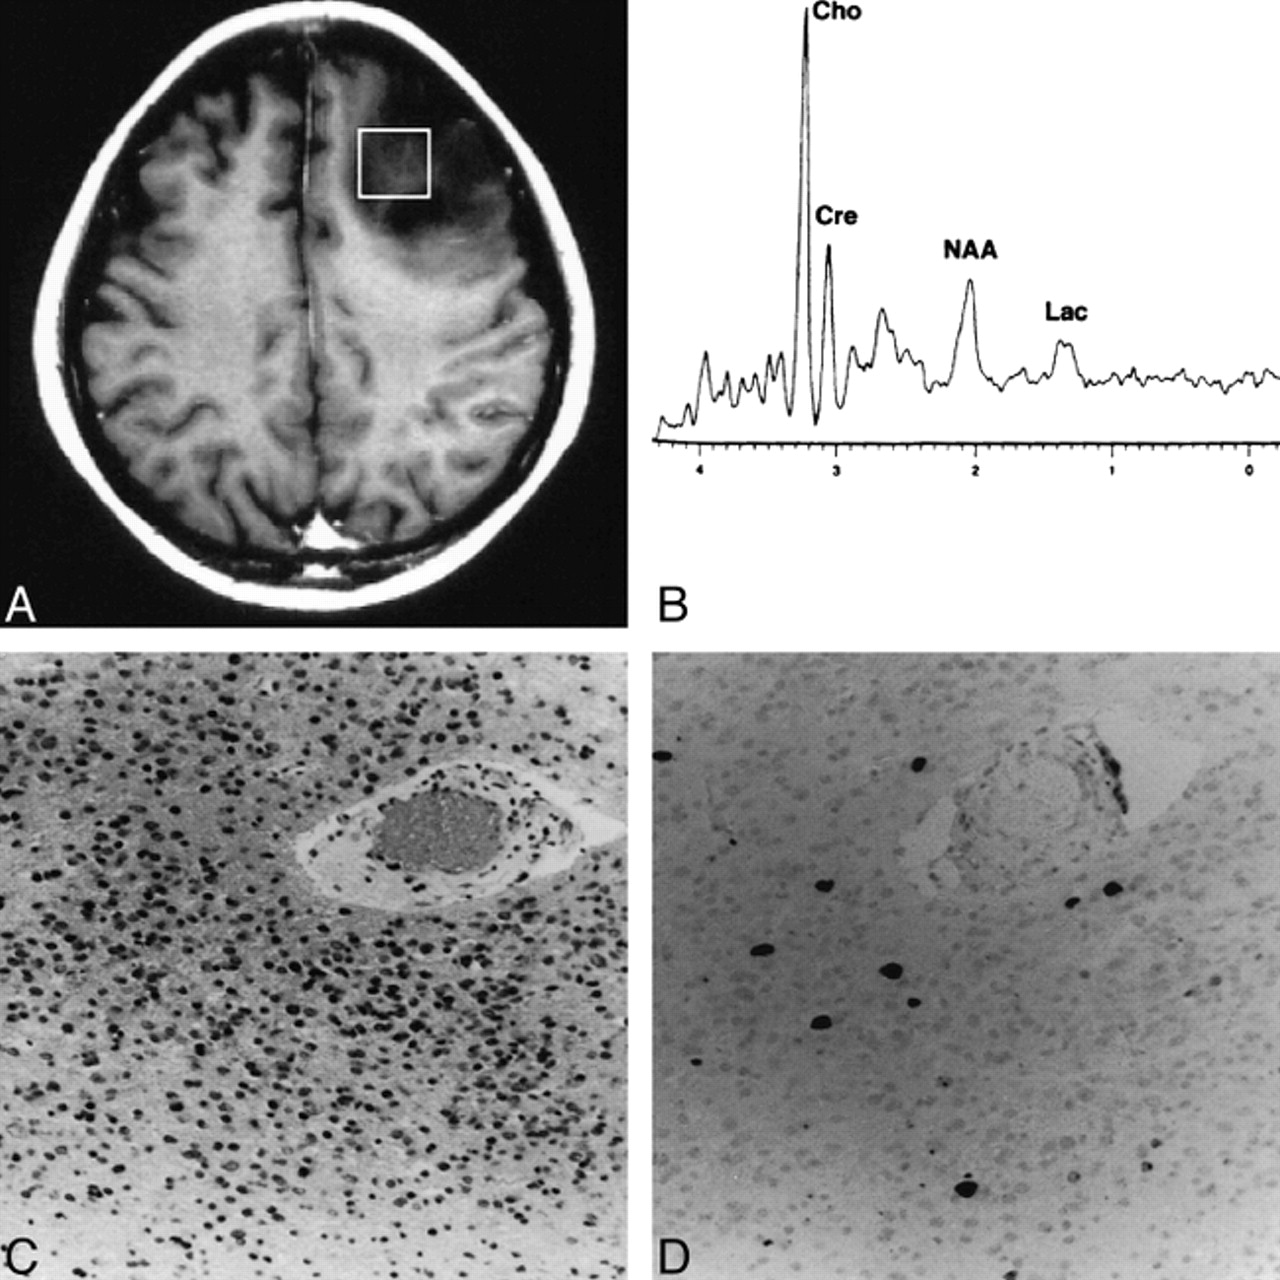
Figure 2 shows the findings in a typical case (case 11) in which the spectroscopic voxel was homogeneous without contrast enhancement. The Ki-67 labeling index was 3.10% and the Cho value was 2.06. Figure 3 shows two other examples of a similar MR imaging appearance in the spectroscopic voxel (cases 8 and 25). The spectroscopic voxel was homogeneous in case 25 and only faintly enhanced, although the tumor outside the voxel was heterogeneous.

Case 11: A typical case in which the spectroscopic voxel is homogeneous without contrast enhancement.
A, Contrast-enhanced T1-weighted MR image shows the spectroscopic voxel (square) filled with unenhanced homogeneous tumor.
B, Proton spectrum obtained from the region indicated in A shows a Cho value of 2.06.
C, Photomicrograph of the resected tumor indicates anaplastic astrocytoma (grade 3) (hematoxylin-eosin, original magnification ×100).
D, Photomicrograph of Ki-67 staining of the same tumor specimen shows a Ki-67 labeling index of 3.10% (original magnification ×100).

A and B, T1-weighted MR images of case 8 (A) and case 25 (B) in which the spectroscopic voxel is homogeneous and only faintly enhanced. The voxels for MR spectroscopy are indicated by squares. These contrast-enhanced images were obtained after spectroscopic examinations, and the location of the voxels was superimposed afterward. Note that in case 25, the tumor outside the voxel is heterogeneous
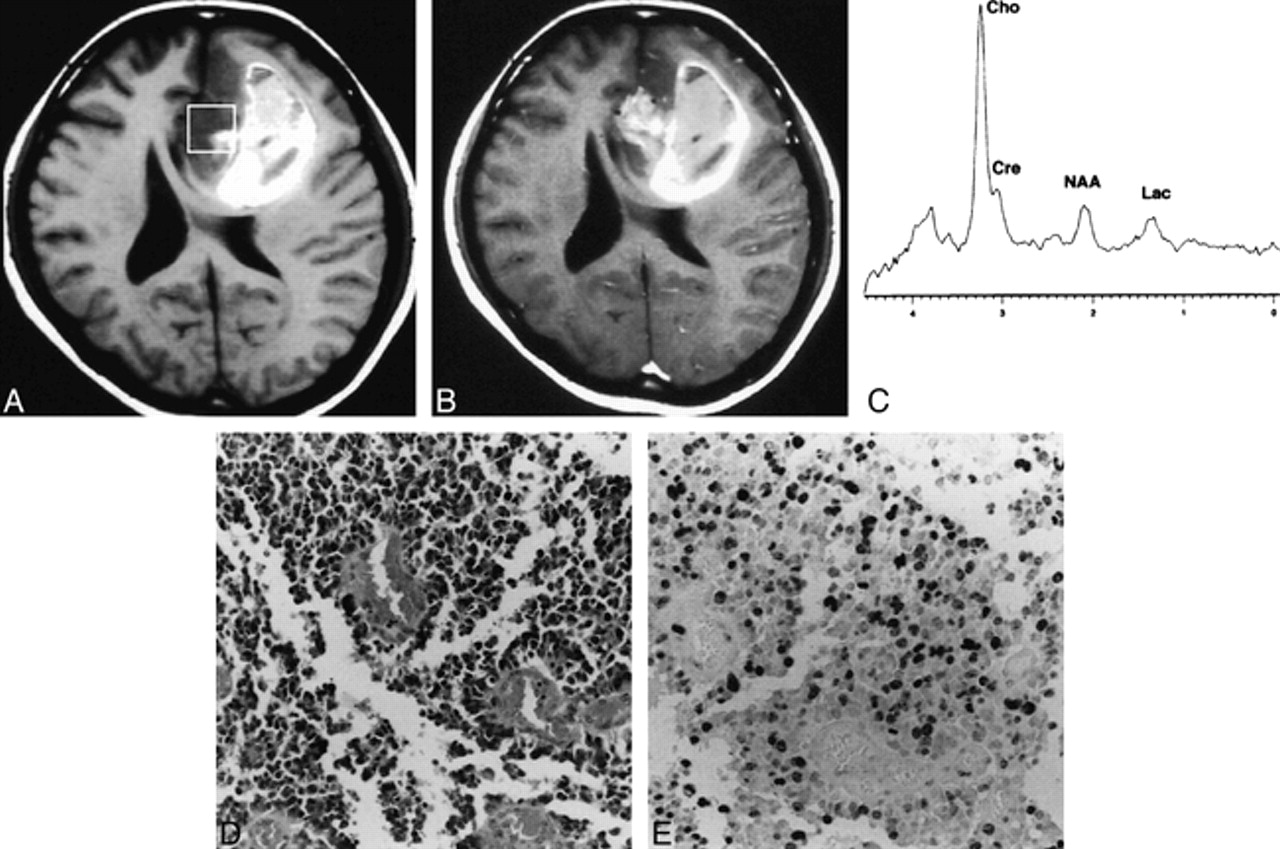
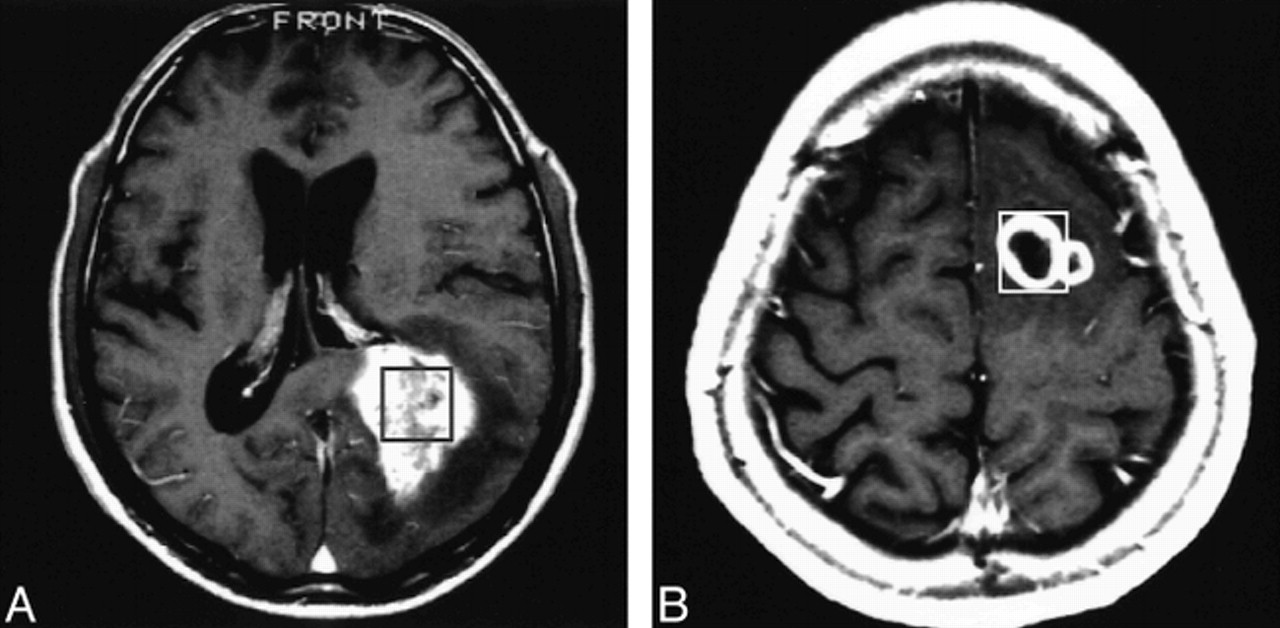
Figure 4 shows the findings in a typical case (case 18) in which the spectroscopic voxel was heterogeneous, including intratumoral hemorrhage, and showed heterogenous contrast enhancement. The Ki-67 labeling index was as high as 50.20% although the Cho value was only 5.21. Figure 5 shows two other cases with heterogeneous enhancement (cases 19 and 22). In these cases, the Ki-67 labeling index was more than 30%, although the Cho value was less than 3.5.

Case 18: A typical case in which the spectroscopic voxel is heterogeneous on MR images before and after contrast agent administration.
A, T1-weighted MR image shows the spectroscopic voxel (square) filled with heterogeneous tumor, including intratumoral hemorrhage appearing as a hyperintense area.
B, Contrast-enhanced T1-weighted MR image shows heterogeneous enhancement within the voxel.
C, Proton spectrum obtained from the region indicated in A shows a Cho value of 5.21.
D, Photomicrograph of the resected tumor indicates glioblastoma multiforme (grade 4) (hematoxylin-eosin, original magnification ×100).
E, Photomicrograph of Ki-67 staining of the same tumor specimen shows a Ki-67 labeling index of 50.20% (original magnification ×100).

A and B, Contrast-enhanced T1-weighted MR images of case 19 (A) and case 22 (B) in which the spectroscopic voxel appearance is heterogeneous. The voxels for MR spectroscopy are indicated by squares. These contrast-enhanced images were obtained after spectroscopic examination, and the location of the voxels was superimposed afterward
Discussion
The primary finding of the present study was the strong linear relationship between the Cho value and the Ki-67 labeling index when the spectroscopic voxel was homogeneous on plain MR images and showed no or faint enhancement after contrast administration. These tumors usually had a Ki-67 labeling index of less than 20%. In contrast, the Cho value did not correlate with the Ki-67 labeling index when the spectroscopic voxel had a heterogeneous appearance on MR images before or after contrast administration. The tumors usually had a Ki-67 labeling index of more than 20%. We speculate that these highly proliferative tumors contained cysts and microscopic or macroscopic necrosis or hemorrhage or all three findings, resulting in reduction of viable tumor cells within the spectroscopic voxels.
Initial studies of MR spectroscopy in brain tumors indicated the potential for noninvasive evaluation of metabolic changes in tumors and differential diagnosis and prediction of malignancy (12, 17, 21). Later studies demonstrated the metabolic characteristics of brain tumors, but mostly contradicted the utility of MR spectroscopy for predicting malignancy (13, 14, 20, 23). More recently, low- and high-grade gliomas or malignant tumors have been consistently depicted by spectroscopy (22, 24, 25). Review of these studies shows that at least two factors influenced the results. First, the tissue characteristics involved in the spectroscopic voxel must be reflected in the translation of spectra. The important factors are the part of the tumor that is included and whether and to what extent surrounding brain tissue is included. The importance of smaller voxels may be considered in the same context (30). Second, results of metabolic ratio analyses, such as Cho/Cr and Cho/NAA, may differ from those of individual metabolic analyses.
In the present study, we carefully localized the spectroscopic voxels, considering that homogeneity of the spectroscopic region of interest is important in determining the credibility of the spectroscopic results. Theoretically, smaller voxels are better than larger voxels as long as the spectral SNR is high enough. In practice, we determined the size of voxels as a result of a compromise between obtaining a higher SNR and sampling only the most homogeneous part of the tumor. We also used semiquantitative metabolic values. The clinical relevance of the present semiquantitative method has been described previously (26). This method has no compensation for T1 and T2 relaxation times, and absolute measurements are not possible. The method, however, requires only an extra few minutes over conventional MR spectroscopy, which is important for the examination of patients. Only one study has investigated absolute quantitative MR spectroscopy of brain tumors in vivo (31). A comparison of the results of absolute quantitative and semiquantitative methods should prove interesting.
Cases of en bloc tumor resection allow histologic examination of the specimen for Ki-67 labeling in the same region as the MR spectroscopic voxel. This, however, is not always possible, so we included the most representative or homogeneous part of the tumor for both spectroscopic and histologic examinations. Although this may not cause serious problems in entirely homogeneous tumors, discrepancies may have occurred between the spectroscopic voxels and histologic samples in heterogeneous tumors. An image-guided technique, which was not applied in the present study for the purpose of tissue sampling, would improve spatial correlation between the samples examined by MR spectroscopy and histologic examination.
Our results suggest that interpretation of the spectroscopic data from gliomas should begin with recognition of two subgroups, homogeneous and heterogeneous, for the spectroscopic voxel. Evaluation of the clinical significance of spectroscopic data requires the following stages. First, T1- and T2-weighted MR images should be carefully investigated to determine whether the spectroscopic voxel includes heterogeneous tumor. Second, the contrast enhancement pattern within the voxel should also be assessed as homogeneous or heterogeneous. Homogeneous tumors without heterogeneous enhancement indicate that the Cho value is a reliable predictor of proliferative activity. Otherwise, the Cho value tends to be underestimated. Heterogeneous tumors resulting from intratumoral cyst, necrosis, hematoma, and so on, indicate that the Cho value may no longer be reliable. All heterogeneous tumors in this study were malignant; therefore, the utility of the present technique would be more significant in predicting malignancy among homogeneous tumors. The Cho/Cr and Cho/NAA ratios provide the next most reliable predictor of proliferative activity (Ki-67 labeling index). These ratios may have a secondary role when the (semiquantitative) Cho value is not reliable.
This study suggests several directions for future investigations. MR spectroscopy was conducted before the administration of contrast material to avoid any influence on the metabolic signal intensities. T1- and T2-weighted MR images were carefully evaluated to locate the voxel within the assumed tumor body as far as possible. As our results indicate, however, prior knowledge of the pattern of enhancement may help to localize the spectroscopic voxel more properly and to understand the MR spectroscopic findings better. Therefore, clarification of the characteristics of MR spectroscopy after contrast agent administration is desirable. Also, a method to characterize tissue compartmentalization within the voxel is needed in addition to techniques for sampling smaller voxels. These developments may improve the evaluation of spectra from heterogeneous tumors. Clearly, measuring the semiquantitative Cho value to predict tumor proliferative activity has potential. Future studies may use an absolute quantitative method rather than the present semiquantitative method. Another methodological issue to be stressed in the present study is the use of single-voxel spectroscopy, which limited the spectroscopic investigation to only a part of the tumor. Two- or three-dimensional multivoxel methods may provide a more flexible way of comparing the spectroscopic and histologic findings.
Conclusion
The semiquantitative Cho value measured by MR spectroscopy is a reliable predictor of the proliferative activity of gliomas as measured by Ki-67 labeling when the spectroscopic voxel was homogeneous on plain MR images with absent, homogeneous, or faint contrast enhancement.
Footnotes
↵1 Address reprint requests to Hiroaki Shimizu, MD, Department of Neurosurgery, Kohnan Hospital, 4–20–1, Nagamachi-minami, Taihaku-ku, Sendai, 982–0012, Japan.
References
- Received August 5, 1999.
- Copyright © American Society of Neuroradiology
In this issue


Jump to section
Related Articles
Cited By...
- Impact of dietary intake on brain choline levels: A 3 Tesla magnetic resonance spectroscopy study
- CT Imaging Correlates of Genomic Expression for Oral Cavity Squamous Cell Carcinoma
- Multimodal Elucidation of Choline Metabolism in a Murine Glioma Model Using Magnetic Resonance Spectroscopy and 11C-Choline Positron Emission Tomography
- Magnetic resonance spectroscopy of the brain
- Multimodality Assessment of Brain Tumors and Tumor Recurrence
- Diagnostic performance of spectroscopic and perfusion MRI for distinction of brain tumors
- Noninvasive Magnetic Resonance Spectroscopic Imaging Biomarkers to Predict the Clinical Grade of Pediatric Brain Tumors
- NMR Spectroscopy and Pediatric Brain Tumors
- Tuning in on Tumor Activity with Proton MR Spectroscopy