
Abstract
BACKGROUND AND PURPOSE: We generated regional cerebral blood volume (rCBV) and regional cerebral blood flow (rCBF) studies from dynamic susceptibility contrast-enhanced MR images after an intravenous bolus injection of contrast agent (perfusion-weighted imaging [PWI]) by applying indicator dilution theory. We used a multishot echo-planar imaging (EPI) sequence to obtain adequate arterial input function (AIF). Our purpose was to compare the cerebral hemodynamics measured by PWI with the rCBF values and cerebral perfusion reserve obtained by xenon-133 single-photon emission CT (133Xe-SPECT).
METHODS: Eight patients with chronic internal carotid artery occlusion or stenosis were examined. PWI data were acquired using a multishot EPI sequence, and the AIF was determined automatically. Our procedure was based on indicator dilution theory and deconvolution analysis. To eliminate the effect of superficial vessels, the automatic threshold selection method was used.
RESULTS: AIF was adequate to generate rCBF and rCBV images. The rCBF and rCBV images by PWI were superior to 133Xe-SPECT scans in spatial resolution, and the rCBF values obtained by PWI correlated well with those obtained by 133Xe-SPECT. The regions with severely decreased perfusion reserve, which were determined by pre- and post-acetazolamide 133Xe-SPECT, showed significantly lower rCBF and higher rCBV by PWI than did regions with normal and moderately decreased perfusion reserve.
CONCLUSION: The rCBF and rCBV images generated by our procedure using PWI data appear to provide important clinical information for evaluating the degree of cerebral perfusion reserve impairment in patients with chronic ischemia.
Absolute regional cerebral blood volume (rCBV) and regional cerebral blood flow (rCBF) are important parameters for determining the management of patients with ischemic cerebrovascular disease (1–5). rCBV and rCBF values have been measured by positron emission tomography (PET) using labeled carbon monoxide or O-15 H2O (6, 7) and by single-photon emission CT (SPECT) using xenon-133 (8), N-isopropyl-p-(I-123)iodoamphetamine (9), 99mTc-hexamethylpropyleneamine oxime (10), or 99mTc-ethyl cysteinate dimer (11). PET can accurately portray rCBF or rCBV with reasonable resolution; however, PET is not widely used in the clinical setting because of its high cost and limited availability. Therefore, despite its relatively poor resolution, SPECT has been used to assess rCBF and rCBF reserve to help determine surgical indications in the clinical setting (12–14).
Conventional MR imaging techniques (T1-weighted, T2-weighted, and fluid-attenuated inversion recovery sequences) provide high-resolution and high-contrast anatomic information in patients with ischemic cerebrovascular disease. Perfusion-weighted imaging (PWI) (15–17), dynamic susceptibility contrast MR imaging after a bolus injection of intravascular contrast agent, has been used to calculate rCBV and rCBF. Recently, the clinical usefulness of PWI for depicting acute cerebral infarction has also been reported (18–20). Quantification of rCBF and rCBV can be done with PWI (referred to as rCBF-PWI and rCBV-PWI, respectively) by applying indicator dilution theory (21–26). However, to assess rCBF and rCBV, indicator dilution theory requires arterial concentration of the contrast agent as an arterial input function (AIF), which is a demanding and complicated process in the clinical setting. In this study, we used a multishot gradient-echo type echo-planar imaging (EPI) sequence for PWI, and the AIF was obtained automatically from the internal carotid artery (ICA). The generated rCBF and rCBV images using PWI data were compared with rCBF and with the percentage of CBF increase (% increase) after acetazolamide load using 133Xe-SPECT in patients with chronic ischemia and occlusive carotid disease.
Methods
Subjects
Eight patients (seven men and one woman, 55 to 69 years old; mean age, 63 years) with chronic ICA occlusion or stenosis were included in the study (Table). All patients underwent PWI and 133Xe-SPECT before and after acetazolamide administration within 1 month for preoperative evaluation of extracranial-intracranial (EC-IC) bypass surgery or carotid endarterectomy. Occlusive lesions of the ICA were confirmed by digital subtraction angiography in seven patients and by CT angiography in one patient.
Data for eight patients with occlusive carotid disease
Written informed consent was obtained from all patients after detailed explanation of the purpose of the study and scanning procedure.
Perfusion MR Imaging Protocol
PWI studies were performed on a 1.5-T MR unit using a multishot gradient-echo type EPI pulse sequence with parameters of 255–319/30 (TR/TE), a 35° to 40° flip angle, and an echo factor of 9. The acquisition matrix was 128 × 60 with a field of view of 23 × 17 cm, and the slice thickness was 6 mm. A 10-mL bolus of gadopentetate dimeglumine was injected through an antecubital vein with a 22-gauge cannula at a speed of 3 mL/s by an MR-compatible power injector, followed by 20 mL of saline. Forty to fifty dynamic images, covering four to six slices, were then obtained at a speed of 1.32 to 2.08 seconds. One slice included the cavernous portion of the ICA for obtaining the AIF, and other slices covered the cerebrum parallel to the anterior commissure-posterior commissure line.
Quantification of CBF and CBV
All PWI data were transferred to a postprocessing workstation, and quantitative rCBF-PWI and rCBV-PWI images were generated on a workstation using our proprietary software. The AIF was obtained automatically from the ICA contralateral to the occluded or severely stenosed ICA by fuzzy clustering (27).
In the first step, local changes in signal intensity during the bolus passage were computed pixel by pixel. For reduction of statistical noise, time-smoothing was performed using an averaging filter with a weight of [0.25, 0.5, 0.25]. The resulting signal-time curves were converted into concentration-time curves, assuming an exponential relationship between the relative signal reduction of S(t)/S0 and local concentration of contrast agent C(t):  where S0 denotes precontrast signal intensity; S(t) is the signal intensity at time, t, after injection of contrast agent; k is the tissue and field strength specific constant, and TE is the echo time (15).
According to the indicator dilution theory for intravascular contrast agent, when the AIF of the contrast agent entering the volume of interest (VOI) is known, CBF is implicitly given by  where CVOI(t) and CAIF(τ) are the time-dependent concentrations of contrast agent in the VOI and the AIF, respectively. The constant kh [ = (1−HLV)/(1−HSV)] is a correction constant for the difference in hematocrit of the large (HLV, approximately 0.45) and small (HSV, approximately 0.25) blood vessels of the brain. R(t) is the residue function, which is the relative amount of contrast agent in the VOI in an idealized perfusion experiment, in which a unit area bolus is instantaneously injected [R(0) = 1] and subsequently washed out [R(∞) = 0] by the perfusion. It is known from Equation 2 that the initial height of the deconvoluted time-concentration curve, that is, the tissue impulse response function h(t) [= CBF × R(t)] equals the CBF.
There are various approaches for calculating h(t) from Equation 2 by deconvolution. In this study, we adopted an algebraic approach based on singular value decomposition, which is robust against statistical noise. This approach was described in detail by Ostergaard et al (24). We generated the rCBF-PWI images by applying this approach pixel by pixel as follows:  where h(0) is the initial height of h(t) and K is a constant. The rCBV-PWI images were generated from
The K value in Equations 3 and 4 was determined by substituting 22 mL/100 g per minute for the CBF value of the white matter of the nonocclusive side (6, 7).
Because the superficial veins were prominent in the rCBF-PWI and rCBV-PWI images owing to the fact that the gradient-echo images were sensitive to the presence of large vessels (28, 29), we eliminated superficial vessels by using the automatic threshold selection method. First, we generated the gray-level histograms of the above images and considered two classes, classes 1 and 2, which were the pixels with and without superficial vessels, respectively. The optimal threshold value for discriminating these two classes was determined such that the following discriminant criterion measure, λ, was maximized:  where
where  and
and  are given by
  respectively. P1, P2, μ1, μ2, σ1, and σ2 denote the probability of occurrence in class 1, the probability of occurrence in class 2, the class mean level in class 1, the class mean level in class 2, the class variance in class 1, and the class variance in class 2, respectively (30).
SPECT Protocol
133Xe-SPECT was performed with a SPECT 2000H scanner. Patients inhaled 1.85 to 3.7 GBq of xenon-133 gas and CBF was measured according to the Kanno-Lassen method using dynamic SPECT data (16 scans with a duration of 20 seconds each) (31). The arterial input curve of xenon-133 was estimated from the end-expiratory xenon-133 concentration curve observed by a single NaI detector. The rCBF measurement by SPECT (rCBF-SPECT) was performed at rest (pre-rCBF); then, 15 minutes after intravenous administration of 1 g acetazolamide, a post-acetazolamide rCBF study (post-rCBF) was performed in the same manner (14). Cerebral perfusion reserve was evaluated by the % increase of CBF after acetazolamide as follows: % increase = [(post-rCBF) − (pre-rCBF)]/(pre-rCBF) × 100.
Data Analysis
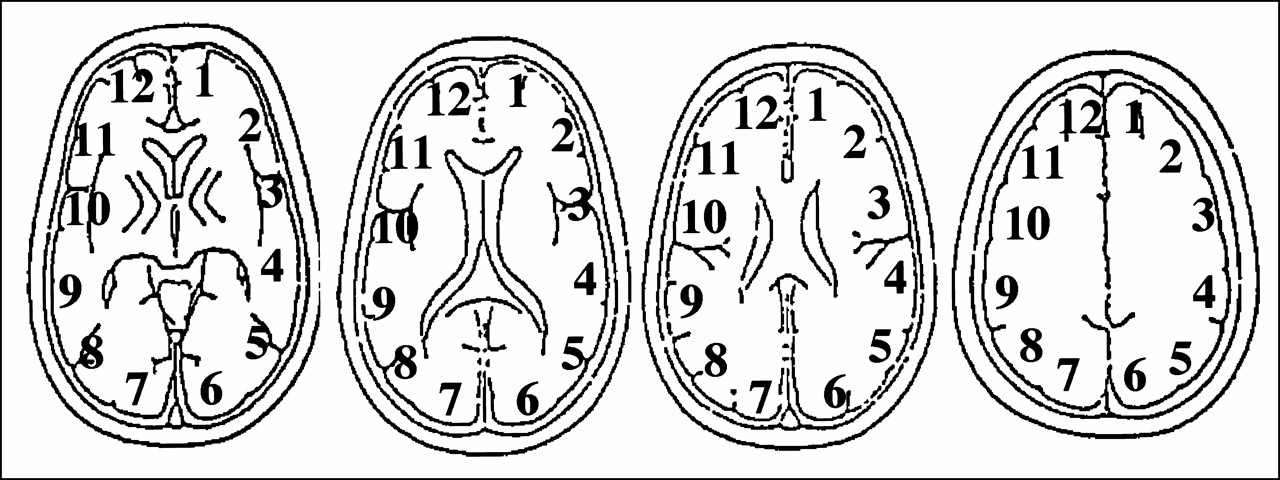
We analyzed four tomographic planes of the basal ganglia through the centrum semiovale on 133Xe-SPECT scans. On each imaging plane, regions of interest (ROIs) were placed on the cerebral cortex corresponding approximately to the territory of the anterior cerebral artery (ACA), anterior border zone (ABZ), middle cerebral artery (MCA), posterior border zone (PBZ), and posterior cerebral artery (PCA) of each hemisphere (Fig 1). On rCBF- and rCBV-PWI, ROIs were obtained from two to four slices, corresponding to Figure 1, for each patient. Mean CBF and CBV values in the ACA, ABZ, MCA, PBZ, and PCA were calculated from the corresponding ROIs in each hemisphere. The ROI setting was consistent between 133Xe-SPECT and PWI. In all, 80 regions in eight patients were obtained, and two regions of complete infarction were excluded. Thus, 78 regions were analyzed in the current study.

ROIs used for the analysis of cerebral perfusion. ROIs were placed on six regions in the brain parenchyma of each hemisphere. The ROIs were obtained from four slices on 133Xe-SPECT scans and from two to four slices from PWI images. ROI 1 corresponded to the left ACA territory, ROI 2 to the left ABZ territory, ROIs 3 and 4 to the left MCA territory, ROI 5 to the left PBZ territory, and ROI 6 to the left PCA territory. ROIs 7 through 12 corresponded to the same territories in the right hemisphere. The ROI setting was consistent between 133Xe-SPECT and PWI. Data from 10 regions were obtained for each patient
The relationship between rCBF-PWI and rCBF-SPECT was evaluated using linear regression analysis. We classified the degree of perfusion reserve into three grades by the value of % increase (32): severely decreased perfusion reserve (% increase ≤ 0%; n = 10), moderately decreased perfusion reserve (0 < % increase ≤ 15%; n = 16), and normal perfusion reserve (15% < % increase; n = 52). The rCBF-SPECT, rCBF-PWI, and rCBV-PWI findings for the three groups of perfusion reserve were compared by means of analysis of variance followed by the Mann-Whitney U-test. A P value of less than .05 was considered significant.
Results
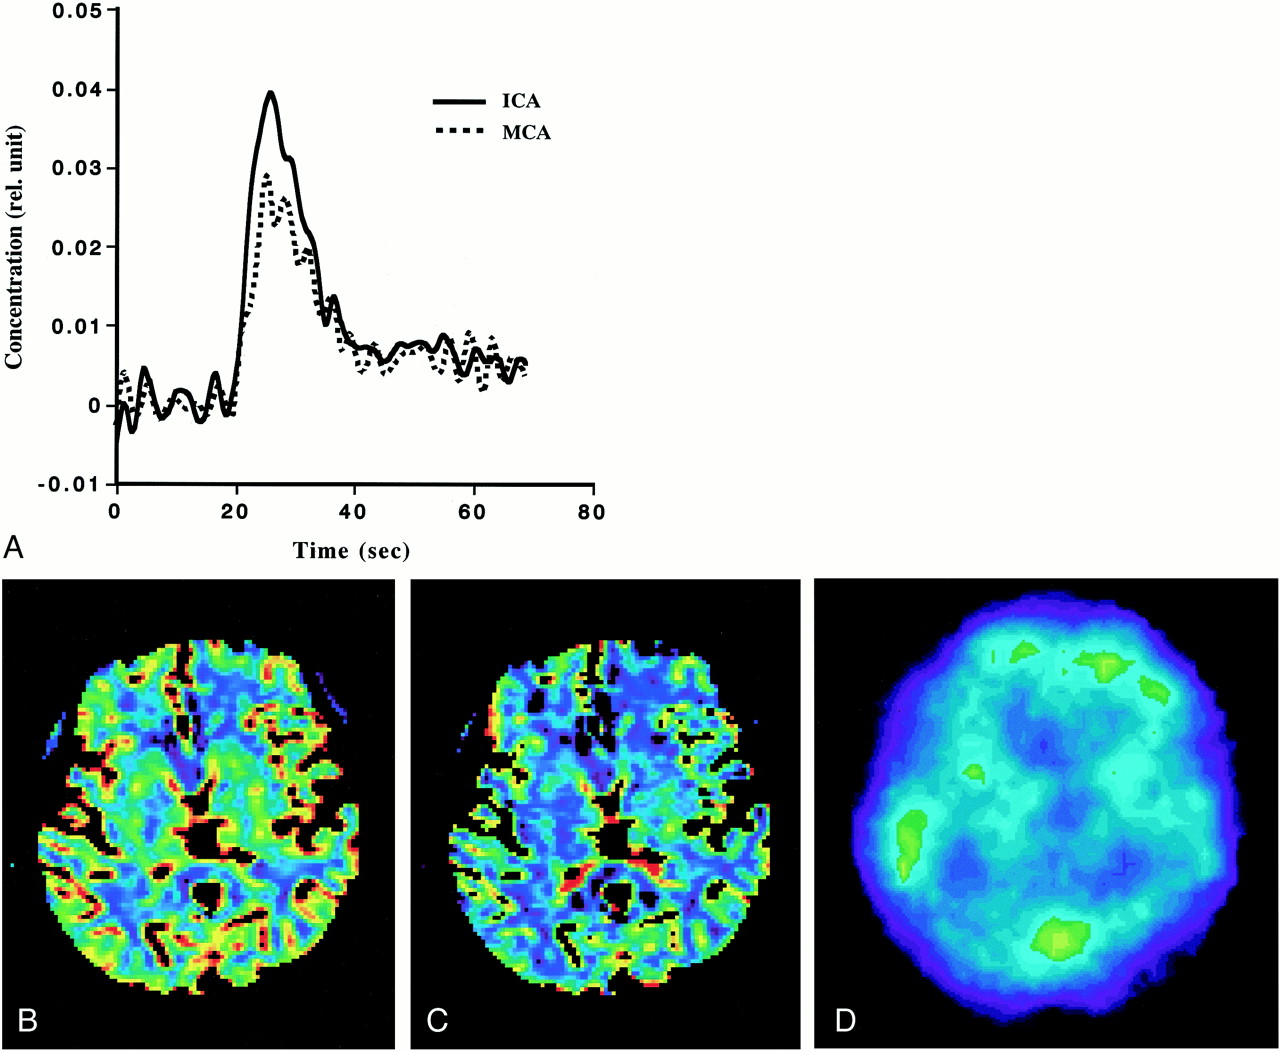
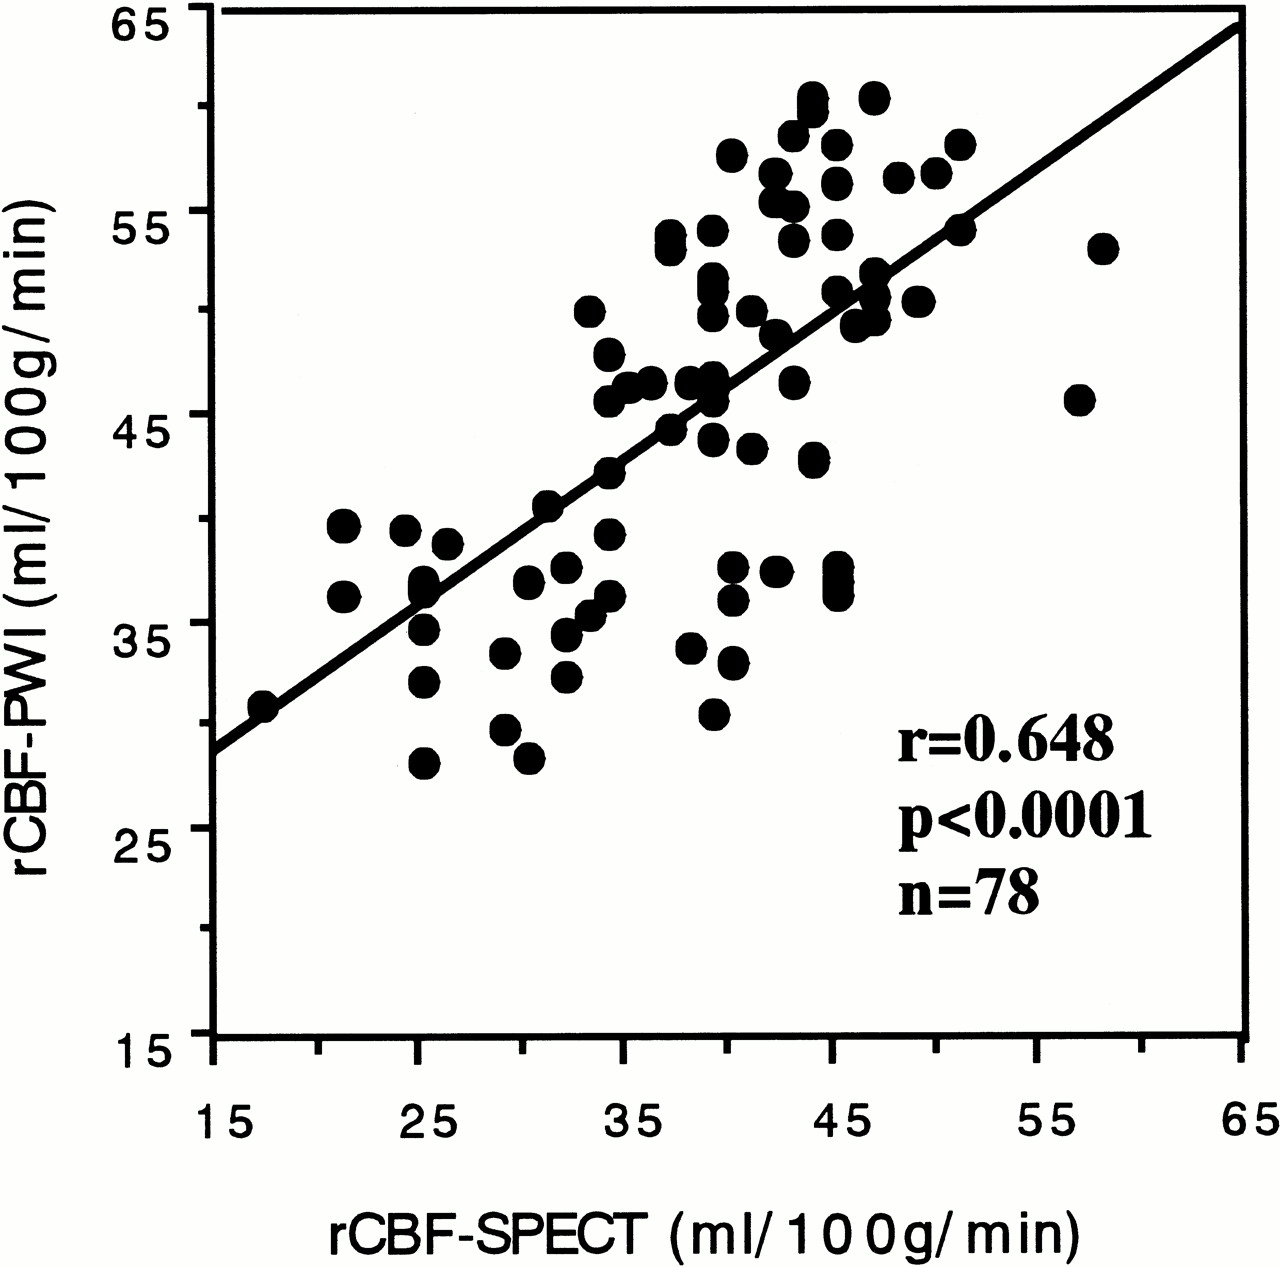
Adequate AIF was obtained from the ICA to generate rCBF-PWI and rCBV-PWI studies for all patients, regardless of the existence of occlusive carotid disease. Figure 2A shows a comparison of the AIFs obtained from the ICA and MCA in patient 7 (see Table). Note that their shapes vary slightly, and that the AIF obtained from the ICA was somewhat better than that from the MCA. Figure 2B and C shows an example of the rCBF-PWI and rCBV-PWI scans from the same patient. The generated rCBF-PWI and rCBV-PWI studies were superior to the 133Xe-SPECT study in spatial resolution, providing quantitative values (Fig 2B–D). The rCBF and rCBV values were also obtained by placing the ROI on the images. Using the rCBF-PWI and rCBV-PWI studies, we could evaluate deep brain structures, such as the basal ganglia, that are potentially difficult to evaluate by 133Xe-SPECT owing to the low energy of xenon-133. Figure 3 shows the relationship between rCBF-PWI and rCBF-SPECT, for which we found a significant correlation (r = .648, n = 78; P < .0001).

Example of PWI and 133Xe-SPECT studies in patient 7.
A, Comparison of the AIFs obtained from the ICA and MCA. Note that they vary slightly and that the AIF from the ICA is somewhat better than that from the MCA.
B, rCBF image generated from PWI (rCBF-PWI).
C, rCBV image generated from PWI (rCBV-PWI).
D, 133Xe-SPECT scan. Note that images generated from PWI were superior to 133Xe-SPECT scan in spatial resolution, and that rCBF and rCBV values in the deep brain structure can be evaluated on rCBF-PWI and rCBV-PWI images.

Relationship between the rCBF values obtained from 133Xe-SPECT (rCBF-SPECT) and those obtained PWI (rCBF-PWI). A significant correlation was found between them (r = .648, P < .0001, n = 78)
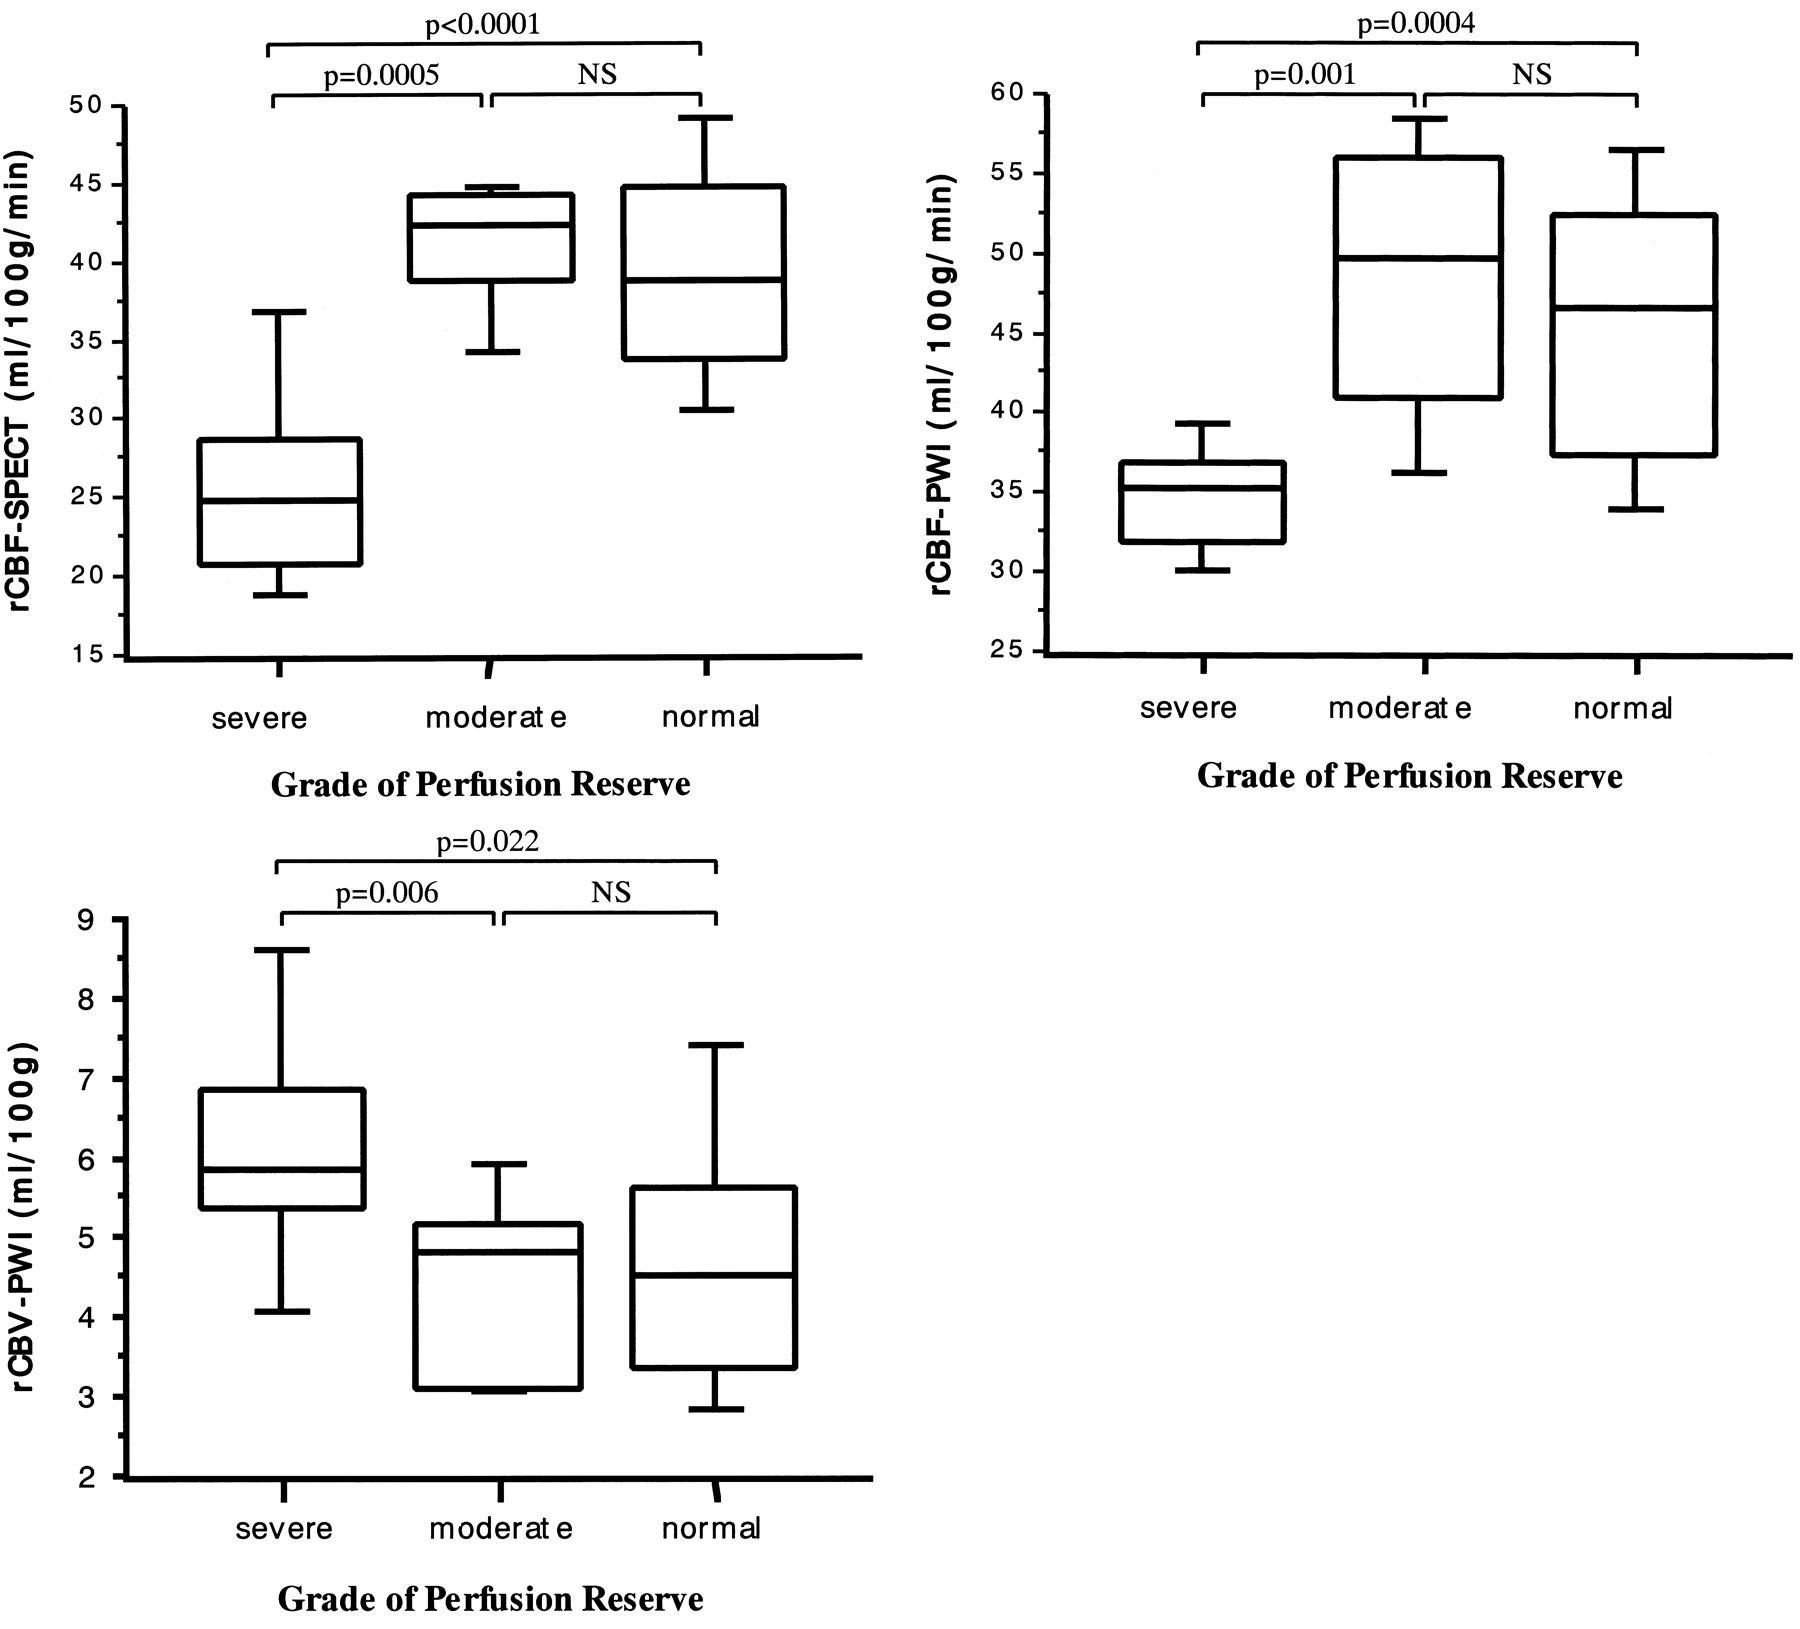
In the region with severely decreased perfusion reserve, rCBF-SPECT was significantly lower than it was in the regions of moderately decreased or normal perfusion reserve (P = .0005 and P < .0001, respectively) (Fig 4A). Similarly, the regions with severely decreased perfusion reserve showed significantly lower rCBF-PWI than did the regions with moderately decreased or normal perfusion reserve (P = .001 and P = .0004, respectively) (Fig 4B). In contrast, significantly higher rCBV-PWI values were found in regions of severely decreased perfusion reserve relative to the values in regions of moderately decreased or normal perfusion reserve (P = .006 and P = .022, respectively) (Fig 4C). No significant differences in rCBF-SPECT, rCBF-PWI, and rCBV-PWI were found between regions of moderately decreased and normal perfusion reserve (Fig 4A–C).

A–C, Box-and-whisker plot of rCBF-SPECT (A), rCBF-PWI (B), and rCBV-PWI (C) in the regions with severely decreased (% increase ≤ 0%), moderately decreased (0 < % increase ≤ 15%), and normal (15% < % increase) perfusion reserve. % increase was defined as [(post-rCBF) − (pre-rCBF)]/(pre-rCBF) × 100, where pre-rCBF and post-rCBF denote the CBF values before and after acetazolamide CBF as measured on 133Xe-SPECT scans, respectively. Boxes represent 25% to 70% range with bisecting lines showing medium values; horizontal lines represent 10% to 90% range; NS indicates not significant. Note that the regions with severely decreased perfusion reserve show significantly lower rCBF values on 133Xe-SPECT (A) and rCBF-PWI (B) studies than do those with moderately decreased or normal perfusion reserve. They also show significantly higher rCBV values on rCBV-PWI study (C) than do those with moderately decreased or normal perfusion reserve.
Discussion
PWI, which shows the kinetics of a rapid bolus of paramagnetic contrast agent on serial T2*-weighted MR images, has been used to calculate rCBV and rCBF. In an early PWI study, single-slice dynamic susceptibility contrast-enhanced MR imaging with a gradient field-echo sequence was used, but this technique could not determine the AIF, since the ICA and MCA were not included in the slice imaged (33). Thus, PWI has been used only for estimating the relative values of rCBF and rCBV by calculating the area under the time-concentration curves. Although the relative values of hemodynamic parameters are informative for clinical use (20), quantification of rCBF and rCBV would be of greater value in making decisions for patient care. Recently, technical advances in MR equipment have enabled the use of multislice EPI sequences, making it possible to determine AIF from the ICA or MCA. In some studies, the AIF has been obtained from the ICA when PWI was performed using half-Fourier single-shot turbo spin-echo sequences (21), dual gradient-echo multishot EPI sequences (22), and dual fast low-angle shot sequences (23). It was also been reported that AIF has been obtained from the MCA by using the single-shot EPI sequence (25, 26, 34). To our knowledge, it has not been concluded which artery is more suitable for extraction of AIF.
We compared the AIFs obtained from the ICA and MCA, as shown in Figure 2A, and although we did not find a large difference between them, the AIF obtained from the ICA was, in general, somewhat better than that from the MCA. We therefore used the AIF from the ICA for deconvolution analysis in this study.
Because the gradient-echo sequence is sensitive to large vessels, the large vessels tend to appear prominently on the brain surface on the PWI studies obtained by using the standard procedure. Ernst et al (28) described a procedure for eliminating larger vessels by using a threshold determined simply by 2.5 times the median of all rCBF values. In this study, we tried to eliminate superficial vessels objectively by using the sophisticated automatic threshold selection method based on the procedure reported by Otsu (30). The rCBF-PWI and rCBV-PWI studies with elimination of superficial vessels were validated by visual analysis, allowing us to measure rCBF and rCBV without incurring contamination from superficial vessels.
There are some limitations to our method. Ostergaard et al (26) reported that the K value in Equations 3 and 4 was 1.09 for pigs and 0.87 for human volunteers (25) for absolute quantification of rCBF. In our study, however, we could not find the K value suitable for absolute quantification. Thus, instead of taking the K value constant, we calculated it by substituting 22 mL/100 g per minute for the CBF value in the white matter despite the presence of ischemia. One reason why we could not obtain a suitable K value may be that our subjects were older than those in the study by Ostergaard et al (26) and that they had occlusive carotic diseases. Another reason may be that the temporal resolution of our imaging sequence was inferior to that obtained by the previous investigators. Although our method might not be quantitative for these reasons, we believe that it is clinically useful, because the rCBF values we obtained correlated well with those from the 133Xe-SPECT data (Fig 3). Additionally, we could not register the PWI and SPECT studies, since the spatial resolution of 133Xe-SPECT scans is quite inferior to that of PWI images. Thus, a point-to-point correlation between rCBF and rCBV values was not carried out. The rCBF or rCBV value was calculated and evaluated for each ACA, ABZ, MCA, PBZ, and PCA territory. Because we evaluated each territory separately, we believe that the spatial difference did not influence our results.
Gadopentetate dimeglumine is not a diffusible tracer and cannot pass through the blood-brain barrier, unlike xenon-133. PWI is probably sensitive to the total blood component in the measured tissue, including that of the arterioles and venules (29). Although the principal of CBF measurement for PWI is different from that for xenon-133, and there are some limitations to our method, as described above, the rCBF values obtained with the two procedures were well correlated (Fig 3). The rCBF-PWI and rCBV-PWI studies, with quantitative values, were superior to the 133Xe-SPECT scans in spatial resolution (Fig 2). The rCBF-PWI and rCBV-PWI studies could be used to evaluate hemodynamic changes, even in deep brain structures.
As shown in Figure 4, the regions with severely decreased perfusion reserve had significantly lower rCBF-SPECT and rCBF-PWI values and higher rCBV-PWI values than did the regions with moderately decreased or normal perfusion reserve. However, the number of patients included in this study may be too few to establish excellent statistical validation.
The high rCBV values found in the regions with severely decreased perfusion reserve were probably the result of maximal vasodilatation due to reduced cerebral perfusion pressure (CPP). These findings support the results obtained with PET studies (1–5). It is well known that when local CPP falls, cerebrovascular autoregulation occurs and precapillary resistance vessels dilate. This causes an increase in local CBV for maintaining local CBF. When compensatory vasodilatation is maximal, the autoregulation limit is reached, and a further decrease in local CPP will lead to a decrease in CBF. Additionally, the region in which a response against CO2 disappeared showed an increased oxygen extraction rate (OER) in PET studies. The regions with decreased CBF and increased OER were reported as areas of misery perfusion and as good candidates for EC-IC bypass surgery. The phenomenon of a disappearing CO2 response is comparable to that of a severely decreased acetazolamide response (% increase = 0%) in our study. Our results indicate that a combination of rCBF-PWI and rCBV-PWI can be used to depict the region with decreased CPP, and may suggest the area of misery perfusion. PWI may provide important clinical information for evaluating the degree of cerebral perfusion reserve impairment.
MR contrast agents are not radioactive and are relatively inexpensive as compared with tracers used in PET and SPECT studies. Furthermore, the additional scan time required to obtain PWI measurements is less than 2 minutes, and PWI can record rCBF and rCBV values simultaneously by a single acquisition without acetazolamide. PWI has some advantages over 133Xe-SPECT in these respects when evaluating brain perfusion.
Conclusion
The multishot EPI sequence and automatic threshold selection procedure we used provides quantitative rCBF-PWI and rCBV-PWI studies from dynamic susceptibility contrast-enhanced MR images. The rCBF-PWI and rCBV-PWI studies generated simultaneously by our method appear to contribute clinically useful information for evaluating brain perfusion in patients with chronic ischemia.
Footnotes
↵1 Address reprint requests to Keiichi Kikuchi, MD, Department of Radiology, Ehime University School of Medicine, Shitsukawa, Shigenobu-cho, Onsen-gun, Ehime, 791-0295 Japan.
References
- Received February 21, 2000.
- Copyright © American Society of Neuroradiology
In this issue


Jump to section
Related Articles
Cited By...
- Computed tomography perfusion parameters predictive of symptomatic intracranial hemorrhage after mechanical thrombectomy in patients with cerebral large vessel occlusion
- Progressive changes in cerebral perfusion after carotid stenting: a dynamic susceptibility contrast perfusion weighted imaging study
- Elevated Cerebral Blood Volume Contributes to Increased FLAIR Signal in the Cerebral Sulci of Propofol-Sedated Children
- Blood Pressure and Vascular Dysfunction Underlie Elevated Cerebral Blood Flow in Systemic Lupus Erythematosus
- Vasodilatory Capacity of the Cerebral Vasculature in Patients with Carotid Artery Stenosis
- Reporting standards for angioplasty and stent-assisted angioplasty for intracranial atherosclerosis
- Elevated Cerebral Blood Flow and Volume in Systemic Lupus Measured by Dynamic Susceptibility Contrast Magnetic Resonance Imaging
- Reporting Standards for Angioplasty and Stent-Assisted Angioplasty for Intracranial Atherosclerosis
- Simple Assessment of Cerebral Hemodynamics Using Single-Slab 3D Time-of-Flight MR Angiography in Patients with Cervical Internal Carotid Artery Steno-Occlusive Diseases: Comparison with Quantitative Perfusion Single-Photon Emission CT
- Quantitative Assessment of Cerebral Hemodynamics Using Perfusion-Weighted MRI in Patients With Major Cerebral Artery Occlusive Disease: Comparison With Positron Emission Tomography
- Cerebral Hemodynamic Evaluation Using Perfusion-Weighted Magnetic Resonance Imaging: Comparison With Positron Emission Tomography Values in Chronic Occlusive Carotid Disease
- Quantitative Measurement of Regional Cerebrovascular Reactivity to Acetazolamide Using 123I-N-Isopropyl-p-Iodoamphetamine Autoradiography with SPECT: Validation Study Using H215O with PET
- Usefulness of Brain SPECT to Evaluate Brain Tolerance and Hemodynamic Changes During Temporary Balloon Occlusion Test and After Permanent Carotid Occlusion