
Abstract
BACKGROUND AND PURPOSE: MR-based volumetric measures of cerebral structures are increasingly used for diagnostic purposes and to measure progression of atrophy. Variations in individual head size may be corrected by normalization with use of a total intracranial volume (TIV) measurement. The TIV also may be used to correct for voxel size fluctuations in serial studies. The TIV should be measured from the same images used for structural volumetry, usually T1-weighted imaging. The objectives were to show that normalization with TIV reduces interindividual variation, to develop and validate a simple protocol for measuring TIV from T1-weighted MR images, and to apply TIV normalization to serial brain measures in controls and subjects with Alzheimer disease (AD).
METHODS: We measured TIV with a semiautomated segmentation technique on T1- and T2-weighted MR images in 55 controls, 10 AD patients, and two persons at risk of familial AD. Whole-brain volumes also were measured and normalized with TIVs.
RESULTS: The TIV normalization of cross-sectional brain volumes significantly reduced interindividual variation; the coefficient of variation (CV) was reduced from 10.0% to 6.0% in controls (P < .001). The TIVs measured on T1-weighted images had low variability (CV, 0.16%) and did not differ significantly from those measured on T2-weighted images (P = .16). The TIV normalization of serial brain-volume measurements reduced interimage differences caused by voxel-scaling variations (CV reduced from 1.3% to 0.5%, P = .002) in 10 controls and five AD patients.
CONCLUSION: Structural volumes should be normalized with a TIV, measured cross-sectionally, to reduce interindividual variation, and longitudinally with a concurrent measurement, to reduce subtle interimage differences. This may have important implications in progression studies.
MR imaging has made it possible to attempt accurate, in vivo volumetric measurements of whole brain and substructures. These measurements are increasingly being considered as diagnostic measures in many diseases, eg, hippocampal volumes in Alzheimer disease (AD) and epilepsy (1–4). However, cross-sectional brain-volume measures may be confounded by interindividual variation in head size.
Measures of rates of atrophy from serial MR images also have been proposed as diagnostic markers and, more recently, as surrogate markers of disease progression for therapeutic trials in diseases such as AD and multiple sclerosis (5–11). Longitudinal studies avoid the problem of wide interindividual variation in head size by measuring changes over time in an individual's cerebral volume. However, because the rates of change in brain volumes may be relatively small, even in diseases such as AD (12), these longitudinal studies are very sensitive to subtle differences in acquisition.
Several sources of error may be introduced in the measurement of volume change derived from an individual's serial images. These include differences in the amount of movement artifact, alterations in magnetic-field inhomogeneity (13), machine-dependent image-to-image variation in MR image intensity scales (14), and, importantly, voxel size variations due to drifts in imager calibration. The latter source of error may not be obvious on simple inspection but may lead to artifactual changes in the measured volumes of cerebral structures. Freeborough et al (15) confirmed that significant inconsistencies in voxel size exist between serial images, even on modern machines, with voxel changes producing an apparent artifactual “stretching” of the brain and cranium even over short intervals. These intraindividual variations in cerebral volume are underrecognized and are an important potential source of error in progression studies or therapeutic trials. Errors related to drifts in voxel size become more relevant as other sources of artifact (movement artifact, inhomogeneity, etc) are reduced.
Measuring total intracranial volume (TIV) allows whole-brain and regional volumetric measures to be normalized for head size. The TIV can be defined as the volume within the cranium, including the brain, meninges, and CSF. We hypothesized that it also could be used to control for variations in voxel size over time. This hypothesis assumes that 1) the TIV is unaltered by the disease process, and 2) total or regional brain volumes are more comparable when normalized for TIV. In degenerative diseases, where the whole brain is subject to atrophy, the TIV may provide the best available estimate of premorbid brain volume.
Generally, T2-weighted images have been used to measure TIV (16–18) because the high signal intensity of CSF makes identification of the TIV surface relatively easy. Some studies have used simple estimates of size that correlate with the TIV (eg, intracranial width or cross-sectional area) (19, 20), but these measures cannot account satisfactorily for the great difference between individuals in head shape, and measurement reproducibility depends on the choice of position and plane of view. The TIV measure ideally should be performed on the same acquisition used to calculate the brain volumes; this will minimize imaging time and ensure that brain and TIV measures are affected systematically by any image-acquisition factors. In contemporary structural imaging, this usually means measuring TIV from a T1-weighted volumetric image. It also allows retrospective normalization of brain volume in patients lacking a T2-weighted image. The TIV may be used to normalize volumes either by simple division, as in this study, or by using the covariance method (21).
In this study, we aimed first to show that TIV normalization of cross-sectional brain volumes can reduce individual variation, then to develop a TIV measure on a T1-weighted image and validate it against the existing T2-weighted TIV. We also wished to assess fluctuations in intraindividual structural volumes on serial images that could reflect imager-acquisition differences and show that normalization of every image by a T1-weighted TIV can reduce such differences.
Methods
Subjects
Twenty-four male and 31 female controls with an age range of 23–83 years underwent cross-sectional MR imaging measurements. These clinically healthy subjects were recruited from the spouses of patients and healthy volunteers. They had no complaints of cognitive impairment and had a Mini-Mental State Examination (MMSE) score (≥27–30. History of stroke, prior dementia, and other overt cerebral pathology were exclusion criteria, but otherwise the subjects were unselected. Ten patients with probable AD, according to the NINCDS-ADRDA criteria (22), underwent identical MR measurements on serial imaging, five had interimage intervals of 1 year (mean MMSE score decreased from 22.4 ± 5.3 to 17.0 ± 6.7 over this period), and five had intervals of only 2–4 weeks (mean MMSE 17.2 ± 2.8 at baseline). These were analyzed with 10 of the healthy controls who had three serial images. In addition, two persons at risk of familial AD had serial MR imaging with over eight images spanning at least 7 years. One of these people remains well and has since been shown not to carry a pathogenic mutation, whereas the other carries a mutation and has become clinically affected by AD.
All subjects gave their consent for MR imaging and for participation in longitudinal research studies, approved by the local research ethics committee.
MR Acquisition
The T1-weighted volumetric MR images were acquired on a 1.5-T Signa unit (General Electric Medical systems, Milwaukee, WI) using a spoiled gradient-echo technique (matrix 256 ×128 ×128; field of view [FOV], 24 ×24 ×19.2 cm; TR/TE/excitation, 35/5/1; flip angle, 35°), yielding 124 contiguous, 1.5-mm-thick coronal slices. In-plane voxel dimensions were 0.9375 × 0.9375 mm. Axial dual-echo images also were acquired (2000/30 + 90/2) yielding about 44 5-mm sections with 2.5-mm intersection spacing and in-plane voxel dimensions of 0.9375 × 0.9375 mm.
Image Analysis
All measurements were performed with MIDAS image-analysis software (23). This program allows simultaneous image viewing and outlining of regions in coronal, sagittal, and axial orientations. All segmentations used intensity thresholding with thresholds set empirically as fixed fractions of mean brain intensity or intracranial intensity. This approach requires consistency in image acquisition and is affected by acquisition problems such as movement artifact or RF inhomogeneity (“shading”) artifact. All images analyzed for this study were relatively free of such artifacts. Many methods exist for post-acquisition correction of heterogeneity artifact, but these were not used in this study (24). Images with very large movement-artifact problems were excluded. All measurements were performed while blinded to subject details and the results of any other measurements.
Brain Segmentation
Whole-brain volumes were obtained from the T1-weighted volumetric imaging, using a semiautomated, iterative 3D morphologic technique as previously described (23). This technique includes a consistent CSF-brain intensity threshold set at 60% of mean brain intensity. Every slice between the inferior limit of segmentation, set at the lowest point of the cerebellum, and the superior point of the cortex was measured. Brain segmentations were performed on all controls and AD patients and manually checked and edited to ensure accuracy.
TIV Measured on T2-Weighted Images
This measure of TIV uses the T2-weighted images and has been described in detail (16). The inner boundary of the calvaria is outlined with a semiautomatic gray level thresholding technique with a standard threshold set to 60% of the mean intracranial signal intensity. The inferior limit of segmentation is set as the lowest slice in which cerebellar tissue is present. The T2-weighted TIVs were measured in the control group and in five AD patients, at a single time point.
TIV Measured on T1-Weighted Images
The TIV measure we employed uses T1-weighted volumetric images put into the orientation defined by the Montreal Neurological Institute 305 brain average (25) using 3D registration. The method used to delineate the TIV is analogous to that described above, except the semiautomatic gray level thresholding technique was set at a standard threshold of 33% of the mean intracranial signal intensity to outline the outer border of dura (Fig 1A); this reflects the different contrast in the T1-weighted image compared with the T2-weighted image. Every 10th axial section was segmented with the inferior border set as the lowest section in which cerebellar tissue was present (Fig 1B). Linear interpolation of areas was used to obtain an estimate of the TIV from the segmented sections. This method is supported by Eritaia et al (26), who evaluated various sampling strategies to measure a TIV from T1-weighted images and concluded that the TIV can be confidently traced by using a 1-in-10 section strategy without significant loss of accuracy. The T1-weighted TIVs were initially measured on two serial images from a group of five AD patients and five controls, to compare with the T2-weighted TIVs and to look for variability over serial images. The T1-weighted TIVs and brain volumes then were measured on multiple serial images of five AD patients with short imaging intervals, 10 controls, and the two people at risk of familial AD.

T1-weighted MR images with sagittal and axial views. The intensity windowing is as used for segmentation. The TIV is calculated by summation and linear interpolation of the segmented axial slices.
A, The total intracranial area is shown on one axial section.
B, The axial sections used to sample the total intracranial volume are marked on the sagittal view.
Reproducibility
To evaluate the intrarater reproducibility, the same rater repeated the brain and TIV measurements twice, at least a week apart, on 10 randomly selected subjects. Interrater reproducibility was assessed by two investigators, blinded to patient details, who measured TIVs and brain volumes on five randomly selected subjects.
Statistical Analysis
Data were analyzed with Microsoft Excel 95 and Stata version 6.0. Paired t tests were used to test for evidence of systematic differences in mean volumes between the measuring techniques. Regression analyses were used to assess the effect of age and sex on TIV, brain volume, and normalized brain volume. Plots of standardized residuals indicated that the linear assumptions with age were appropriate. Pearson's correlation coefficients were used to measure the extent of linear association between two variables. The Pitman and Wilcoxon signed-rank tests were used to analyze variability reductions after normalization.
Results
Cross-Sectional TIV Normalization
The T2-weighted TIV measurements of the control group are displayed in Fig 2A. The TIV measurements differed by sex, with the mean TIV for men 179 mL larger than that for women (P < .001 by unpaired t test). There was no significant linear relationship between TIV and age (P = .49 after adjustment for sex; partial correlation coefficient r = −.10). In contrast, brain volumes decreased significantly with age, by about 32 mL for each 10-year increase in age (P < .001 after adjustment for sex; partial correlation coefficient r = −.51) (Fig 2B). There was no significant interaction between sex and age; therefore, we assumed the same rate of decrease with age for both sexes (P = .10). Figure 2C shows that normalizing the brain volumes reduced the scatter of data as assessed by the coefficient of variation (CV), which decreased from 10.0% (Fig 2B) to 6.0% (Fig 2C) (P < .001 by Pitman's test). Sex-related differences also were reduced when the brain volumes were normalized (Fig 3). The mean brain volume was 12% larger for men compared with women (1262 mL ± 113 vs 1123 mL ± 810), but the normalized volumes were very similar (0.84 ± 0.05 for men vs 0.85 ±0.05 for women; P = .57 by unpaired t test). This remained statistically nonsignificant after adjustment for age (P = .37 by unpaired t test).

The relationships between TIV and age (A), brain volume and age (B), and normalized brain volume and age (C), in healthy controls

Brain volumes and normalized brain volumes in male (M) and female (F) controls with group averages marked, showing a reduction in sex-dependent differences after TIV normalization.fig 4. Comparison of TIV measurements from T1- and T2-weighted MR images in five controls and five AD patients.fig 5. Serial T1-weighted TIV measurements in five controls and five AD patients
Validation of T1- vs T2-Weighted Measures of TIV
Figure 4 shows the relationship between the TIV measured from T2-weighted imaging and that from T1-weighted imaging. The mean TIV volumes were 1382 mL ± 144 and 1374 mL ± 150 when measured on T1- and T2-weighted images, respectively (P = .16 by paired t test). The measures were in close agreement in absolute terms (mean absolute percentage difference [MAPD], 0.93% (0.65) and were highly correlated (r = .99; P <.001).
Reproducibility
The intra- and interrater variabilities are displayed in the Table. The TIV measured on T1-weighted images had less variability (MAPD on repeated measures, 0.23% ± 0.17) than the TIV measured on T2-weighted images (0.99% ± 0.38; P = .007 by unpaired t test). The coefficients of variation also differed significantly (P = .003 by unpaired t test).
Reproducibilities and operator times
Longitudinal TIV Normalization
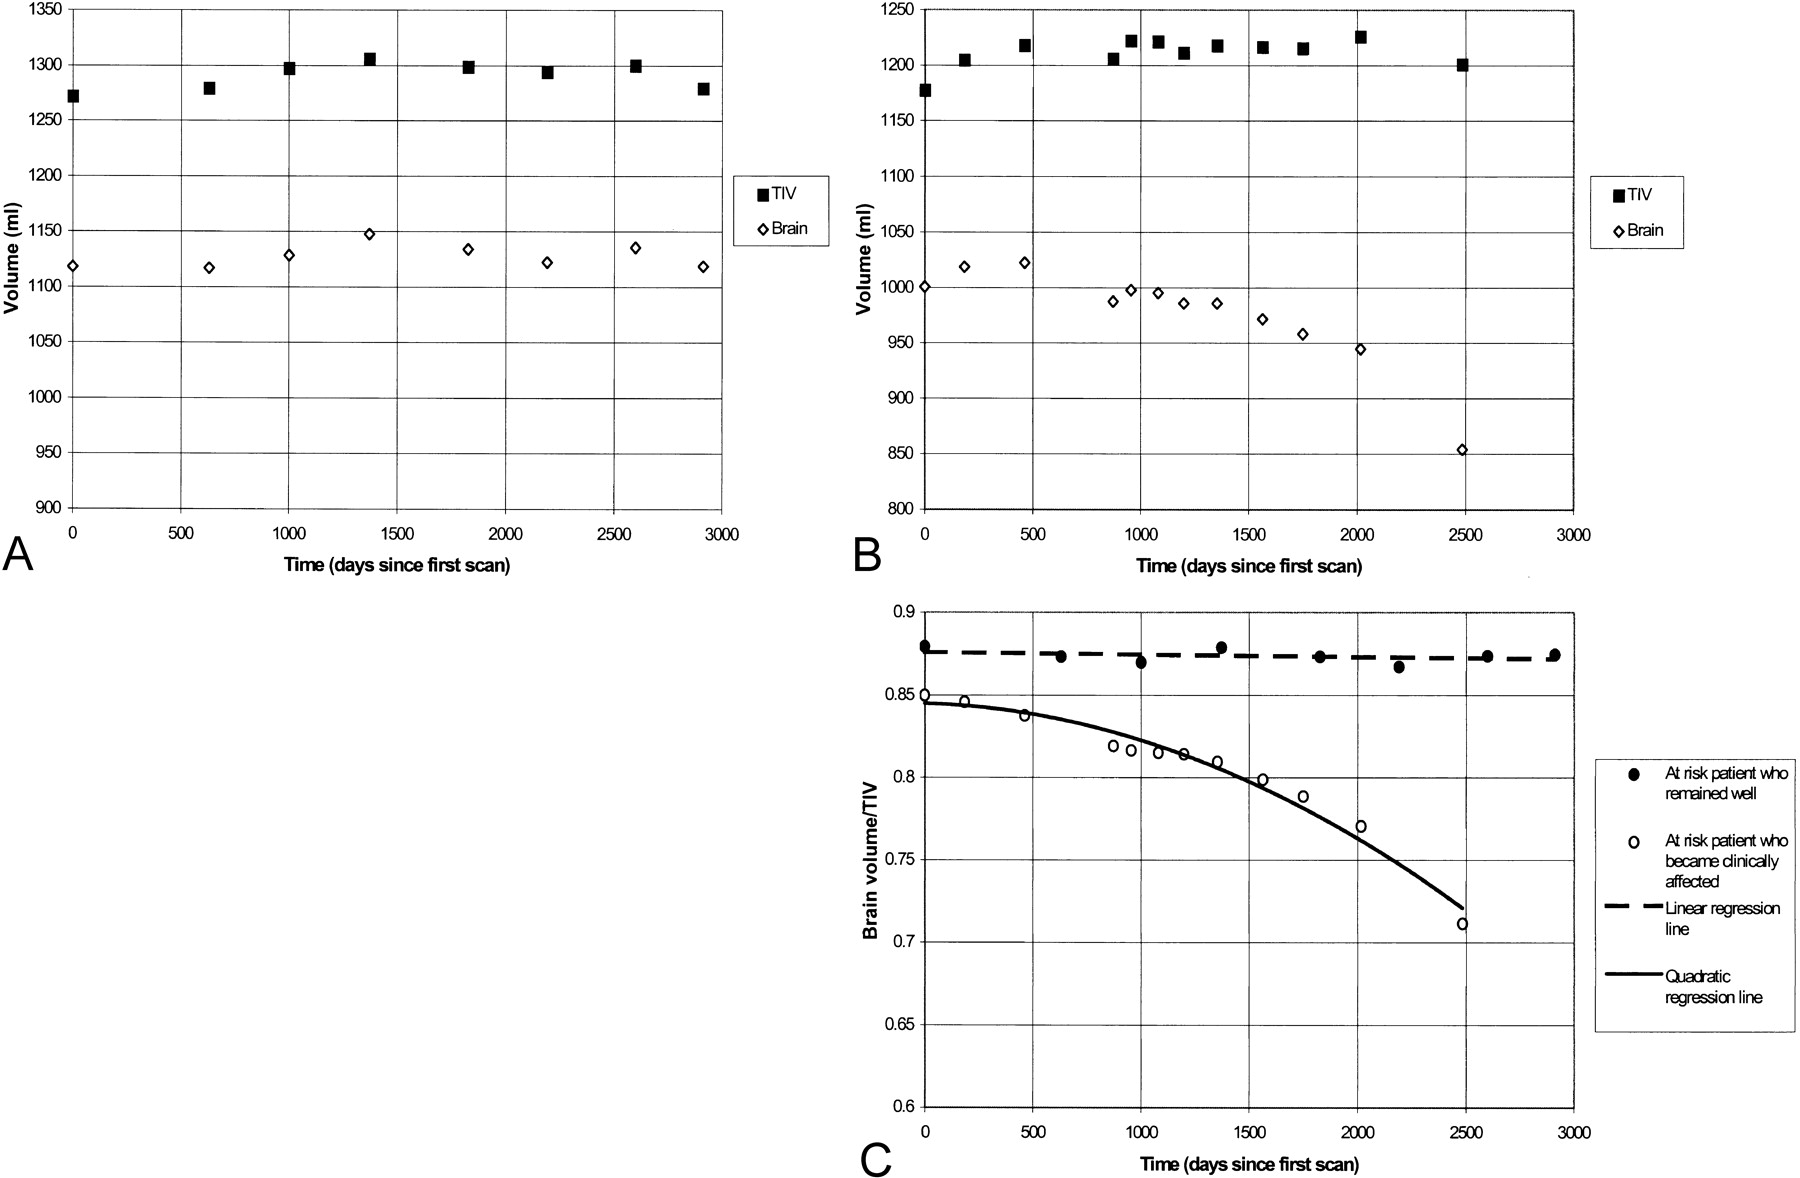
There were no systematic shifts between the two serial TIVs measured from T1-weighted imaging (P = .55 by paired t test) (Fig 5). However, small but measurable variations did exist over time with an MAPD between the pairs of scans of 0.69% ± 0.39, compared with the intrarater variability MAPD of 0.23% ± 0.17. This variation was shown in the T1-weighted TIVs of the at-risk subject who remained well and from whom eight images had been obtained over 8 years (Fig 6A). Accurately measured brain volumes of this control also fluctuated over time (Fig 6A). The brain and TIV fluctuations were highly correlated (r = .88; P = .004). The intraindividual variation in these measures was reduced when the brain volumes were normalized; the CV decreased from 1.0% to 0.5% (Fig 6C). The fluctuations in brain volume of the initially asymptomatic subject who developed AD also were reduced after TIV normalization. Over 7 years, the TIV fluctuations matched those of the brain volume (Fig 6B). Once normalized for TIV, brain volumes showed a smooth decrease over time (Fig 6C). The fluctuations and reductions in intraindividual variation after normalization were similarly observed in 10 controls and five AD patients with short-interval serial images (CV decreased from 1.3% to 0.5%; P = .002 by Wilcoxon signed-rank test).

Serial TIV and brain volumes in an at-risk patient who remained well (A) and an at-risk patient who developed AD (B), compared with normalized brain volumes from serial images in both of the patients at risk (C)
Discussion
Our total intracranial volume measurements in controls were relatively stable across the age range studied (23–83 years), consistent with previous studies (27). Our study confirms the well-recognized wide range in intracranial and brain volumes between individuals. The largest volume was about 60% greater than the smallest brain volume. On average, the men had brain volumes that were 12% larger than those of the women. Importantly, these wide interindividual and sex-dependent variations were much reduced after TIV normalization. The largest brain/TIV ratio was only 30% greater than the smallest (Fig 3). Mean brain/TIV ratios for men and women were within 1% of each other, effectively removing the difference between sexes. This accords with the study of Blatter et al (28) of MR imaging in 194 healthy volunteers (aged 36–45 years). They measured TIV on T2-weighted images and found that TIV normalization reduced sex-related differences in total brain, gray matter, and white matter volumes. Such adjustments are important in studies assessing group differences in cerebral volume, which otherwise may be confounded by differences in head (and TIV) size between groups.
The intraindividual variation in TIV was measured on serial T1-weighted volumetric images. Importantly, the TIV measurement appeared to be independent of progression of brain atrophy. In two subjects followed serially for at least 7 years, the fluctuations in TIV and brain volume were correlated. These fluctuations in volumes were discernible in both the healthy controls and the affected subjects. The brain volumes were carefully segmented, with manual correction of each of about 100, 1.5-mm sections spanning the brain, and so are a relatively accurate measure of the brain volume represented by the image acquisition. Therefore, some of the correlated fluctuation can be attributed to changes or “drifts” in the true voxel dimensions between images (15). The TIV measurements matched this pattern because the voxel distortions affect the brain and skull similarly. Therefore, the TIV can be used to normalize the brain volumes, revealing a smooth decrease in brain volume in the clinically affected, at-risk patient and a relatively constant brain volume, with less variation, in the at-risk patient who remained well.
It is not common practice to measure a TIV on every volumetric acquisition, although we have shown why it can be important. Unfortunately, longitudinal correction does increase the number of measurements performed in a study, and our method, while simple to apply, does create a penalty in terms of operator time. A quicker, automated procedure would be ideal. Rudick et al (29) have developed the brain parenchymal fraction (BPF), calculated as a ratio of brain parenchymal volume to total volume contained within the brain surface contour, as an automated, normalized measure of atrophy based on dual-echo imaging. The BPF would be relatively independent of voxel scaling distortions and would normalize longitudinally in much the same way as our brain/TIV measure. The BPF also might underestimate progression of atrophy, however, because not all ‘sulcal’ (extracerebral) CSF is included in the measure. This may be particularly important in diseases in which sulcal CSF increases are considerable, such as AD. Another automated method has been used by Yasuda et al (30), who measured TIV by using a fully automated algorithm to detect the outer surface of dura on every slice of coronal T1-weighted images. This should allow a similar longitudinal normalization, if measured on every serial image.
A T1-weighted TIV can be used to normalize other regions of interest within the brain, such as the amygdala (31). The TIV-based correction of hippocampal volumes has been shown to reduce between-individual variations (32). Similarly, TIV measurements may prove useful in serial studies of hippocampal atrophy, using the TIV to reduce the confounding effects of changes in voxel size.
Conclusion
This study evaluated the application of TIV normalization of brain volumes measured from the same volumetric T1-weighted image. The TIV correction can be used cross-sectionally, to reduce interindividual variation, and longitudinally, to adjust for subtle image distortions affecting measurements of change in individuals. This is likely to become increasingly important as serial imaging measures of atrophy are used as surrogate markers of disease progression in therapeutic trials.
Acknowledgments
The authors thank Rachael Scahill for useful comments and discussion, and Professor Martin Rossor for advice and support. We also gratefully acknowledge the patients and their relatives for their willingness to participate in research studies.
Footnotes
1 This work was supported by Novartis Pharmaceuticals (to JL Whitwell), an MRC Programme Grant (to Dr. Crum), and an MRC Clinician Scientist Fellowship (Dr. Fox).
2 Address reprint requests to Dr. Nick Fox, Dementia Research Group, National Hospital for Neurology and Neurosurgery, 8–11 Queen Square, London WC1N 3BG, UK.
References
- Received November 9, 2000.
- Accepted after revision April 2, 2001.
- Copyright © American Society of Neuroradiology
In this issue


Jump to section
Related Articles
Cited By...
- Choroid Plexus Enlargement in Secondary Progressive MS: phenotype comparison
- Lifetime brain atrophy estimated from a single MRI: measurement characteristics and genome-wide correlates
- Anatomical Abnormalities Suggest a Compensatory Role of the Cerebellum in Early Parkinsons Disease
- AutoMacq: an automatic pipeline to analyse macaque structural MRI data
- Brain age gap in neuromyelitis optica spectrum disorders and multiple sclerosis
- Comparison of Structural Changes in Nodding Syndrome and Other Epilepsies Associated With Onchocerca volvulus
- A comparison of intracranial volume estimation methods and their cross-sectional and longitudinal associations with age
- Hyper-adaptation in the Human Brain: Functional and structural changes in the foot section of the primary motor cortex in a top wheelchair racing Paralympian
- Identifying neurocognitive outcomes and cerebral oxygenation in critically ill adults on acute kidney replacement therapy in the intensive care unit: the INCOGNITO-AKI study protocol
- Network diffusion model predicts neurodegeneration in limb-onset amyotrophic lateral sclerosis
- Association of Infarct Volume Before Hemicraniectomy and Outcome After Malignant Infarction
- Functional plasticity coupled with structural predispositions in auditory cortex shape successful music category learning
- Interoception Primes Emotional Processing: Multimodal Evidence from Neurodegeneration
- Kynurenine pathway metabolites in cerebrospinal fluid and blood as potential biomarkers in Huntingtons disease
- Neuroanatomical predictors of response to subcallosal cingulate deep brain stimulation for treatment-resistant depression
- White Matter Connectivity Abnormalities in Prediabetes and Type 2 Diabetes: The Maastricht Study
- Multimodal Hippocampal Subfield Grading For Alzheimers Disease Classification
- Evaluation of mutant huntingtin and neurofilament proteins as potential markers in Huntingtons disease
- Neurofilament light protein in blood predicts regional atrophy in Huntington disease
- How Does the Accuracy of Intracranial Volume Measurements Affect Normalized Brain Volumes? Sample Size Estimates Based on 966 Subjects from the HUNT MRI Cohort
- Effects of Gadolinium Contrast Agent Administration on Automatic Brain Tissue Classification of Patients with Multiple Sclerosis
- Interhemispheric Functional Connectivity following Prenatal or Perinatal Brain Injury Predicts Receptive Language Outcome
- Flavour identification in frontotemporal lobar degeneration
- Quantitative Assessment of Brain Stem and Cerebellar Atrophy in Spinocerebellar Ataxia Types 3 and 6: Impact on Clinical Status
- The progression of regional atrophy in premanifest and early Huntington's disease: a longitudinal voxel-based morphometry study
- Onset and Progression of Pathologic Atrophy in Huntington Disease: A Longitudinal MR Imaging Study
- Pitfalls in the Use of Voxel-Based Morphometry as a Biomarker: Examples from Huntington Disease
- Magnetization Transfer Ratio in Alzheimer Disease: Comparison with Volumetric Measurements
- Increased rate of whole-brain atrophy over 6 months in early Huntington disease.
- Effects of A{beta} immunization (AN1792) on MRI measures of cerebral volume in Alzheimer disease
- Parkinson disease, brain volumes, and subthalamic nucleus stimulation
- Quantitative MRI measurement of superior cerebellar peduncle in progressive supranuclear palsy
- Mapping the onset and progression of atrophy in familial frontotemporal lobar degeneration
- Pontine atrophy precedes cerebellar degeneration in spinocerebellar ataxia 7: MRI-based volumetric analysis
- Do cognitive patterns of brain magnetic activity correlate with hippocampal atrophy in Alzheimer's disease?