
Abstract
BACKGROUND AND PURPOSE: In young adults, hematopoietic bone marrow has usually converted to fatty marrow. Fat hyperintensity on T1-weighted MR images facilitates the evaluation of marrow abnormalities. Our purpose was to compare cranial marrow signal intensity patterns in adults with systemic disorders and in healthy subjects.
METHODS: MR images in 25 adults with underlying systemic disorders (chronic anemia, lymphoma, leukemia, or other infiltrative processes) and 44 healthy aged-matched individuals were retrospectively reviewed. Calvarial and clival marrow signal intensity on sagittal T1-weighted images was graded relative to that of orbital fat, white matter (WM), and gray matter (GM). Marrow was classified as homogeneous (uniformly isointense), diffusely heterogeneous (mottled), or focally heterogeneous (generally isointense with a focal lesion).
RESULTS: In 84% of the control subjects, bone marrow was iso- or hyperintense relative to WM. Patients had abnormal diploic (n = 22) or clival (n = 17) marrow; 22 had calvarial marrow that was hypointense relative to WM compared with that in seven healthy subjects (P < .001). Marrow hypointensity relative to WM was a sensitive (93%) and specific (86%) marker of pathologic abnormality. Although marrow hypointensity relative to GM was specific (96%), it was not sensitive (67%). Calvarial and clival marrow patterns, respectively, were homogeneous in 81% and 64% of control subjects and 76% and 60% of patients. Clival marrow intensity varied more than did calvarial intensity; therefore, clival criteria were less sensitive and accurate in systemic disease detection.
CONCLUSION: Homogeneous diploic marrow hypointense relative to WM on non-contrast-enhanced T1-weighted images suggests an underlying systemic or hematologic disorder and requires appropriate clinical correlation and evaluation.
MR imaging is particularly well suited for the study of bone marrow, because it can be used to differentiate fat from other tissues. Signal intensity is directly related to relative amounts of fat, water, and cells in the marrow. Hematopoietic (red) marrow is composed of approximately 40% fat, 40% water, and 20% protein compared with inactive fatty (yellow) marrow, which contains approximately 80% fat, 10–15% water, and 5% protein (1). On non-contrast-enhanced T1-weighted images, yellow marrow has high signal intensity relative to that of muscle; it approaches the intensity of subcutaneous fat. Cellular red marrow has an intermediate signal intensity, which may be isointense or slightly hyperintense relative to muscle, depending on the cell-to-fat ratio.
Marrow conversion represents a normal process in which yellow marrow gradually replaces red marrow. At birth, marrow is predominantly red in both the appendicular and axial skeletons. In the appendicular skeleton, most of the marrow has undergone conversion by the time an individual is aged 25 years. Residual red marrow is found in the proximal metaphyses of the femurs and humeri. In the axial skeleton, a larger portion of the marrow in adults remains hematopoietic compared with the appendicular skeleton (2).
A spectrum of processes may affect bone marrow, causing a change in the proportion of marrow constituents. When demand for hematopoeisis is increased in response to systemic stresses such as chronic anemia, heart failure, or heavy smoking (3), reconversion of fatty marrow to cellular marrow may occur in an anatomic pattern opposite to that of conversion (2). In addition, cellular replacement of bone marrow may occur in hematologic malignancies, infiltrative processes such as granulomatous disease, and polycythemia vera.
Increased marrow cellularity, whether from pathologic replacement or physiologic stress, may be detectable on MR images (4, 5). To detect such abnormalities, an understanding of normal marrow characteristics on MR images is necessary. An alteration in the normal signal intensity may be the earliest, and occasionally the only, sign of an underlying systemic disorder. Normal and abnormal marrow signal intensity on MR images has been previously studied in the vertebrae (4–9), femur (3, 6, 10), and pelvis (4–6). Findings from a few studies of the MR imaging appearance of calvarial and clival marrows in normal and diseased states have been reported (6, 11, 12). A consensus exists that, with increasing age, the normal conversion of red marrow to yellow marrow is detectable as progressive hyperintensity on non-contrast-enhanced T1-weighted MR images. However, results regarding the rate at which this occurs differ. In the calvarium, uniform hyperintensity on T1-weighted images has been reported in more than 80% of healthy subjects by the time they are aged 15 years (12). Another study (11) also revealed that this pattern was most common in subjects older than 20 years (11). However, to our knowledge, the MR imaging appearance of diploic marrow in patients with systemic disease has not been extensively investigated.
The purpose of this study was to determine if particular signal intensity patterns in the cranial marrow were suggestive of an underlying systemic disorder. We evaluated the MR signal intensity characteristics of calvarial and clival marrow in patients with known systemic disorders and compared them with those of healthy control subjects.
Methods
Sagittal non-contrast-enhanced T1-weighted brain MR images in 25 consecutive patients with known systemic disorders, who were examined over a 3-month period, were mixed with those of 44 healthy control subjects. Two blinded neuroradiologists (L.A.L., D.M.L.) retrospectively reviewed the images; they were unaware of the source of the images, that is, patient or control subject. In the 25 patients (12 men, 13 women), systemic disorders included chronic anemia, with serum hemoglobin levels of 6.8–11.2 mg/dL (n = 10); hematologic malignancies (lymphoma, leukemia, myeloma) (n = 7); bone marrow transplants (n = 2); and a single case each of sarcoid, metastatic breast cancer, renal osteodystrophy, myelodysplastic syndrome, and transient thrombocytopenic purpura. Subjects younger than 21 years were excluded from the study to ensure that all those participating were old enough to have adult marrow conversion. The ages of the patients at the time of their MR studies ranged from 27 to 78 years (mean, 51 years).
MR images were obtained in 44 age-matched healthy control subjects (18 men, 26 women; age range, 21–78 years; mean, 52 years). These subjects were being examined for reasons unrelated to bone marrow (eg, headache, dizziness, memory loss). Before their inclusion in the study, the medical history of all control subjects was reviewed by using their medical records to exclude individuals with systemic illnesses or abnormal hemoglobin levels (all control subjects had normal hemoglobin levels within 3 weeks of their MR examinations).
All MR examinations were performed with a 1.5-T system (Signa; GE Medical Systems, Milwaukee, WI) by using a quadrature head coil. The imaging protocol included standard spin-echo sagittal T1-weighted imaging (600–700/11–17[TR/TE]) of the whole brain. Other imaging parameters included a section thickness of 5 mm, one or two excitations, a 22-cm field of view, and a 256 × 192 matrix.
The calvarial and clival bone marrow signal intensities were graded relative to that of orbital fat, white matter (WM), and cortical gray matter (GM). In addition, each reviewer gave a subjective indication as to whether they thought the calvarial and clival marrows were normal or abnormal. Calvarial and clival marrow were also classified as homogeneous (uniformly isointense), diffusely heterogeneous (mottled), or focally heterogeneous (generally isointense with a focal lesion).
The medical records of all patients and control subjects, including serum hemoglobin values, were reviewed within 3 weeks of their MR examinations. The sensitivity, specificity, and accuracy of MR imaging in the evaluation of calvarial and clival marrow were determined. The assessment of interobserver agreement regarding image interpretation was based on 54 analysis. The data were statistically analyzed with a Fischer exact test; P values of less than .05 were considered to represent a significant difference between the results in patients and those in control subjects.
Results
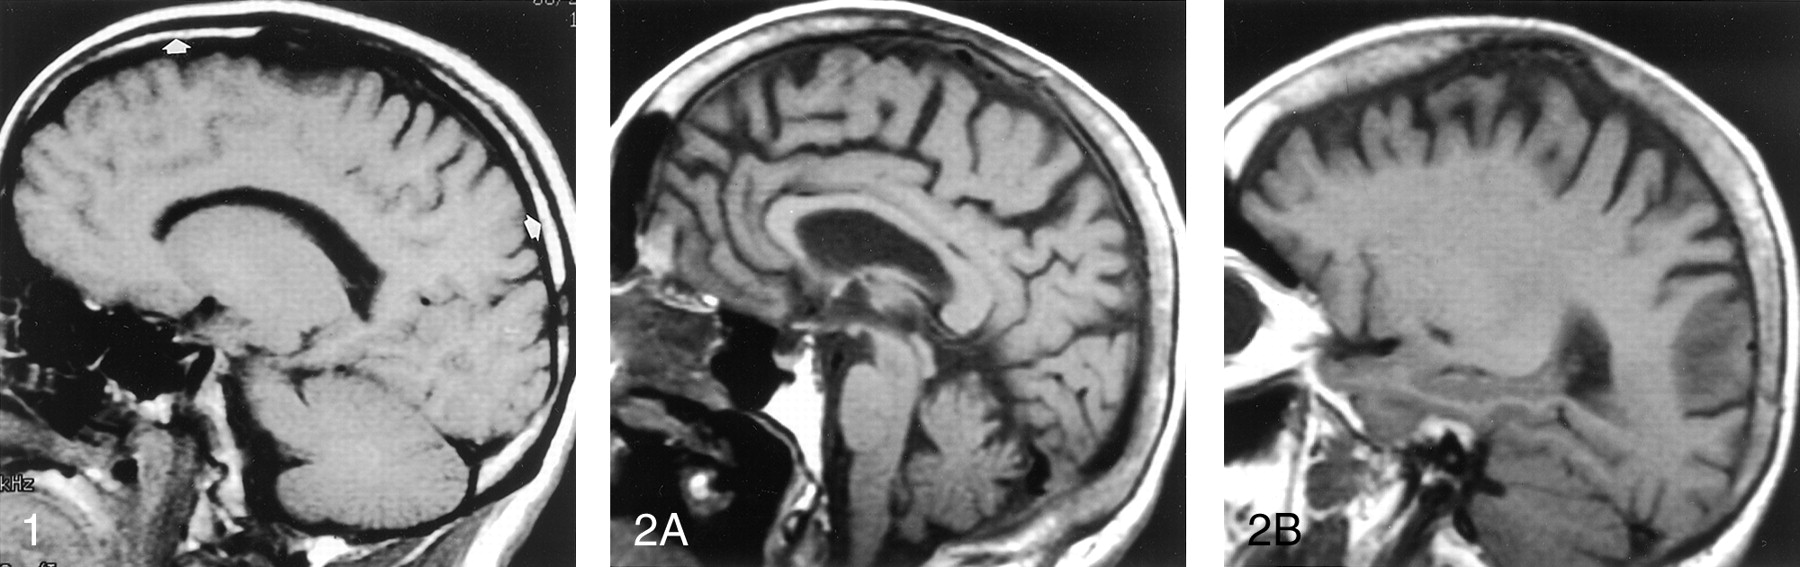
The observers agreed in 131 of 138 readings (analysis of calvarial and clival marrows in 25 patients and 44 control subjects resulted in 138 interpretations) and resolved findings in seven cases by consensus (54 = 0.96). In 37 (84%) control subjects, diploic marrow was iso- or hyperintense relative to WM (Figs 1 and 2); 9% had marrow that was hypointense relative to WM but iso- or hyperintense relative to GM; and in 7% of cases, the calvarial marrow was hypointense relative to GM (Table 1). The MR signal characteristics of clival marrow in healthy control subjects (Fig 2) showed that 91% had marrow that was predominantly iso- or hyperintense relative to WM (Table 2).

Off-midline non-contrast-enhanced sagittal T1-weighted MR image (500/11/1 [TR/TE/excitations]) in a 25-year-old healthy man shows the normal appearance of the diploic marrow in the calvarium. Usually by the time an individual is aged 21 years, conversion from hematopoietic marrow to fatty marrow is completed. The fat content is responsible for the high signal intensity of the diploic marrow on T1-weighted MR images (arrows). The area of hypointensity along the region of the frontal bone represents the neighboring suture.

Midline (A) and parasagittal (B) non-contrast-enhanced T1-weighted MR images (500/11/1) in a 73-year-old healthy woman show the normal high signal intensity of the diploic space due to fat, the major constituent of adult marrow. The mild heterogeneity and thickening of the diploic space is common in older patients. Also note the normal appearance of the clivus in A, which, in this case, is homogeneously hyperintense.
MR signal characteristics of calvarial marrow in healthy control subjects
MR signal characteristics of clival marrow in healthy control subjects
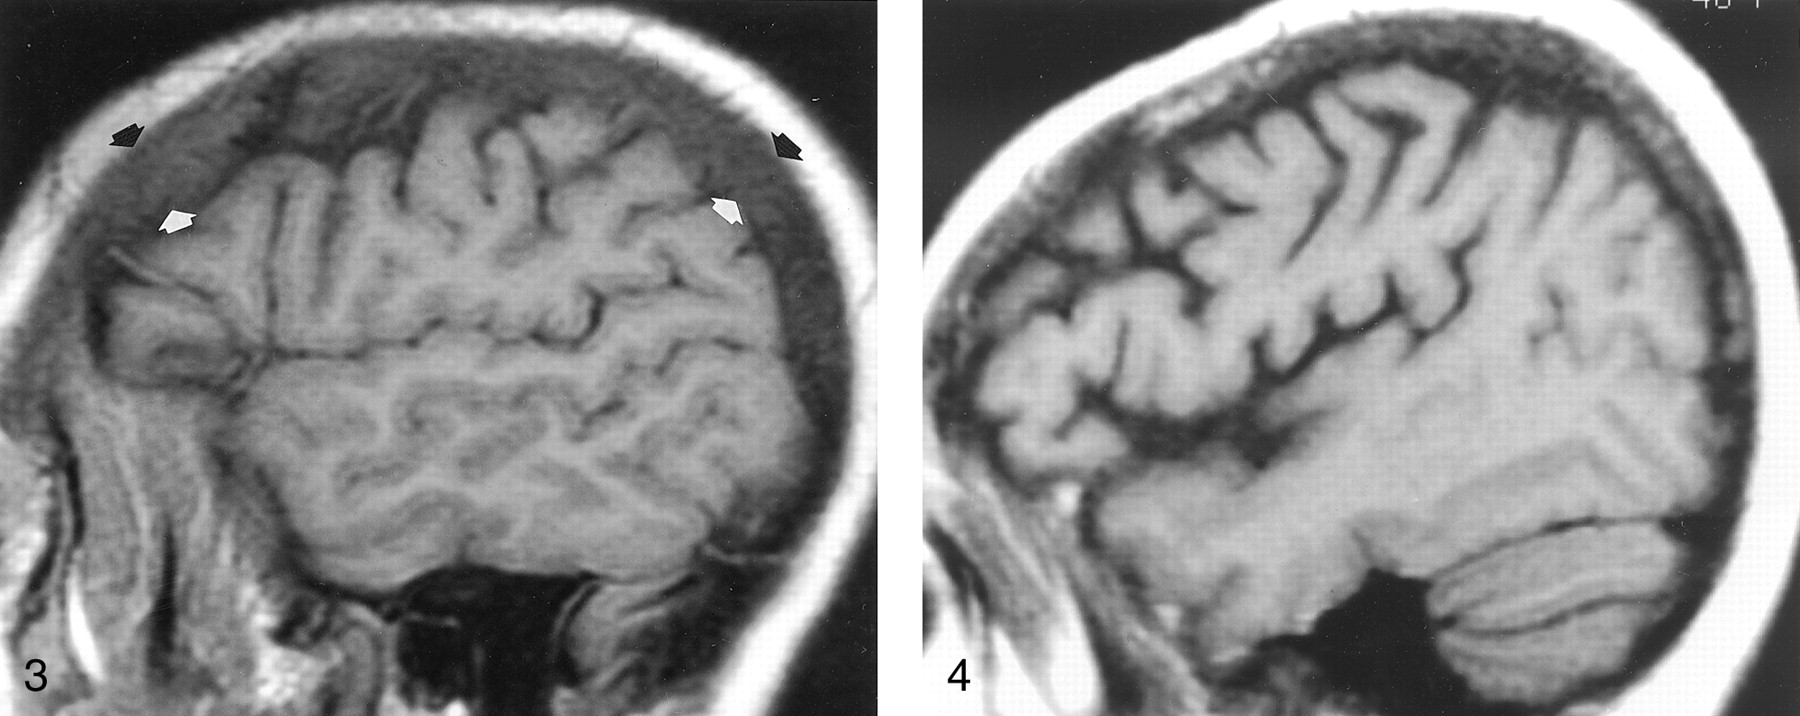
In the blinded review of images in the 25 patients with systemic disorders, 22 (88%) patients had abnormal calvarial marrow, whereas 17 (68%) were believed to have abnormal clival marrow. When the signal intensity of the calvarial marrow was compared with that of orbital fat, WM, and GM, a significant difference was found between patients and control subjects (P < .001). Marrow signal intensity was greater than or equal to that of WM in only three (12%) of 25 patients, compared with 84% of healthy subjects. Therefore, 22 (88%) patients with anemia or other systemic illnesses had calvarial marrow that was hypointense relative to WM (Figs 3–⇓⇓⇓7). The criterion that marrow hypointensity relative to WM is an indicator of systemic disease had the best overall sensitivity (93%), specificity (86%), and accuracy (88%) (Table 3). The criterion that marrow is abnormal if it is hypointense relative to fat was extremely sensitive (100%), but it had low specificity (16%) and accuracy (37%). The criterion that marrow is abnormal if it is hypointense relative to GM was very specific (96%), but it had low sensitivity (67%). Interestingly, subjective (visual) assessment of the marrow as being normal or abnormal without the use of the grading scale yielded results identical to those with the criterion of marrow hypointensity relative to WM; sensitivity, specificity, and accuracy were 93%, 86%, and 88%, respectively (Table 3).

Parasagittal non-contrast-enhanced T1-weighted MR image (600/12/1) in a 35-year-old man with a history of thalassemia and a chronic hemoglobin level of 7.7 mg/dL. The marrow in the diploic space is diffusely abnormal (arrows), because the normal fat has been replaced by hematopoietic tissue, with resultant signal that is hypointense relative that of the adjacent WM and GM.

Off-midline non-contrast-enhanced sagittal T1-weighted MR image (600/12/1) in a 48-year-old woman with breast cancer who presented with headache and fatigue. Overall, heterogeneous marrow is hypointense relative to WM. A subsequent bone scan was diffusely abnormal. Pelvic marrow biopsy revealed metastatic adenocarcinoma. In this patient, alteration of the marrow signal intensity on T1-weighted images was the first indication of metastatic disease.

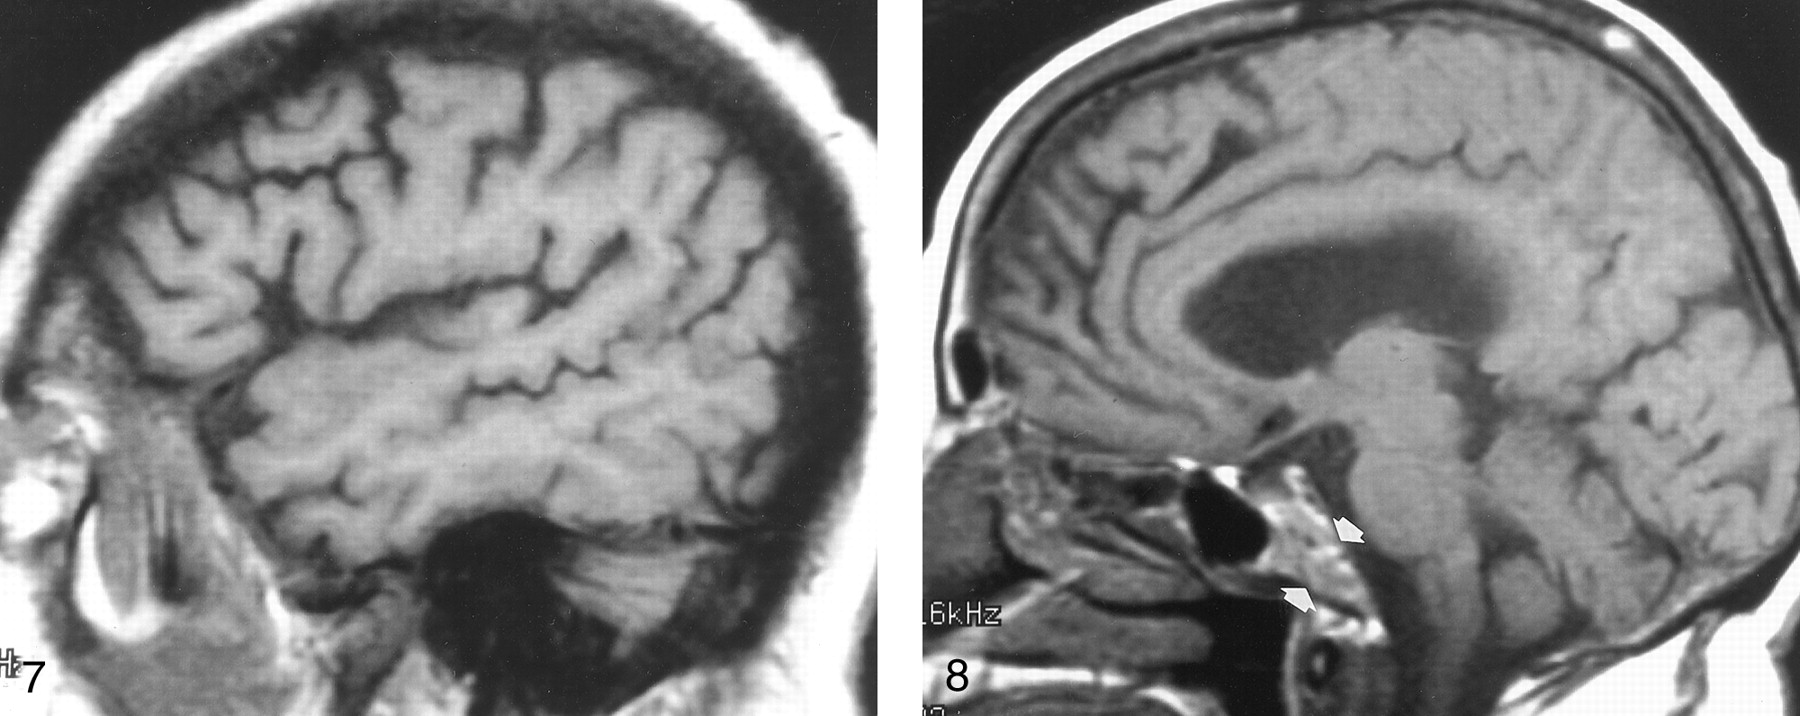
Nonenhanced sagittal T1-weighted MR image (500/11/1) in a 37-year-old woman with AIDS and chronic anemia (hemoglobin level, 8.2 mg/dL) shows diffuse abnormal signal intensity in the calvarial marrow, which is markedly hypointense relative to WM.

Sagittal T1-weighted MR image (600/12/1) in a 70-year-old woman with sarcoid proved at calvarial marrow biopsy shows diffusely abnormal calvarial marrow, which is hypointense relative to WM.

Off-midline sagittal T1-weighted MR image (600/12/1) in a 63-year-old man with newly diagnosed non-Hodgkin lymphoma shows diffusely abnormal diploic marrow. Lymphomatous cellular infiltration was found at bone marrow biopsy in the iliac crest.
Calvarial diploic marrow signal intensity relative to that of fat, GM, and WM in patients with known systemic disorders
The clival marrow intensity patterns were more variable; therefore, in the clivus, the imaging criteria were less sensitive, specific, and accurate in the detection of systemic disease (Table 4). Both readers’ subjective indications (without use of the grading system) about whether the clival marrow was normal or abnormal were most accurate (85%). When clival signal intensity was judged by using the grading system (compared with the signal intensity of WM, GM, or fat), accuracy was much lower and ranged from 58–81%. The finding of clival marrow hyperintensity relative to WM but hypointensity relative to fat was most sensitive (100%); however, this criterion had low specificity (43%). Although the finding of clival signal hypointensity relative to that of WM or GM or determined on a subjective basis was very specific (89%, 100%, and 91%, respectively), clival marrow hypointense relative to WM and GM had low sensitivity (60% and 7%, respectively).
Clival marrow signal intensity relative to that of fat, GM, and WM in patients with known systemic disorders
Calvarial and clival marrow were also classified as homogeneous, diffusely heterogeneous (mottled) (Fig 8), or focally heterogeneous. In the 44 control subjects, calvarial and clival marrows were homogeneous in 36 (81%) and 28 (64%), respectively. These findings were similar to those in patients in whom the calvarial and clival marrows were homogeneous in 19 (76%) and 15 (60%), respectively.

Sagittal T1-weighted MR image (500/11/1) in a 74-year-old healthy woman shows heterogeneous clival (arrows) and diploic marrow patterns. While the marrow is heterogeneous or mottled in character, its overall signal is relatively isointense to that of WM.
Discussion
To detect marrow abnormalities on MR images, an understanding of the normal temporal patterns of red bone marrow and yellow bone marrow is important. The composition of marrow varies both with age and anatomic location. At birth and throughout early childhood, marrow is predominantly hematopoietic (red). With aging, hematopoietic marrow is gradually converted to fatty (yellow) marrow (2). Factors thought to influence conversion include variations in local temperature, vascular supply, and oxygen tension (2).
The largest transition from red marrow to yellow marrow occurs in the first and second decades of life, with a second shift occurring in the seventh decade of life (2, 13, 14). Rates of conversion vary within particular regions of the axial or appendicular skeleton. In addition, rates of conversion may differ within a single bone. The appendicular skeleton undergoes conversion before the axial skeleton. Conversion begins in the most peripheral tubular bones (the phalanges in the hands and feet) and progresses centrally to the humeri and femurs. By 25 years of age, most of the marrow has undergone conversion, with the exception of residual red marrow in the proximal metaphyses of the femurs and humeri. In the axial skeleton (vertebrae, sternum, pelvis, and ribs), regions of hematopoietic marrow may persist well into adulthood (2). In pathologic studies of the iliac crest, three stages of hematopoietic tissue have been identified (14). In the first stage, which spans the first decade of life, hematopoietic tissue accounts for approximately 80% of the marrow. In the second stage, the percentage of red marrow decreases to 50% by 30 years of age and stays relatively constant until 60 years of age. In the final stage, 30% of the marrow or less is composed of hematopoietic tissue.
In adults, reconversion of yellow marrow to red marrow occurs with prolonged physiologic stress or when substantial replacement of the normal marrow occurs such that the demand for blood cell production exceeds the ability of the marrow to meet these demands (2, 15). Physiologic stress may be caused by a variety of conditions, including chronic anemias such as sickle cell disease, thalassemia, thrombotic thrombocytopenic purpura, heart failure, or anemia that complicates systemic chemotherapy and radiation treatment (2, 11). Infiltrative processes involving the marrow include hematologic malignancies (leukemia, lymphoma, and multiple myeloma), as well as metastatic disease. Replacement of the marrow by nonmalignant processes may occur with sarcoid, polycythemia vera, and myelodysplastic disorders (2, 15).
Marrow reconversion occurs in an orderly pattern opposite to that of conversion; it begins centrally in the axial skeleton and proceeds peripherally to the appendicular skeleton (2). Flat bones in the axial skeleton such as the sternum, spine, and scapula undergo reconversion at a faster rate (2). Findings suggest that adults younger than 40 years have an increased capacity for marrow reconversion compared with older adults; however, the reason for this is unknown (3, 9, 15).
MR imaging, because of its superior contrast and soft-tissue resolution, allows the distinction of fat from other tissues. As a result, it is a choice imaging technique in the examination of patients with suspected marrow disorders (4, 5). MR imaging has also been valuable in following the clinical course of many marrow disorders, as well as in guiding the clinician in selecting sites for marrow biopsy. Plain-film radiography is insensitive in the detection of marrow disorders in that it may not reveal an abnormality until advanced replacement of the marrow has occurred. Frequently, more than 50% of the trabecular bone must be involved for an abnormality to be depicted on plain radiographs. CT is the best imaging modality for the assessment of cortical bone; however, it cannot be used to distinguish between normal and abnormal marrow until large quantities of bone are involved. Although radionuclide studies may be used to detect aberrations in normal activity, they are not always sensitive to the difference between normal and pathologic marrow (particularly in the setting of hematologic malignancies), and they have less than optimal anatomic resolution.
On spin-echo MR images, the signal from fat is averaged with that of water to produce a composite signal intensity. The contrast between fat and cellular marrow is emphasized on T1-weighted images. As a result of decreased T1 relaxation times, normal adult yellow marrow has high signal intensity relative to that of muscle; it approaches the intensity of subcutaneous or orbital fat (Figs 1 and 2). Cellular marrow has an intermediate signal intensity that is the same as or slightly higher than that of muscle. Age-related changes in marrow composition lead to a progressive decrease in T1 relaxation times that correspond to increased signal intensity on MR images. The largest decrease in T1 relaxation times in the vertebral bodies occurs between the first and second decades of life; this result is consistent with pathologic findings in marrow composition (7, 13, 14). In addition to age, sex may account for variability in marrow intensity. In healthy subjects older than 50 years, women have slightly greater T1 and T2 relaxation times in their vertebral bodies relative to men; this finding is attributed to the more rapid and extensive demineralization of bone associated with menopause (7).
Heterogeneous marrow with foci of hypercellularity due to hyperplasia can represent a normal variation. Physiologic heterogeneity has been associated with smoking, menstruation, athletic training, and obesity (3, 10, 15). Poulton et al (3) found foci of low signal intensity on T1-weighted images in the metaphyses of the distal femur and in the proximal tibia in six (28%) of 21 heavy smokers, two (20%) of 10 moderate smokers, but only one (4%) of 25 nonsmokers. Foci of hypointensity have been attributed to an increase in the number of granulocytes and erythrocytes at pathologic evaluation in smokers (16). In a study performed to evaluate the marrow of marathon runners, just fewer than 50% had hypointensity on T1-weighted images in the distal femur, compared with 3% of healthy subjects (10).
Healthy and pathologic characteristics of marrow on MR images have been evaluated in the vertebrae (4–9), femur (3, 6, 10), and pelvis (4–6). Studies have shown that MR imaging is sensitive in the detection of disorders and in the assessment of their pattern and distribution; however, it has low specificity, because it cannot be used to distinguish among the various infiltrative processes. Daffner et al (4) evaluated MR images in a select group of patients with known malignancies. Surveys of the lumbar spine, pelvis, and hips revealed that the presence of marrow infiltration correlated with hypointensity on T1-weighted images. The MR findings were confirmed at biopsy in the affected bones. Nyman et al (5) also compared MR imaging findings with histologic characteristics in bone marrow aspirates from patients with neoplastic disease, polycythemia vera, and reactive marrow (nonspecific reaction to external stimuli resulting in increased cellularity) (5). They found that areas of high cellularity corresponded to areas of low signal intensity on T1-weighted images. The T1 relaxation times were not significantly different regardless of the histologic diagnosis in patients with similar degrees of marrow cellularity.
Few studies have been performed to evaluate the signal intensity characteristics of cranial marrow (6, 11, 12, 17). At histopathologic analysis, the amount of active cranial bone marrow is about 25% at birth and 12% at 10 years of age (13). Calvarial marrow undergoes conversion from red marrow to yellow marrow by the time an individual is 20 years of age, before conversion of the spine (13). Previous investigators have described normal age-related patterns of MR signal intensity. Okada et al (12) found three patterns of calvarial signal intensity on T1-weighted images in 246 healthy subjects: uniformly low, uniformly high in the frontal and occipital bones with more heterogeneity in the parietal bones, and uniformly high signal intensity. Uniformly low signal intensity, which represents a predominance of red marrow, was observed in more than 90% of infants younger than 1 year. This pattern was no longer observed after 7 years of age. By the time patients are aged 15 years, an adult pattern of homogeneously hyperintense marrow is present in more than 80% of the subjects. Using the same imaging patterns, Ricci et al (6) also found that the calvarial marrow was predominantly hypointense in very young subjects, although a similar pattern occurred in a small subset of subjects aged 41–50 years. After 20 years of age, homogeneously high signal intensity was predominant.
We investigated if patterns of signal intensity in the calvarium could reliably indicate the presence of an underlying systemic disorder. Our results showed that diploic marrow was diffusely hypointense relative to WM on nonenhanced T1-weighted images in 88% of patients with an underlying systemic disorder (Figs 3–7). Therefore, this finding warrants appropriate workup, which, at our institution, begins with clinical correlation and complete blood count analysis. However, this pattern may be a normal variant, as was the case in 16% of the control subjects in our study.
In our study, the clival marrow had a signal intensity pattern that was more variable than that of calvarial diploic marrow in both healthy and pathologic states. Therefore, the distinction of normal and abnormal heterogeneous signal intensity in the clivus may be problematic. Our results are similar to those of Kimura et al (11). These investigators reviewed T1-weighted MR images in 330 healthy adults aged 20–88 years and found a spectrum of heterogeneous clival patterns with areas of hypointensity, as well as hyperintensity, relative to WM. Only 34% of subjects, by the time they were aged 30 years, had uniform hyperintensity. Although healthy adults in our study had predominantly hyperintense clival marrow, heterogeneity with focal regions of hypointensity was present in more than one third of the control subjects; this finding was similar to those of patients with hematologic disorders (Fig 8). This differs from the results of Okada et al, who found that the signal intensity of clival marrow progressively changed from uniformly low to uniformly high and that 95% of subjects, by the time they were aged 24 years, had uniformly high signal intensity. However, our results, as well as those of other investigators, revealed that the presence of homogeneously low signal intensity in the clivus of an adult strongly suggests the presence of an abnormality (11, 12, 17).
Conclusion
Homogeneous diploic or clival marrow that is hypointense relative to WM on non-contrast-enhanced T1-weighted images should suggest an underlying systemic or hematologic disorder; however, in a small subset of patients, this finding may represent a normal variation. Furthermore, alteration of the marrow signal intensity on T1-weighted images may be the first indication of an underlying systemic disorder. The examination of patients with abnormal diploic marrow should include close clinical correlation, as well as a complete blood count analysis to assess the white blood cell count, cell morphology, and hemoglobin and hematocrit levels. If findings from these initial studies are abnormal, further evaluation, including bone marrow biopsy and careful correlation of MR imaging findings with radionuclide bone scan and plain radiographic findings, may be indicated.
Footnotes
Supported by the RSNA Research and Education Fund Scholar Grand and Medical Student/Scholar Assistant Program
Presented at the Joint Annual Meeting of the American Society of Neuroradiology and the American Society of Head and Neck Radiology, Toronto, Ontario, Canada, May 1997.
References
- Received August 10, 1999.
- Accepted after revision October 22, 2001.
- Copyright © American Society of Neuroradiology


