
Abstract
Summary: High-resolution MR imaging of the inner ear with a heavily T2-weighted 3D fast spin-echo sequence has been performed successfully at 1.5 T. However, at 3 T, the longer T1 time of CSF necessitates a longer TR, resulting in significantly prolonged imaging times. In this study, the fast recovery 3D fast spin-echo sequence, which permits the TR to be reduced while maintaining T2 contrast, was optimized at 3 T for imaging of the inner ear. The optimized sequence parameters are as follows: 1500/294 (TR/TE); echo spacing, 18.1 ms; bandwidth, 38 kHz at 512 readout; and imaging time, 13 minutes.
High-resolution MR imaging of the inner ear with a heavily T2-weighted 3D fast spin-echo sequence has been performed successfully at 1.5 T (1). However, at 3 T, it is difficult to apply an ultralong echo train length because of specific absorption rate limitations, and the longer T1 of CSF makes it necessary to use a longer TR, resulting in significant prolongation of imaging time. Recently, the fast recovery pulse has been introduced and has been found to perform well at 1.5 T in various applications (2–5). This makes it possible to reduce the TR while maintaining T2 contrast by applying the fast recovery pulse at the end of the echo train (6). The purpose of this study was to optimize the fast recovery 3D fast spin-echo sequence at 3 T for the imaging of the inner ear.
Methods
All imaging was performed with a 3-T whole-body MR imager (Medspec S300 with Paravision version 2.01 software; Bruker, Ettlingen, Germany). This unit is equipped with a local head-gradient coil system (30 mT/m, slew rate of 200 mT/m/ms). A receive-and-transmit quadrature head coil was used. Sequence optimization was performed by using a polyvinyl alcohol phantom, which has T1 and T2 values similar to those of human brain tissue, a distilled water phantom, and four healthy volunteers.
The contrast-to-noise ratio between CSF and the cerebellum was measured at the level of the internal auditory canal. The specific absorption rate limitation for the head was set at 3 W/kg. The parameters below were varied to determine the optimal values.
Phantom Study
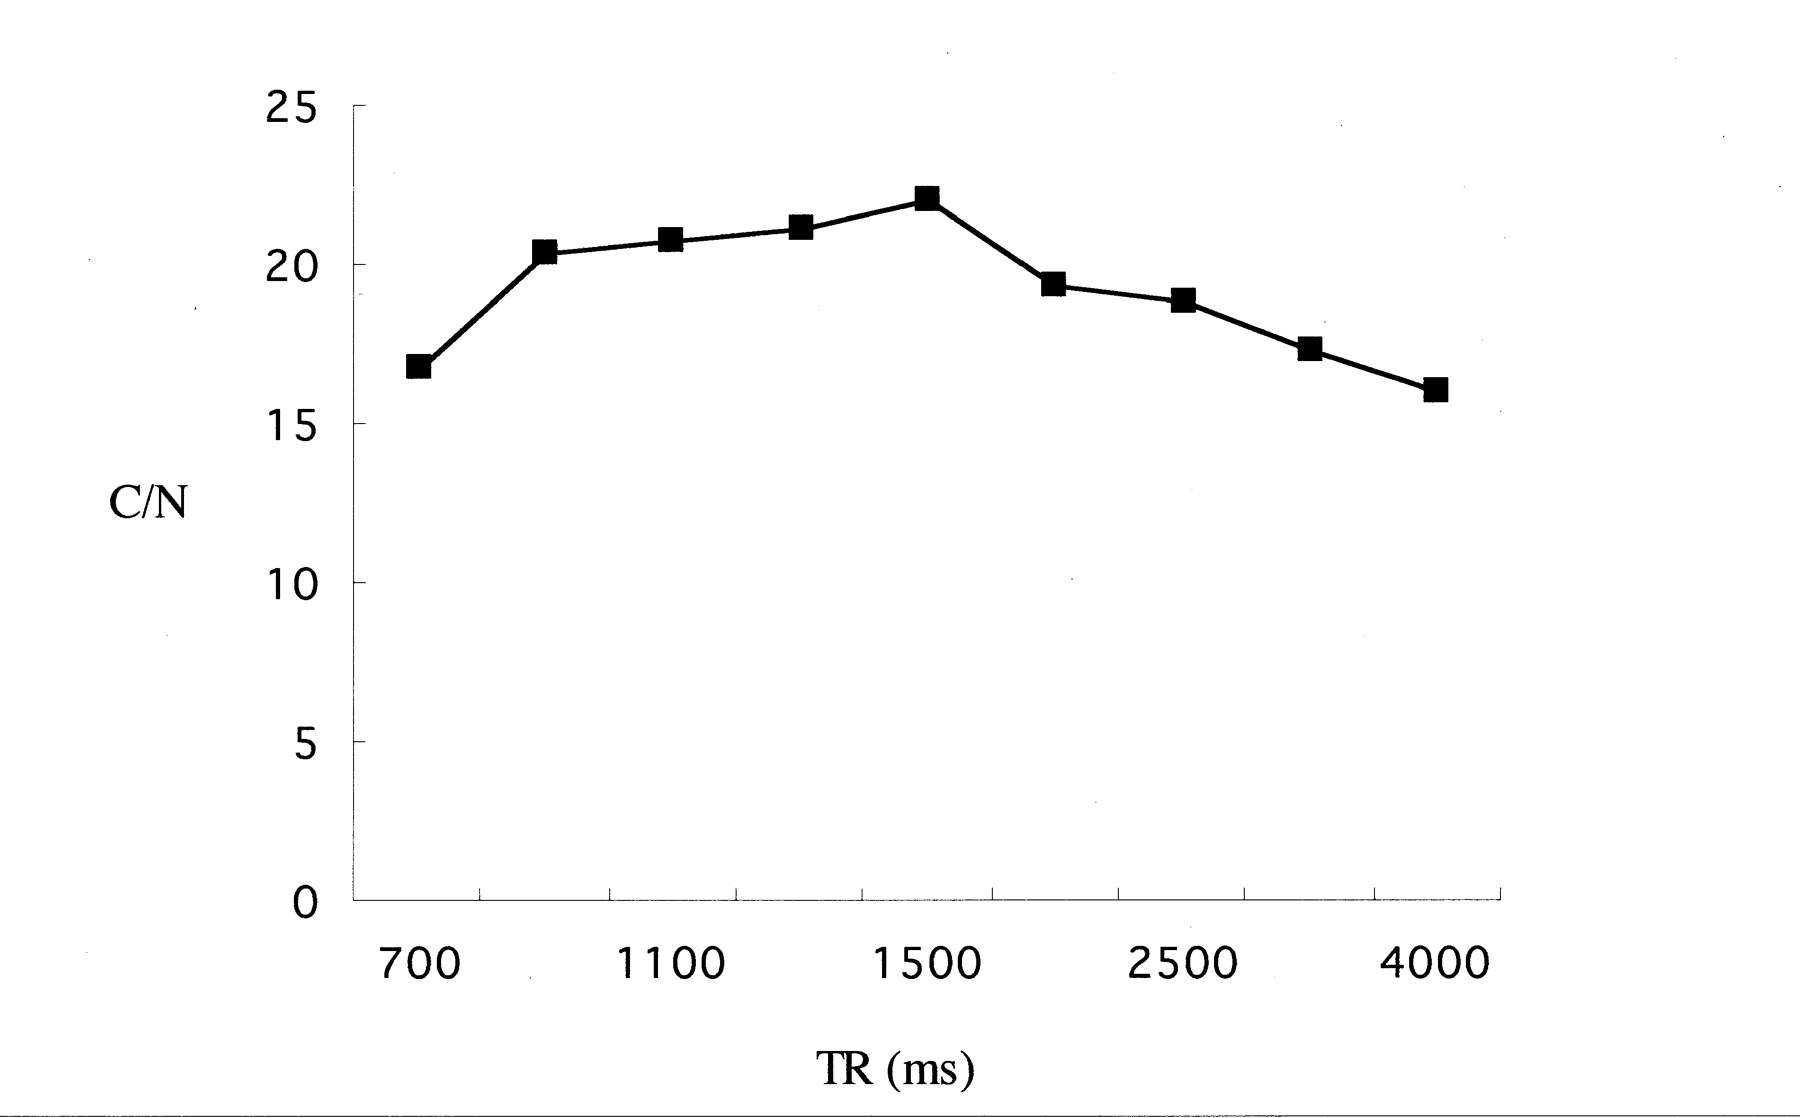
By using a TE of 294 ms and an echo spacing of 18.1 ms, the phantom was imaged with various TR values: 700, 900, 1100, 1300, 1500, 2000, 2500, 3000, and 4000 ms. The contrast-to-noise ratios between polyvinyl alcohol and distilled water in a given time were evaluated.
Volunteer Study
At a TR of 1500 ms, images were obtained of a volunteer, with and without a fast recovery pulse. The effective TE was set to 72, 144, 217, 294, 325, and 390 ms, with the TR set to 1500 ms. The receiver bandwidth was set to 38, 60, 84, 100, and 120 kHz at a TR of 1500 ms, a TE of 294 ms, and an echo spacing of 18.1 ms. The echo spacing was set to 18.1, 20, 22, 24, and 26 ms.
To ensure sufficient coverage of the inner ear apparatus bilaterally, a 5-cm-thick axial slab was obtained. The section thickness was 0.8 mm, the field of view was 16 × 14 cm, the matrix size was 512 × 256, the voxel size was 0.3 × 0.58 × 0.8 mm, and the echo train length was 32.
Results
Phantom Study
The contrast-to-noise ratio in a given time was plotted versus TR, as shown in Figure 1. The maximum contrast-to-noise ratio was obtained at a TR of 1500 ms.

Contrast-to-noise (C/N) ratio between the polyvinyl alcohol phantom and water with various TR values. The highest contrast-to-noise ratio between polyvinyl alcohol and water was obtained at a TR of 1500 ms. A TE of 294 ms and an echo spacing of 18.1 ms were used in this experiment.
Volunteer Study
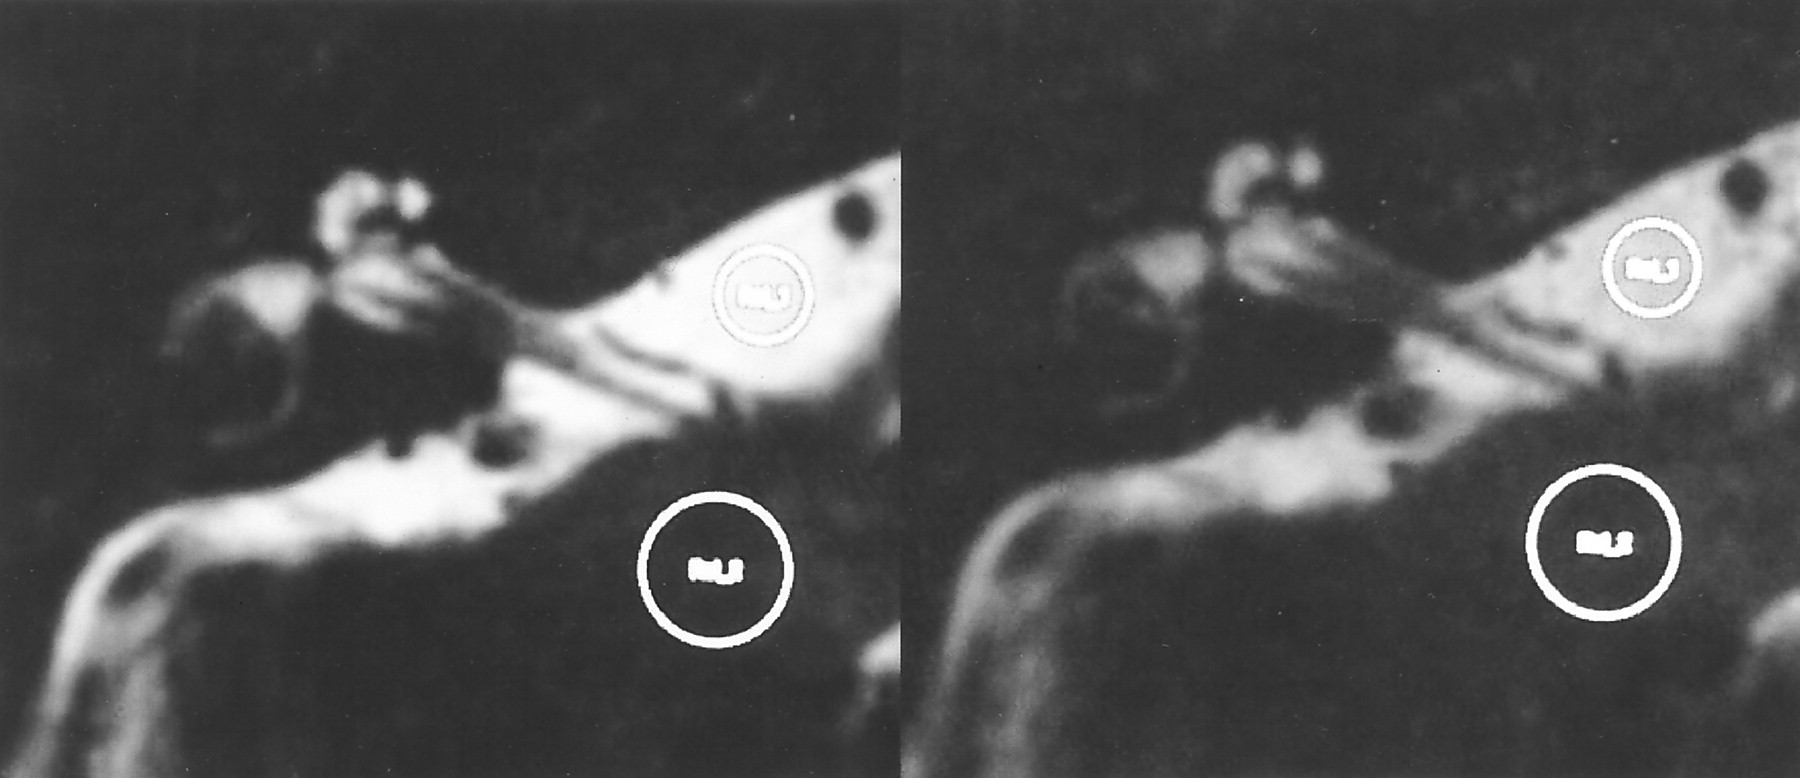
At a TR of 1500 ms, the contrast-to-noise ratios obtained in images with a fast recovery pulse were 1.69 times higher than those in images without a fast recovery pulse (Fig 2). A TR of 1500 ms, an echo spacing of 18.1 ms, and an effective TE of 294 ms, which was the center of the echo train length, provided images with the fewest artifacts (Fig 3). At a TR of 1500 ms, a TE of 294 ms, and an echo spacing of 18.1 ms, the minimum bandwidth of 38 kHz (which is the smallest value compatible with the spatial resolution stated above) provided the highest contrast-to-noise ratio (Fig 4). Longer echo train spacing allows the use of a narrower bandwidth, with the penalty of prolongation of the effective TE if the effective TE at the center of the echo train length is selected. At a TR of 1500 ms, the shortest echo spacing of 18.1 ms provided the highest contrast-to-noise ratio (Fig 5).

Comparison of images obtained with (left) and without (right) a fast recovery pulse in a volunteer. The contrast-to-noise ratio in the image with a fast recovery pulse is 41.1 and in the image without a fast recovery pulse is 24.3. This image was obtained with a TR of 1500 ms and a TE of 243.8 ms. The circles in the images indicate the regions of interest for CSF in the cistern and cerebellum.

Images with various TE values. Effective TE values were set at 72 (A), 144 (B), 217 (C), 294 (D), 325 (E), and 390 (F) ms. The TR was set at 1500 ms, and the echo spacing was set at 18.1 ms. The image with the effective TE of 294 ms, which was the center of the echo train length, provided the fewest ghost artifacts while maintaining a high contrast-to-noise ratio between neural tissue and CSF.

Contrast-to-noise (C/N) ratios at various bandwidths. The narrowest bandwidth compatible with the spatial resolution, an echo spacing of 18.1 ms, a TR of 1500 ms, and a TE of 294 ms, showed the highest contrast-to-noise ratios.

Contrast-to-noise (C/N) ratios at various echo spacing values. Wider echo spacing permits a narrower bandwidth, but the effective echo time is prolonged if the center of the echo train length is selected as the effective TE to prevent blurring and ghost artifacts. At a TR of 1500 ms, the highest contrast-to-noise ratio was obtained with an echo spacing of 18.1 ms and a bandwidth of 38 kHz.
As the final result, a TR of 1500 ms, a TE of 294 ms, an echo spacing of 18.1 ms, and a bandwidth of 38 kHz (512 readout) were selected as the optimized values. The imaging time was 12 minutes 48 seconds, with an echo train length of 32. Images obtained by using the above parameters are shown in Figure 6.

Images obtained by using optimized parameters in a volunteer.
A, Magnified image of the labyrinth. Internal structures such as the osseous spiral lamina and modiolus are clearly visualized.
B, CSF in the prepontine cistern and cerebellopontine angle cistern shows high signal without significant signal loss.
Discussion
In this study, an echo train length of 32 was used, although 64 may also have been applicable if the specific absorption rate limitation had been cleared by reducing the flip angle of the refocusing pulses. The half-Fourier technique was not used in this study. The combination of 3D fast spin-echo and half-Fourier imaging has been proved to be successful at 1.5 T (7). These two points should be further investigated in the future.
Gradient-echo–based sequences, such as constructive interference in steady state (8), segment-interleaved motion-compensated acquisition in the steady state (9), and fully balanced steady state coherent (10) sequences, also are used for the imaging of the inner ear region. However, the specific absorption rate of these sequences may be higher than that of 3D fast spin-echo–based sequences (11), and susceptibility artifacts may be more pronounced at 3 T than at 1.5 T.
The development of dedicated surface coils for the inner ear region is also important. Surface coils are usually used only as receive coils, with transmission performed by the whole-body coil. Whole-body coil RF transmission is usually associated with an increase in the specific absorption rate, which may be significant at 3 T.
A future study comparing the images obtained at 1.5 T and at 3 T in terms of structure identification is of interest. The internal structures of the inner ear that were not visualized clearly enough at 1.5 T (12) are expected to be visualized more clearly at 3 T.
Conclusion
The combination of a fast recovery pulse and 3D fast spin-echo permits high-resolution MR cisternography of the inner ear to be performed with a clinically acceptable imaging time, even at 3 T. The application of a longer echo train length and the half-Fourier technique holds promise for future improvements.
- Received June 15, 2001.
- Accepted after revision August 3, 2001.
- Copyright © American Society of Neuroradiology


