
Article Figures & Data
Figures
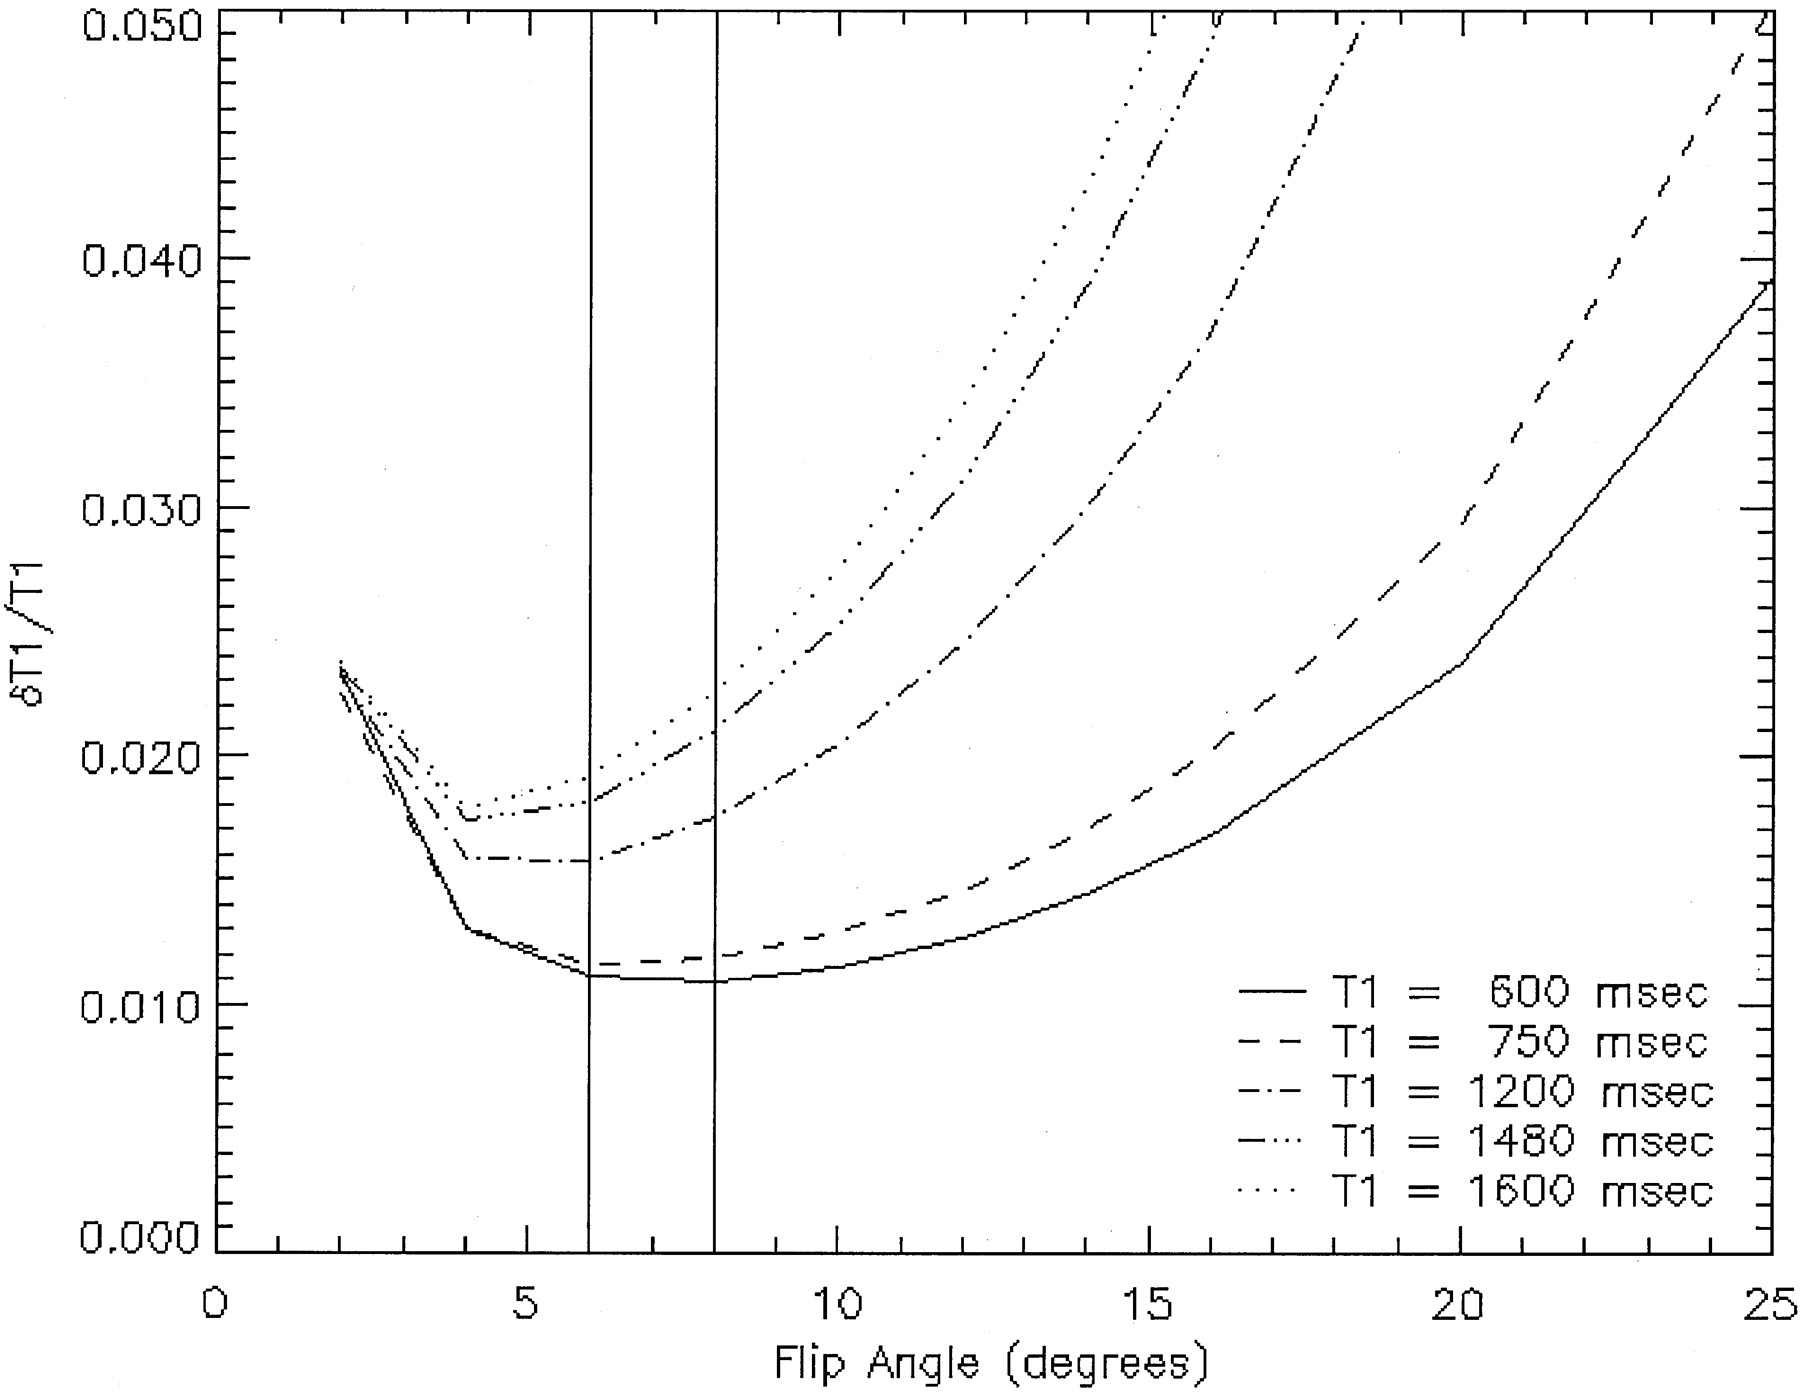
- Fig 1.
Error (δT1/T1) (Appendix A, equation 5) in using different combinations of two flip angles to estimate T1 values. One of the flip angles was fixed at 40 degrees, and a TR of 27 was used. Vertical solid lines indicate the flip angle range that minimizes the error for a T1 value of 600 ms.
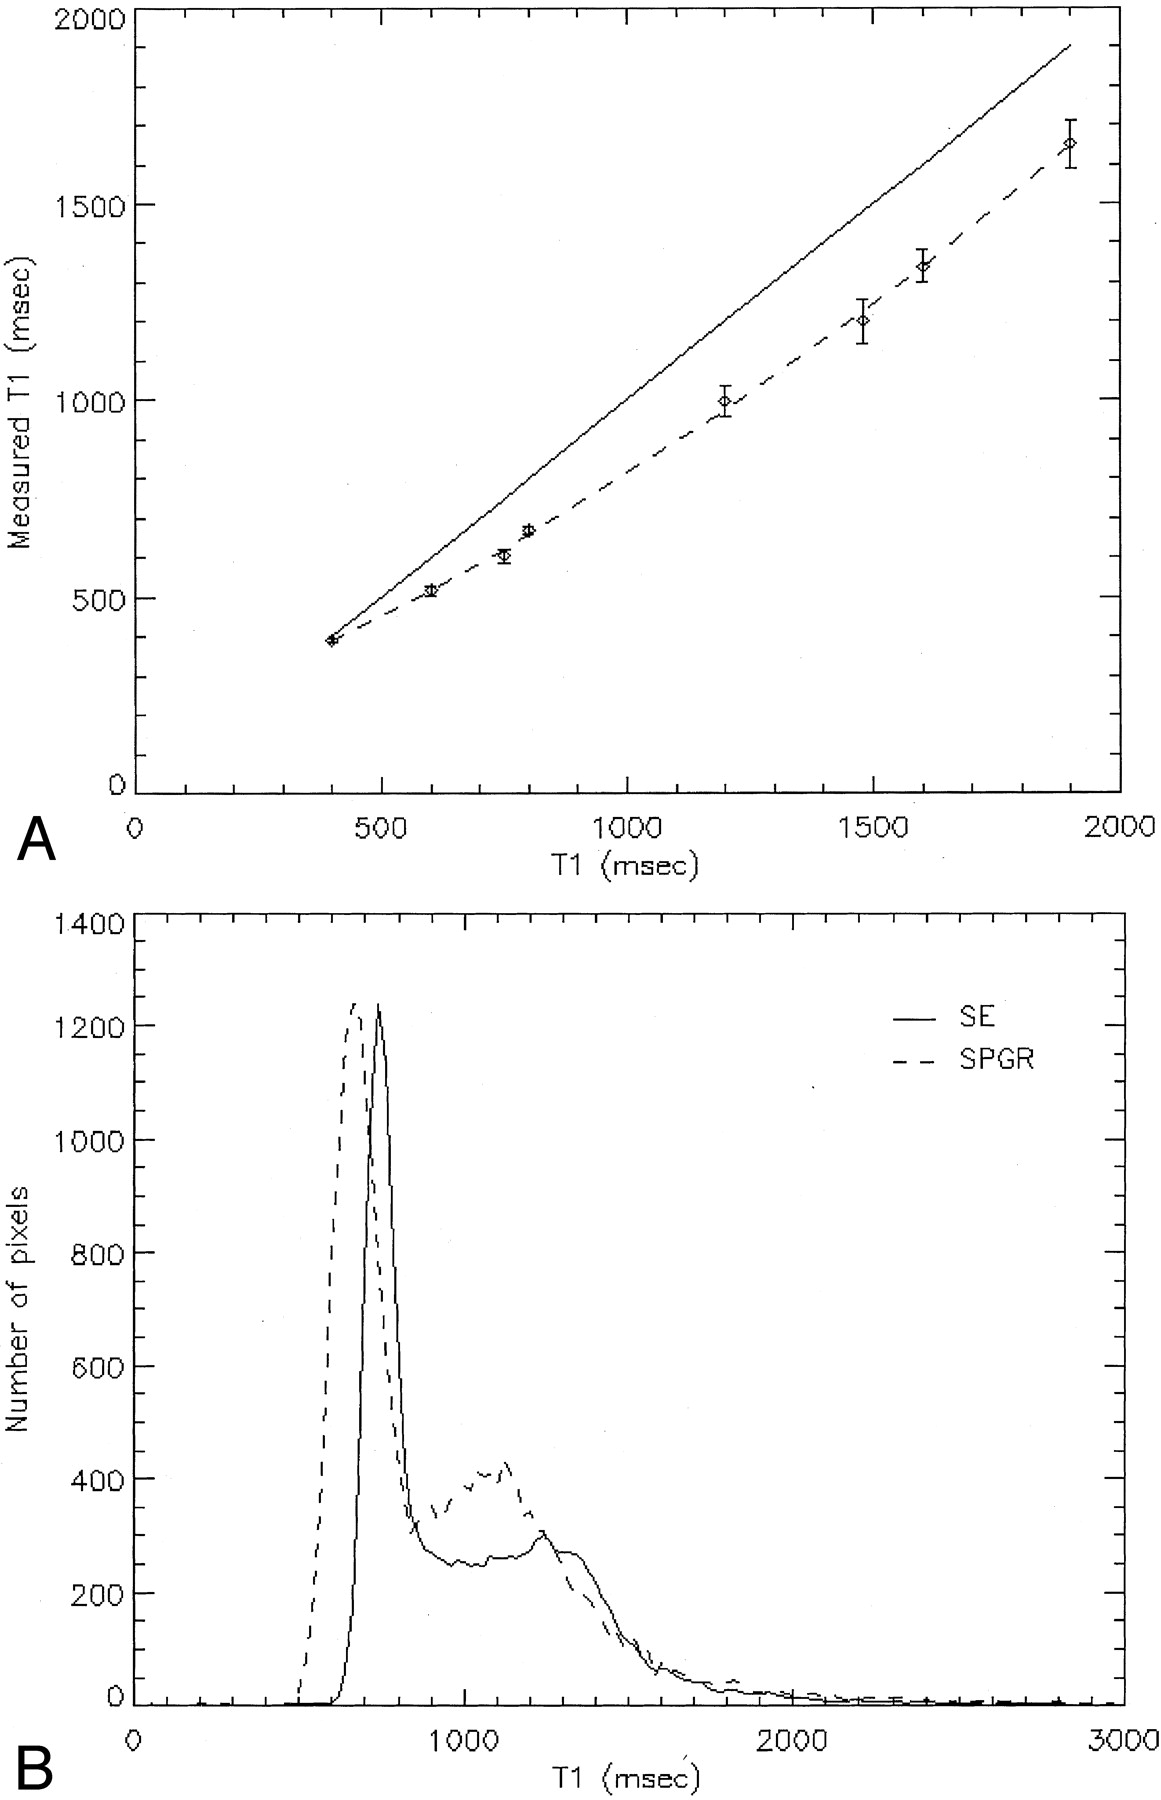
- Fig 2.
Comparison of T1 values from spin-echo and spoiled gradient-echo methods for phantom with spin-echo T1 values in the range of 400 to 1900 ms.
A, This figure shows the T1 estimate derived from the spoiled gradient-echo method (ordinate) for phantoms with different spin-echo T1 values (abscissa). The latter were used as the standard to evaluate the accuracy of the spoiled gradient-echo T1 values. Points are the mean T1 values of a region of interest from the respective phantoms, and error bars represent SD. Solid line represents the ideal situation when the spoiled gradient-echo values are equal to the spin-echo T1 values. Dashed line shows a nonlinear fit through the T1 values estimated with the spoiled gradient-echo method.
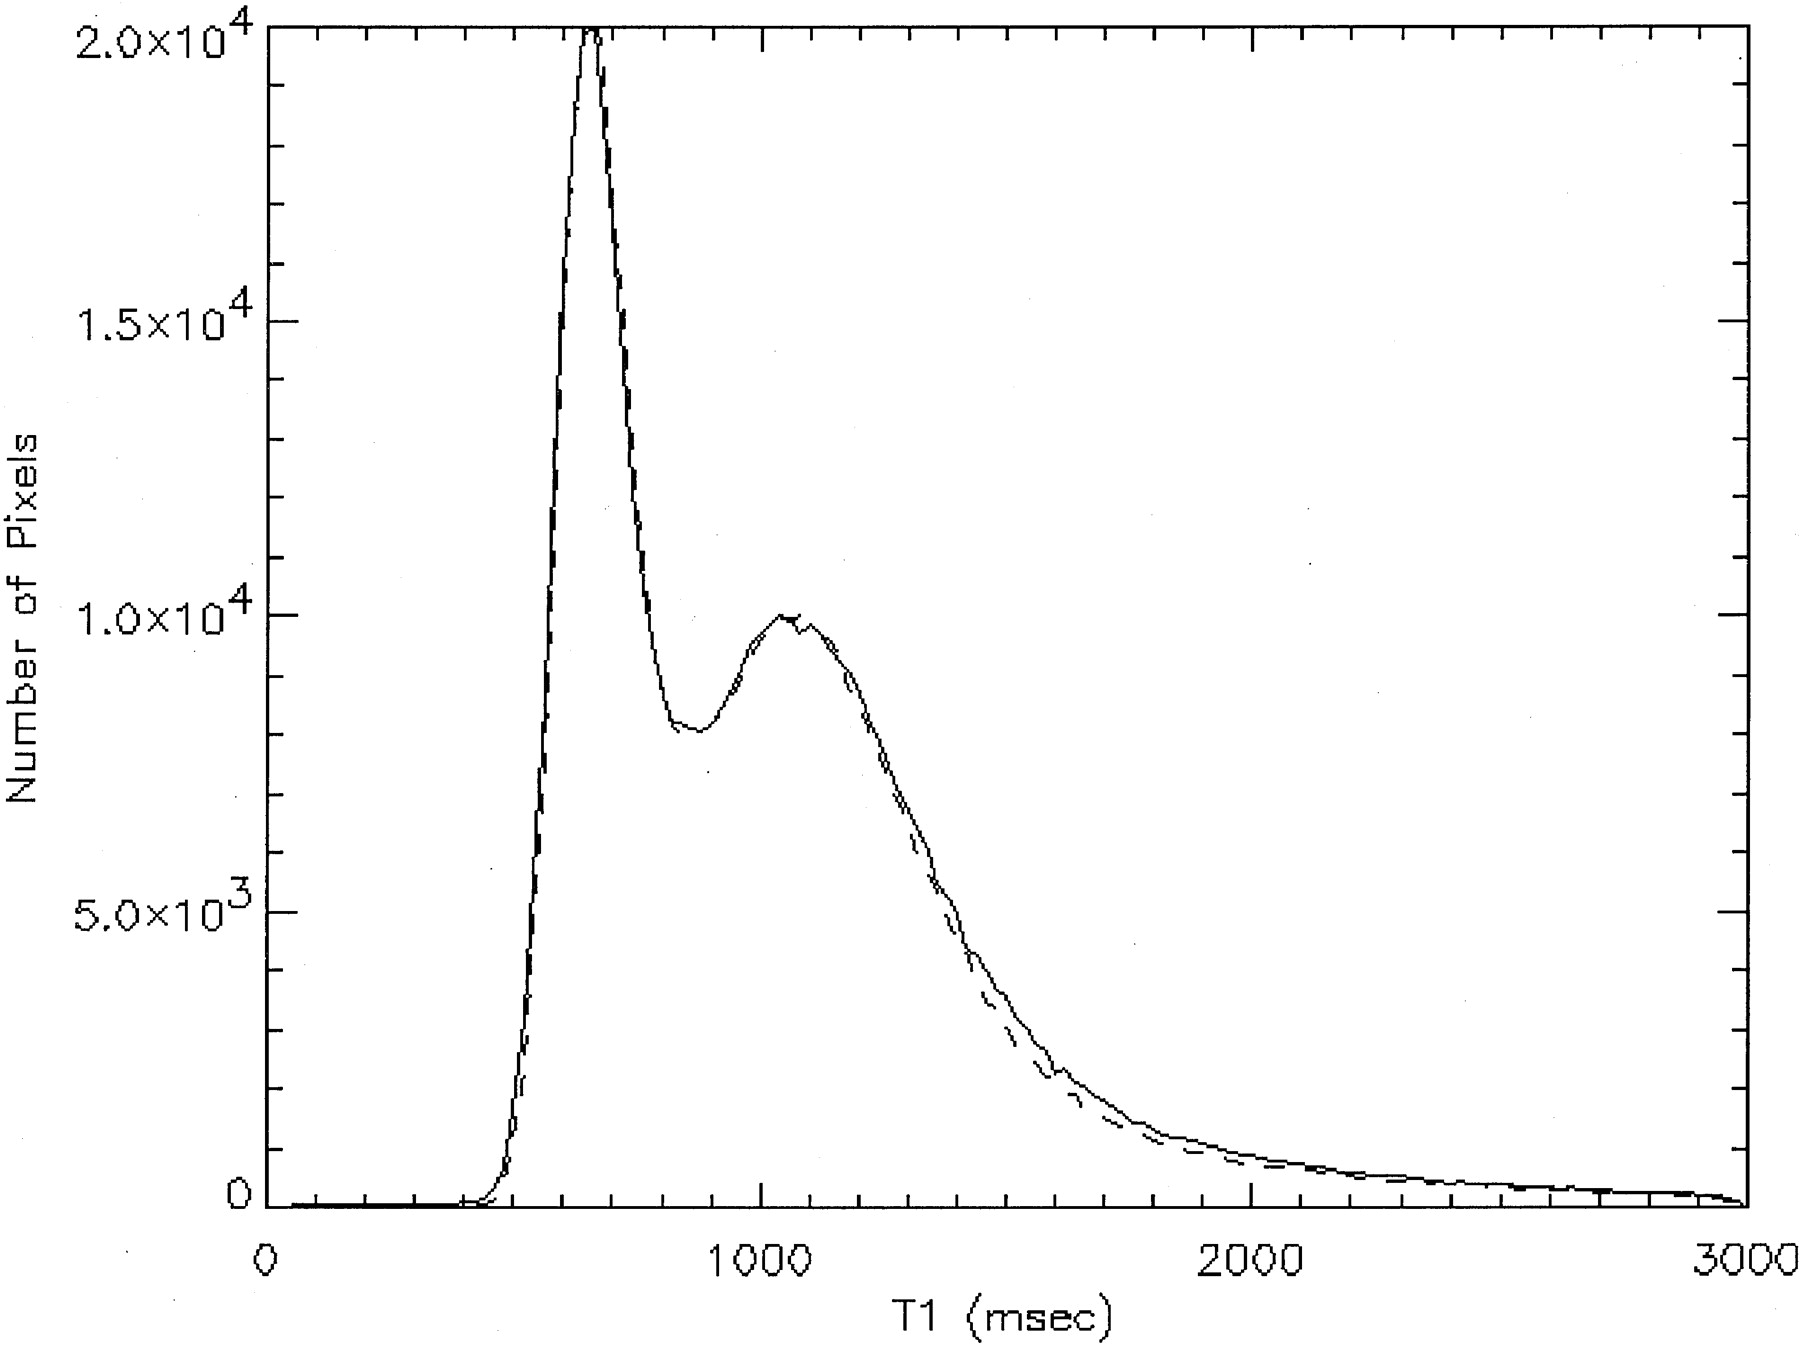
B, Comparison of the T1 distribution from a single section for a normal control participant using the spin-echo (solid line) and spoiled gradient-echo (dashed line) methods.
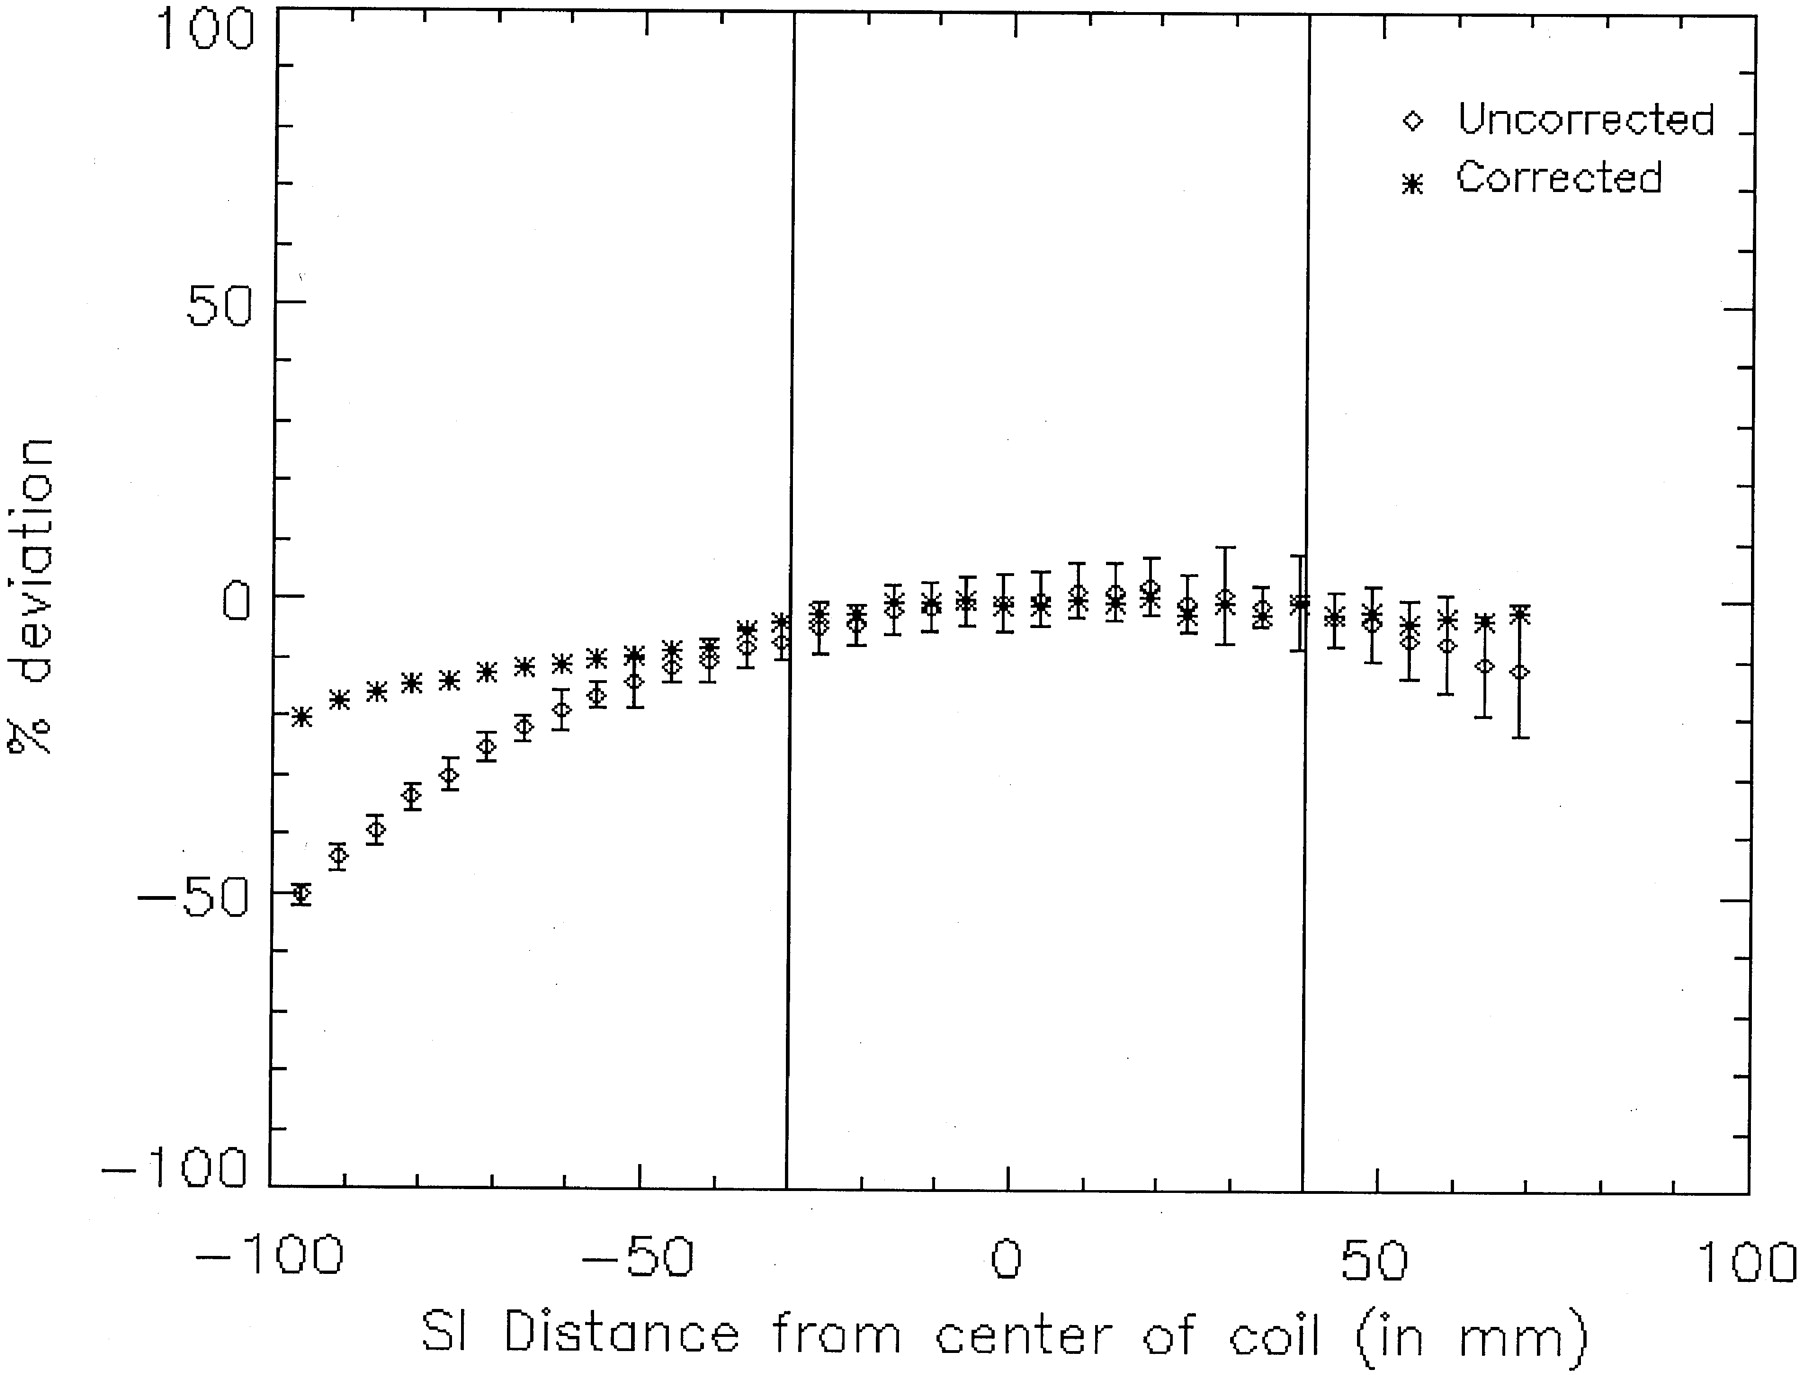
- Fig 3.
Percent deviation of T1 estimates from uniformity along the superior-inferior direction for uncorrected and corrected data. Negative values on the abscissa correspond to inferior section locations. The data were corrected for RF inhomogeneity by using a procedure outlined by Alfano et al (6). Considering that the average distance between the landmark position at niason and the center of the coil was 3 cm and that the size of the brain including the cerebellum is approximately 7 cm, the region of interest (ie, supratentorial brain volume) was contained within the homogeneous region of the head coil (solid lines).
- Fig 5.
Results of the T1 map calculation and segmentation procedure from a normal control participant (upper panel) and a patient with relapsing-remitting multiple sclerosis (lower panel).
A, T1-weighted images.
B, T1 maps.
C, Segmentation into white matter.
D, Segmentation into gray matter.
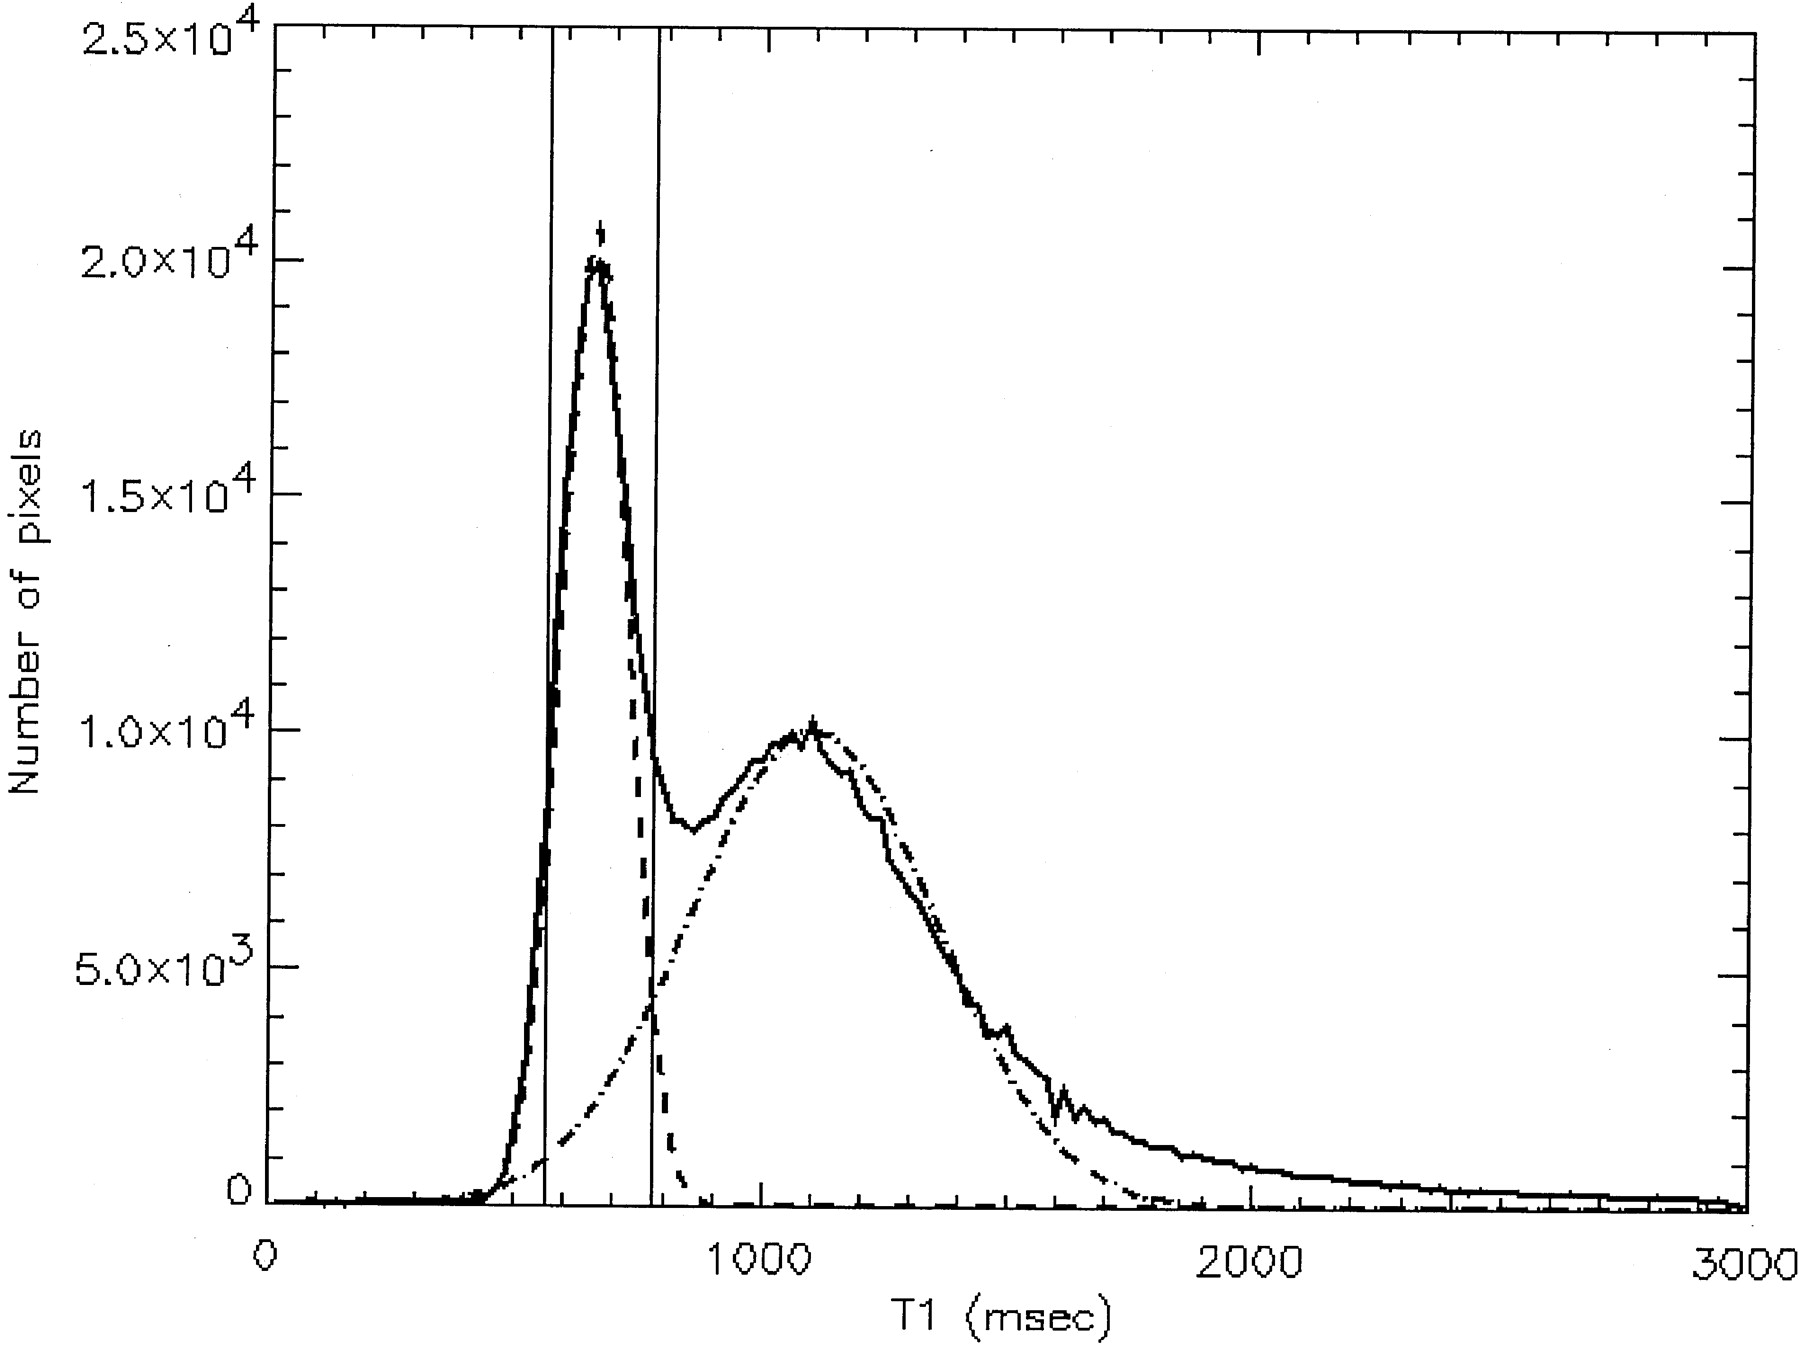
- Fig 6.
T1 distribution for a normal control participant (solid line), segmented into white matter (dashed line) and gray matter (dot-dashed line) components. Vertical solid lines represent the T1 range used to generate the white matter volume.
- Fig 7.
Reproducibility of T1 measurements. T1 distribution for one control participant who underwent imaging multiple times with the 3D spoiled gradient-echo method. Solid line, session 1; dashed line, session 2.
- Fig 8.
Comparison of T1 distributions between control participants (solid line) and all patients with multiple sclerosis (dashed line) in each respective subgroup. In each case, the histogram is normalized to the control population.
A, Control participants and patients with relapsing-remitting multiple sclerosis.
B, Control participants and patients with secondary progressive multiple sclerosis.
C, Control participants and patients with primary progressive multiple sclerosis.


Tables
Group n (M/F) Age (SD) (yr) Disease Duration (yr) Control 20 (9/11) 46.1 (9.3) RRMS 11 (4/7) 43.9 (11.5) 12.7 (8.9) SPMS 13 (6/7) 49.7 (5.6) 16.5 (6.9) PPMS 8 (4/4) 50.6 (3.6) 11.5 (6.5) All patients with MS 32 (14/18) 47.9 (8.2) 13.8 (7.6) Note.—M indicates male; F, female; RRMS, relapsing-remitting multiple sclerosis; SPMS, secondary progressive multiple sclerosis; PPMS, primary progressive multiple sclerosis; MS, multiple sclerosis. Relapsing-remitting multiple sclerosis and secondary progressive multiple sclerosis were defined by the Poser criteria (13). Primary progressive multiple sclerosis was defined by a progressive clinical worsening from onset for 12 months or more with no episode of acute neurologic exacerbation.
- TABLE 2:
Coefficient of variation of the T1 metrics obtained from multiple T1 measurements from eight normal control participants
n = 8 White Matter Gray Matter Relative Height Relative Distance White Matter Fraction Position Width Position Width Coefficient of variation 1.0 3.8 1.1 3.2 2.7 2.5 3.9 Note.—The metrics computed were white matter and gray matter peak positions and widths, relative height (height of white matter/height of gray matter), and relative distance (gray matter position − white matter position).
- TABLE 3:
Comparison of T1 metrics between control participants and patients with multiple sclerosis
White Matter Gray Matter Relative Height Relative Distance Position Width Position Width Control participants 667 70 1077 233 2.26 409 All patients with MS 722 83 1090 207 2.05 367 P values <0.001 <0.001 0.33 <0.001 0.003 <0.001 RRMS and SPMS 714 79 1088 212 2.02 373 P values <0.001 0.001 0.38 0.002 0.002 <0.001 Note.—The two-tailed Student’s t test with unequal variance is used to derive statistical significances (P values). MS, multiple sclerosis; RRMS, relapsing-remitting multiple sclerosis; SPMS, secondary progressive multiple sclerosis.


