
Abstract
BACKGROUND AND PURPOSE: Patients with Alzheimer disease (AD) have more low-frequency activity on conventional EEG and increased focal magnetoencephalographic (MEG) dipole density (DD) in delta and theta bands. This activity concurs with atrophy and reduced metabolic and perfusion rates, particularly in temporoparietal structures. The relationship between functional and structural measures and their conjoined capability to improve the diagnosis of AD were assessed in this study.
METHODS: Whole-head MEG recordings were obtained in 15 patients in whom the diagnosis of AD had been made and in 16 healthy control subjects during a resting condition. MR imaging volumetric data were also obtained; these included global cerebral, temporal lobe, and hippocampal volumes.
RESULTS: DD in the delta and theta bands was enhanced in the AD group compared with the healthy control subjects. Slow-wave activity differed significantly between the groups in the temporoparietal regions of both hemispheres. Left hippocampal volume was correlated with left temporal and parietal delta DD and left temporal theta DD. A combination of left hippocampal volume and left temporal theta DD enabled correct classification in 87.1% of the patients with AD or control subjects.
CONCLUSION: Results support the predominant role of temporoparietal hypofunction as defined by DD and hippocampal structural deficits shown on MR images in patients with AD. A multidisciplinary perspective of different techniques may improve our understanding of the disease and our diagnostic abilities.
Alzheimer disease (AD) is a complex neurodegenerative disorder that should be investigated from a multidisciplinary perspective. Nevertheless, the most common research procedures rely on the capability of a single technique to distinguish between patients with AD and age-matched healthy control subjects. Several studies demonstrate how functional-metabolic measures (ie, positron emission tomography [PET] or single photon emission tomography [SPECT]) reveal a stable portrait of AD; this includes a prominent pattern of temporoparietal (association cortex) and, eventually, hippocampal hypometabolism-hypoperfusion (1–7). For instance, the sensitivity of SPECT in distinguishing patients with AD reportedly ranges from 43% to 100% (5, 8). This broad range depends on the diagnostic criteria and the severity of the disease, with more severe disease being identified more easily.
Similar findings appear in EEG recordings. Here, an increase of slow activity, usually focused in the temporoparietal regions (9, 10), together with decreased activity in the alpha band, are considered the prototypical characteristics of AD (11). Jonkman (12) performed an exhaustive review of the accuracy of EEG in distinguishing patients with AD from control subjects from 16 reports published between 1983 and 1995 and found that the rate of correct identification ranges from 54% to 100%, with a median of 81%.
This high variability can also be found in MR imaging studies. MR imaging-based volumetric measurements seem to be among the most promising clinical tools for distinguishing patients with AD from healthy control subjects (13–16). In this case, a reduced temporoparietal and hippocampal formation volume is considered the key feature in AD. Some authors (17), emphasize the role of temporal and parietal volumes; but hippocampal, entorhinal, and parahippocampal volumes usually allow better discrimination. Juottonen et al (16) reported a sensitivity of 80% by using the volumes of left and right hippocampi and a sensitivity of 94% when entorhinal cortices were included. In a more recent study, Killiany et al (17) obtained a discriminant function in which the volume of the entorhinal, superior temporal, and anterior cingulate cortices achieved a mean accuracy of 93%.
This state of the art suggests that isolated techniques, although certainly helpful, still cannot be used to establish a definite diagnosis of AD. As an alternative, some authors try to combine functional (PET-SPECT) measures with EEG or structural data (MR imaging) to improve the identification of AD. Yamaguchi et al (18) found significant correlations between the degree of hippocampal atrophy and the regional metabolic rate for glucose in the temporoparietal-occipital region. Buchan et al (9) reported significant negative correlations between a slow to fast EEG activity ratios (which represent the degree of slowing of the background EEG) and the regional metabolic rate for oxygen in left parietal and left and right temporal lobes. EEG findings are also correlated with the regional cerebral blood flow, with lower temporal and parietal activity associated with a decrease in alpha activity (19).
The EEG findings represent a measure of the excitatory and inhibitory postsynaptic potentials detected over the scalp. Therefore, this technique offers a highly valuable approach for assessing the pathologic neuronal changes of AD, with the exception of its lack of spatial resolution. EEG-based source localization is cumbersome, and its precision limited. These problems can be overcome with magnetic source imaging (MSI), which combines high temporal and high spatial resolution in the detection of focal neural activity (20, 21). To our knowledge, Fernández et al (22) reported the first data in which clear focal temporoparietal slow-wave activity in patients with AD was revealed by means of MSI. Moreover, this slow-wave activity was predictive of the cognitive and functional status of the patients.
Advancing this theme, MSI data have now been correlated with anatomic scores from the same sample. First, the group differences in global cerebral, hippocampal, and temporal volumes are analyzed; then the degree of correlation between increased slow-wave activity and anatomic volumes are calculated; and finally, the discrimination capability of a conjoined set of variables is determined.
Following the literature, two hypothesis are posed: 1) A strong negative correlation exists between focal temporoparietal slow-wave generators and temporal and hippocampal levels of atrophy, and 2) discrimination between control subjects and patients with AD is improved by using a combination of functional and structural variables.
Methods
Subjects
Fifteen patients fulfilling the National Institute of Neurological and Communicative Disorders and Alzheimer’s Disease and Related Disorders (23) criteria of probable AD and 16 age- and sex-matched control subjects recruited from the geriatrics unit of the Hospital Universitario San Carlos de Madrid, Spain, participated in the study. All subjects underwent general medical, neurologic, psychiatric, and psychological examinations and participated in neuroimaging studies. Patients with antecedents of post-traumatic or ischemic lesions were excluded from the study. Before the MEG recording, all subjects or legal representatives (of demented patients) provided written informed consent after we explained the technical and ethical considerations of the technique. The study was approved by the ethics committee of the Hospital Universitario San Carlos.
All subjects underwent three additional tests: functional assessment staging test (24) to evaluate their functional states, the cognitive portion of the Cambridge Examination for Mental Disorders of the Elderly (25) and the Spanish version of the Mini Mental State Examination (26) to assess their cognitive function. Table 1 summarizes the demographic data and cognitive and functional status of the subjects.
Demographic data and cognitive and functional status of the sample
MEG Data Collection and Analysis
MEG data were measured by using a 148-channel whole-head magnetometer (Magnes 2500 WH; 4D Neuroimaging, San Diego, CA) during a 10-minute resting period. Recordings were obtained with the subjects lying down, and they were asked to stay awake and to avoid head and eye movement by fixing their gaze on a black point on the ceiling. To avoid and control drowsiness effects, subjects’ behavior and level of consciousness was monitored during the entire recording by using a video camera. The MEG was recorded with a 678.17-Hz sampling rate by using a band-pass filter of 0.1–200 Hz. Eye movements were recorded from four electrodes attached to the left and right outer canthus and above and below the left eye. The electrocardiogram was monitored with electrodes attached to the right collarbone and to the lowest left rib. Each 10-minute data set was decimated (which consisted of filtering the data to be consistent with Nyquist criteria [27], followed by a downsampling by a factor of 16). The band-pass was filtered before the analysis in the delta (1.5–4.0-Hz) and theta (4.0–8.0-Hz) bands. Dipole density (DD) was estimated on the basis of an equivalent current dipole in a homogeneous sphere calculated for each time step.
Artifact-free time segments of varying lengths were determined by visual inspection. Single equivalent dipoles were fitted for each time point in the selected epochs. The location of activity sources was computed with reference to a Cartesian coordinate system defined by a set of three anatomic landmarks (fiduciary points): the right and left external meatus and the nasion. The position of the magnetometers relative to the subject’s head was precisely determined by using five coils, three of which were attached to the fiduciary points and two to the forehead. The coils were activated briefly at the beginning of the recording session and again at the end, and their precise location in three-dimensional space was determined by using a localization algorithm built into the system. During the recording session, a fiberoptic motion detector was used to ensure that the subjects’ head did not change position relative to the sensor.
Only dipole fit solutions at time points with a root mean square over 100 fT and a goodness of fit over 0.90 were accepted for further analysis. Root mean square was determined by using the equation RMS = √1/nΣxi2, where n represents total number of data points and xi, measured field value in each data point. For statistical analysis, the total brain volume was divided into 10 regions representing the frontal, parietal, prefrontal, temporal, and occipital areas in both hemispheres, and the number of successful dipole fits was determined for each of these regions (28). The total number of dipoles per second that fit the criteria in the delta and theta bands was determined for each subject and region. To avoid the possible influence of the individual time-segment lengths over the DD scores, the raw number of dipoles per region was normalized by using the following equation: Number of dipoles per second = raw number of dipoles/sampling rate × absolute number of recorded points, where the absolute number of recorded points is the final number of recorded points after the artifacts are eliminated. This number of dipoles per second per region was the final score used for the statistical analysis.
MR Imaging-Volumetry
High-resolution three-dimensional (3D) volume images were acquired from each subject with a 1.5-T unit (Signa; GE Medical Systems, Milwaukee, WI). T1-weighted images (TR/TE/NEX, 14.6/3.1/1; flip angle, 15°) were obtained by using gradient-echo (3D-SPGR) sequences with a field of view of 22 × 16.5 cm, a 256 × 194 matrix, and 1-mm section thickness. The entire brain and skull were covered in the axial plane. The voxel size was 0.7 mm3. The volumetric measurements were performed with the RM Tissue Volume software (GE Medical Systems) running in an Advantage Windows 4.0 environment. Regions of interest on each image were defined by using the Semi-Automatic Volume Segmentation protocol (3SAVS) that is part of the software. This software allows the user to draw a region of interest in each section with the mouse, assisted by border attraction and 3D automatic paint tools, and to measure the volume of the painted region (in cubic centimeters). After the measures are obtained, the software allows the operator to gather a histogram of the voxel value for the region of interest. The following regions of interest were defined: total cranial volume (TCrV), total cerebral volume (TCV), right hippocampal volume (RHV) and left hippocampal volume (LHV), right (RTV) and left lateral temporal lobe (LTV) volume.
In accordance with the procedure of Kidron et al (15), the entire volume of the brain, including the brain stem and cerebellum, was calculated from the edited brain as an index of the total intracranial capacity. Then, on the lateral surface of the hemispheres, the sylvian fissure was traced, and the parieto-occipital fissure and the preoccipital notch were identified and joined by a line. A line was drawn from the posterior end of the sylvian fissure to the line joining the parieto-occipital fissure and the preoccipital notch to provide the posterior demarcation of the temporal lobe. Hippocampal anatomic boundaries were defined to include the CA1–CA4 sectors of the hippocampus, the dentate gyrus, and the subiculum. The posterior boundary of the hippocampus was determined by the oblique coronal anatomic section on which the crura at the fornices were identified in full profile. Thus, the entire hippocampus from the tail through the head was included in the measurements.
The ratio of total cerebral to total cranial volume (relative cerebral volume [TCVr]) was then calculated according to the formula: TCVr = TCV/TCrV. In a similar manner, we computed the proportion of the total cranial volume represented by the right (RHVr) and left hippocampal (LHVr), and the right (RTVr) and left (LTVr) temporal volumes. Only relative measures were used in the statistical analyses to control for possible group differences in brain size (29).
For reliability assessment of the MR imaging measures, the agreement of two independent neuroradiologists (J.A.) blinded to the clinical and MEG results was evaluated. The mean difference between the two observers for the left hippocampus was −0.03 (95% confidence interval: −0.14, 0.08) and 0.07 for the right (95% confidence interval: −0.3, 0.1). Similar results were found for the left temporal area, −0.07 (95% confidence interval: −0.11, 0.09) and for the right, 0.09 (95% confidence interval: −0.7, 0.2). Interrater reliabilities were high (left hippocampus, r = 0.99; right hippocampus, r = 0.98; left temporal, r = 0.97; right temporal, r = 0.98).
All the units used for the structural data were cubic centimeters.
Results
Volumetric MR imaging Analyses: Group Effects
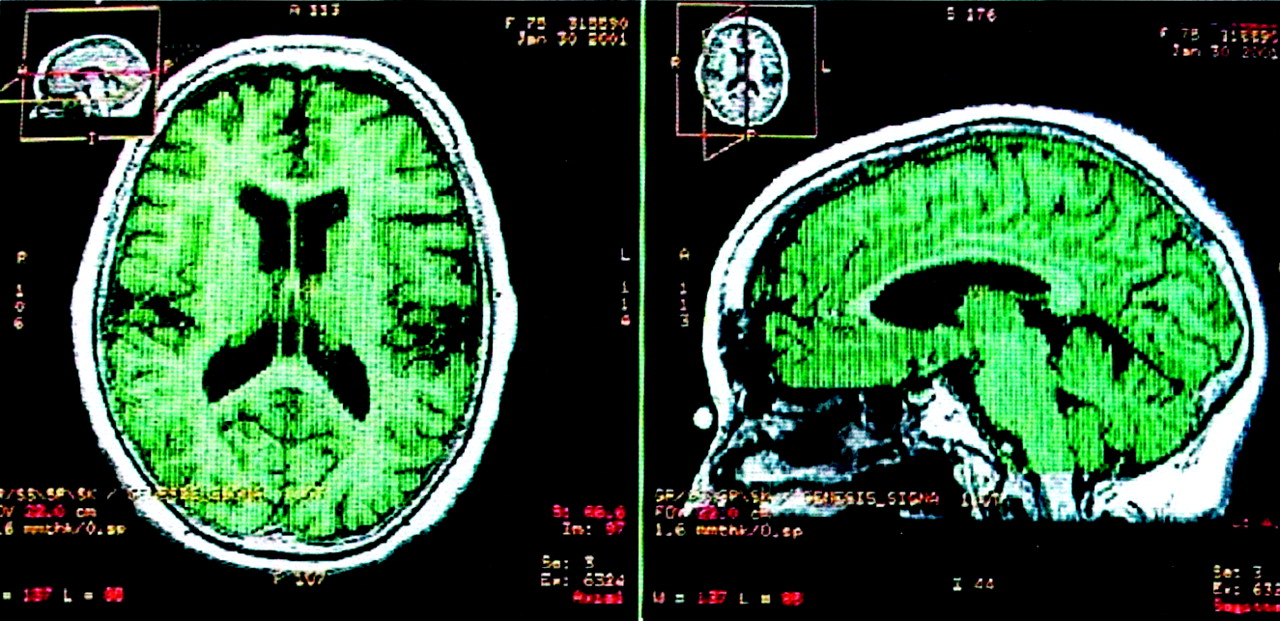
Figures 1 and 2 display the relative cerebral and hippocampal volumes in a patient with AD. A series of mean comparisons (Student t tests) between groups was performed on the MR imaging volumetric variables. Given a total number of five comparisons (TCVr, RHVr, LHVr, RTVr, LTVr), an adjusted α level of 0.05/5 = 0.01 was used to evaluate each t test according to the Bonferroni method. The AD group had lower volumes than the elderly control group in cerebral volume, with these values: t(29) = −4.066, P < .0001; left, t(29) = −6.604, P < .0001; and right hippocampus, t(14) = 5 .255, P < .0001. The two groups did not differ in the other relative volume measures.

T1-weighted MR images display the relative global cerebral volume in a patient with AD in axial and sagittal views. Green represents the final region where the volume calculation was performed.

T1-weighted MR images display the relative hippocampal volume in a patient with AD in the axial and sagittal planes. Green represents the final region where the volume calculation was performed.
Correlation between Volumetric MR Imaging Data and MEG Data
Pearson correlation coefficients were computed between the MR imaging volumetric variables and seven MEG-based activity measures were used that represented the DD sources in the left and right parietal lobes and left temporal lobe for delta band activity and those in the parietal and temporal, both left and right-sided, for theta band sources. These MEG-based variables correspond to the previously defined significant factors that enable a correct discrimination of AD and control subjects (22). Table 2 shows the DD values of the ten regions for delta and theta bands obtained in the previous study. A total of 35 correlation coefficients were computed (between each of the seven MEG variables and each of the five MR imaging variables) and evaluated by using a Bonferroni-corrected α level of 0.05/35 = 0.002. Although a considerable number of negative correlations between the MEG variables and left temporal relative volume, and relative bilateral hippocampal volume were found (Table 3), only three coefficients reached statistical significance: those between relative volume of the left hippocampus and left parietal delta DD, left temporal delta DD, and left parietal theta DD. This observation indicates that the higher the number of low-frequency activity sources in left temporal and parietal areas, the higher the atrophy in the mesial aspects of the left temporal lobe.
Means and SDs of the 10 MEG DD variables for delta and theta bands
Correlation coefficients between MEG and MRI variables
Conjunct Volumetric MR Imaging-MEG Discriminative Capability: Discriminant Analysis
A discriminant analysis including the aforementioned seven MEG and five MR imaging variables was performed to clarify the relationship between two different techniques (ie, volumetric MR imaging and MEG) and their ability to improve the diagnosis of AD.
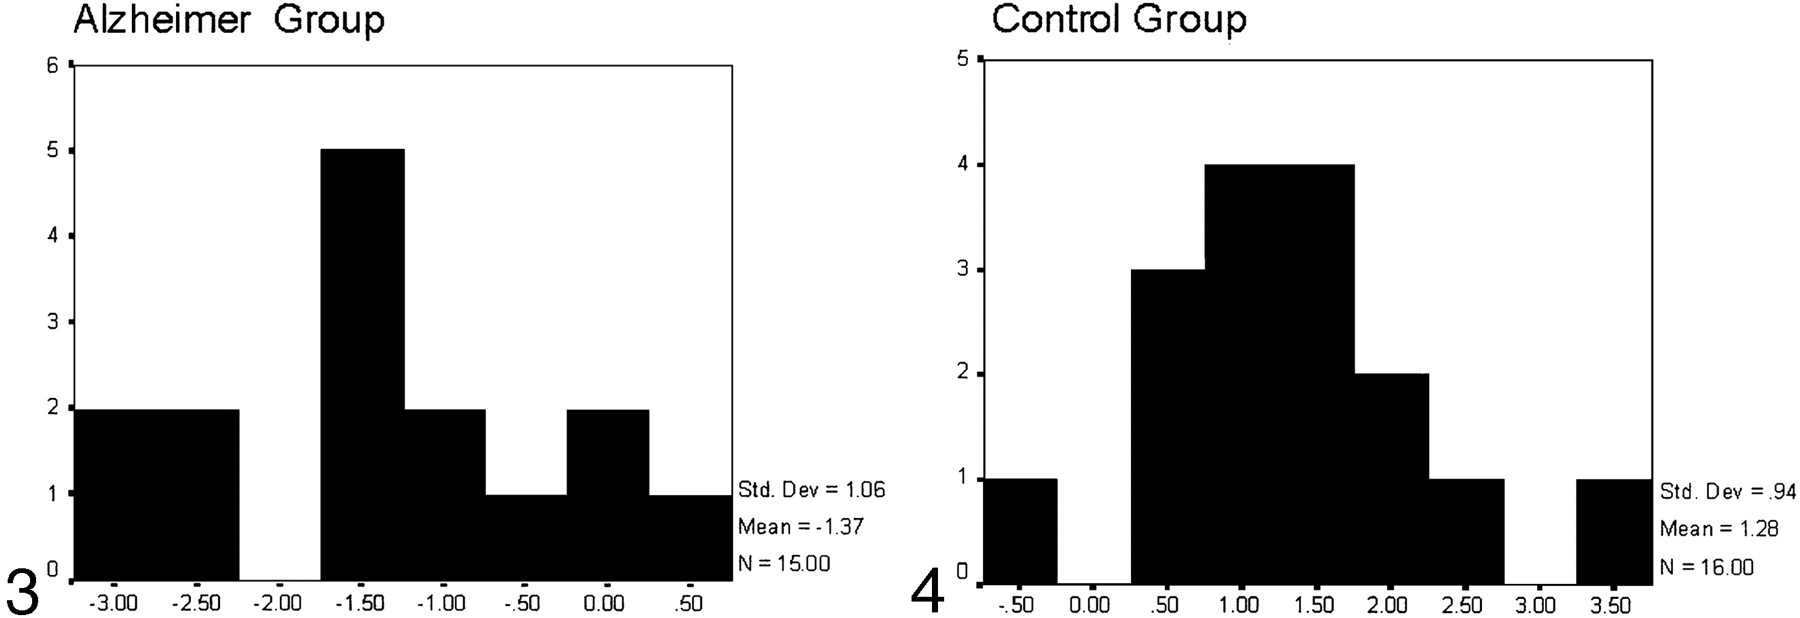
This discriminant analysis was used to classify subjects in the AD or control group on the basis of a discriminant function by using only two variables. In order of entry, the variables were LHVr and left temporal theta DD. Applying the weights obtained from this analysis to the cross-validation sample, three controls and one AD patient were classified incorrectly; the total correct classification rate was 87.1% (Table 4). The formula of the discriminant function obtained in this analysis was expressed in terms of standardized coefficients: Canonical variable = (0.948)LHVr − (0.451)left temporal theta DD.
Results of discriminant analysis classification
Those with canonical scores equal to or greater than 0 were classified as control subjects, whereas those with canonical scores below 0 were classified as patients with AD (Figs 3 and 4).

Histogram representing the results of the discriminant analysis for the Alzheimer group: x axis reflects canonical scores, and y axis reflects the number of subjects who obtained every canonical score. Those with canonical scores below zero were classified as belonging to the AD group; three controls were incorrectly classified within the AD group.

Histogram representing the results of the discriminant analysis for the control group: x axis reflects canonical scores, and y axis reflects the number of subjects who obtained every canonical score. Those with canonical scores greater than zero were classified as controls; one AD patient was incorrectly classified as belonging to the control group.
Discussion
The present results support the previous hypothesis that relative global cerebral and hippocampal volumes are significantly lower in AD groups compared with those in control subjects, whereas the relative temporal volumes do not differ between groups. Global cerebral atrophy (including ventricular and fissural enlargement) is a common finding in AD; it progressively affects the mesial temporal and association areas, sparing the primary motor and sensory cortices (30, 31). However, the atrophy due to normal aging is difficult to distinguish from the specific atrophy due to AD, and this difficulty explains part of the contradictory findings reported in the literature. Ohmishi et al (32) performed one of the most detailed analyses of the age-related cerebral volume decline versus AD-related cerebral volume decline. Healthy volunteers had a clear age-related decrease in the volumes of the prefrontal cortex, insula, anterior cingulate gyrus, superior temporal gyrus, and inferior parietal lobule. The authors considered that these changes may promote some cognitive alterations during normal aging, but only a significant bilateral reduction of gray matter volume in the hippocampal formation and entorhinal cortex explained the pathologic characteristics for AD and definitively defined this group. Many different studies support the evidence of the hippocampal atrophy as the critical structural feature of AD, even during the earliest stages of the disease (33–36). This hippocampal deficit is usually accompanied by entorhinal, perirhinal, amygdalar, or parahippocampal alterations (17, 36) that contribute to the role of the mesial temporal lobe (MTL) in the diagnosis of AD.
Our data support these findings, not only because relative hippocampal volumes reflect substantial differences between the groups but also because only these volumes were significantly correlated with low-frequency temporoparietal DD. As described before, hippocampal atrophy is correlated with temporoparietal-occipital hypometabolism (18). Additionally, mirroring the results of Dierks et al (10), who consider glucose metabolism and neuroelectric activity to be reflections of synaptic activity, and those of Buchan et al (9), a strong correlation between focal temporoparietal low-frequency neuromagnetic activity and hippocampal atrophy could be predicted as well. Although EEG (37) or even MEG (38) investigations may provide congruent data, the findings seem to be anatomically less precise.
The primary consideration emerging from comparison of the present results and those in the previous literature is that three brain regions represent the most common anatomic landmarks affected by AD: the mesial temporal, the temporal, and the parietal lobes. MTL atrophy is probably the most sensitive measure in the structural approach, and it may be useful in detecting AD-specific alterations, even in the earliest stages of the disease. Temporoparietal hypofunctioning defined by means of metabolic, neuroelectric, or neuromagnetic techniques is the most sensitive functional measure. Moreover, functional and structural data demonstrate strong relationships in many ways; consequently, the combination of both approaches may contribute to better identification of AD.
Discriminant analysis elucidates how a combination of structural (LHVr) and functional (left temporal theta DD) data provides a substantial level of discriminant capability. An 87.1% rate of correct classification is a score superior to the median of 81% observed in singular SPECT or EEG studies (5, 12). Many of these studies involved relatively small numbers of patients. Juottonen et al (16) pointed out that the probability of overlap between control subjects and patients with AD increases with the sample size. They explained this stable effect in terms of the diagnostic weakness of AD. Results of pathologic studies suggest that some neuropathologic changes (including atrophy and neural hypofunctioning) might appear before the clinical diagnosis is made; therefore, the overlap could be due to an incipient AD in some control subjects. In fact, our results might confirm this hypothesis because the main source of classification error is derived from three control subjects who were incorrectly classified as having AD. As previously demonstrated (22), low-frequency DD is strongly correlated with the neuropsychological data and partially explains their variability. Control subjects with lower cognitive and functional scores present with higher levels of low-frequency activity, and therefore, the risk of misclassification among these individuals increases.
The origin of the strong relationship between the structural integrity of the MTL structures and the functional status of temporoparietal areas in AD remain to be explained. We suggest two different but closely related explanations: First, AD is a pervasive degenerative disease in which MTL alterations are often, but not always, considered the preliminary manifestations. With disease progression, temporoparietal and, eventually, frontal regions are affected (33). However, the interindividual variability in the evolution of the disease, and some technical limitations, may contribute to the fact that different studies help in detecting different stages of the same process given the unique sensitivity of each technique. On the other hand, Killiany et al (17) and Lavenex and Amaral (39) claim that the early degenerative changes in the entorhinal cortex impair critical functional connections between the temporoparietal neocortex and the hippocampal formation. A disconnection between the MTL structures and the neocortical areas in the ipsilateral hemisphere could seriously harm the circuitry of the association cortices in terms of functional activation. Therefore, MTL atrophy and temporoparietal hypofunctioning could be considered complementary pictures of the same involutive process.
Conclusion
The results of this study supports the idea that a combination of complementary techniques (ie, functional MEG and structural MR imaging) and improved clinical diagnosis will improve our understanding of AD and permit better detection of the disease.
Acknowledgments
This study was supported in part by 4-D Neuroimaging. The authors would like to thank to Thomas Murphy for his technical support with MEG.
References
- Received August 6, 2002.
- Accepted after revision September 27, 2002.
- Copyright © American Society of Neuroradiology
In this issue


Jump to section
Related Articles
Cited By...
- Resting-state EEG signatures of Alzheimers disease are driven by periodic but not aperiodic changes
- Pathological Effect of Homeostatic Synaptic Scaling on Network Dynamics in Diseases of the Cortex
- Synchronized delta oscillations correlate with the resting-state functional MRI signal
- Increased occipital delta dipole density in major depressive disorder determined by magnetoencephalography
- Profiles of brain magnetic activity during a memory task in patients with Alzheimer's disease and in non-demented elderly subjects, with or without depression