
Abstract
BACKGROUND AND PURPOSE: A triple-dose (TD) of gadolinium chelate is highly sensitive approach for detecting lesion activity in multiple sclerosis (MS). However, individual TD injections do not provide data on the severity of the pathologic process in a population of lesions, and its clinical use is limited by the cost-benefit considerations. Our aim was to determine whether the use of three subsequent single doses (SD) of a gadolinium chelate in brain MR imaging is useful in detecting MS lesions with different patterns of enhancement.
METHODS: In 10 patients, T1-weighted spin-echo images were acquired before and after three intravenous administrations of 0.1 mmol/kg of gadodiamide.
RESULTS: In all patients, SD images showed six enhancing lesions; double-dose (DD) images, 13; and TD images, 22. Differences between SD and TD and between DD and TD were significant (P < .018). Six lesions (27%) enhanced with all the three doses; seven (32%), with both DD and TD; and nine (41%), with only TD. Proportions of patients with at least one enhancing lesion were, for SD, four of 10; DD, seven of 10; and TD, nine of 10. In defining active disease in these nine patients, we needed only 19 SDs versus the 30 SDs that would have been needed if individual TD injections were used.
CONCLUSION: With three subsequent SD injections, the number of enhancing lesions progressively increases. This approach allows the distinction of three levels of enhancement, and it reduces the amount of contrast agent needed to distinguish patients with active MS from those with nonactive MS.
The use of intravenously administered paramagnetic contrast agent in the MR imaging of multiple sclerosis (MS) is clearly established in clinical practice and in research trials (1–4). In fact, contrast enhancement is considered an excellent marker of the inflammatory activity taking place in MS lesions. It makes the initial diagnosis more reliable (4–6) and provides an objective parameter of the evolution of the disease (2, 7–9).
Increased sensitivity in detecting active lesions with a 0.3-mmol/kg triple dose (TD) of a paramagnetic contrast agent compared with the standard 0.1-mmol/kg single dose (SD) has been already demonstrated in patients with MS (10–19). However, MS plaques that are enhancing with the TD and not with the SD seem to be characterized by a pathologic process less severe than that of lesions enhancing with both SD and TD (20, 21). That is to say, an individual injection of a TD does not provide information about the severity of the pathologic process in a population of lesions. Also, the use of a TD in clinical practice is limited by economic considerations.
The aim of this study was to investigate whether the use of three subsequent SDs of a gadolinium chelate in brain MR imaging is useful in detecting MS lesions with different patterns of enhancement. The combined use of an SD and a TD in different sessions offers this ability, but our approach may do so at a lower cost.
Methods
Ten consecutive patients with relapsing-remitting (7 cases) or secondary-progressive (3 cases) MS were enrolled in the study. They included four men and six women with an age of 38.8 years ± 8.1 (mean ± standard deviation). Informed consent was obtained before they entered the study. Patient data are reported in Table 1.
Brain MR imaging results in 10 patients with MS
In all patients, brain MR images were obtained by using a 1.5-T unit (Magnetom Vision; Siemens Medical Systems, Erlangen, Germany) according to the following protocol: 1) long-line venous access in a cubital vein, 2) acquisition of 24 T1-weighted spin-echo para-axial sections parallel to the bicommissural plane (thickness, 5 mm; gap, 10%; TR/TE/NEX, 792/17/1; pixel size, 0.96 mm2; acquisition time, 2 minutes 35 seconds), 3) injection of an SD of gadodiamide (Omniscan; Amersham Health, Oslo, Norway) followed by a 5-minute waiting time, 4) imaging as before, 5) injection of contrast material as before to obtain a fractionated double dose (DD) 6) imaging as before, 7) injection of contrast material as before to obtain a fractionated TD, and 8) imaging as before.
The imaging session with the SD was initiated 5 minutes after the injection of the contrast agent. Because 2 minutes 35 seconds were needed to acquire the T1-weighted image and because approximately 30 seconds were necessary to enter the MR room and inject the gadolinium chelate, imaging with DD started about 13 minutes after the first injection. Imaging with the TD started about 21 minutes after the first injection and 5 minutes after the third injection. In this way, a high dose of contrast agent and delayed imaging were combined.
Dual-echo (proton density-weighted and T2-weighted) and fluid-attenuated inversion-recovery sequences were also performed between steps 1 and 2 of the protocol to achieve a complete MR examination for clinical purposes.
By consensus, two experienced readers (F.S., A.I.) counted the number of enhancing lesions on the images. The enhancing area and contrast-to-noise ratio (CNR) were measured, on a section-by-section basis and a lesion-by-lesion basis, by using a manual contouring method on a remote MR console. In this way, the mean signal intensity of the lesion (SIlesion) was obtained. The SI of the surrounding area (SIsurrounding) was measured by shifting the contoured area used for the lesion in the nonenhancing surrounding white matter. The standard deviation of the noise (SDnoise) was measured by shifting the contoured area used for the lesion in a region external to the patient’s head, which was free from any artifact (eg, vascular ghosts on the phase axes). Hence, the CNR was calculated as follows: CNR = (SIlesion –SIsurrounding)/SDnoise
By analyzing the data on a lesion-by-lesion basis, the total enhancing area and the mean CNRs per patient and for the 10 patients were also calculated. The proportion of patients with at least one enhancing lesion was obtained. These patients were defined as those having active disease.
Friedman and Wilcoxon nonparametric tests were used for the evaluation of global variability and for post hoc comparisons between the numbers or areas of lesions detected by using the different doses of paramagnetic contrast agent, respectively.
Results
The number of enhancing lesions was six on the SD images, 13 on the DD images, and 22 on the TD images. Overall, 22 lesions were classified as follows: six (27%) enhancing with all the three doses, seven (32%) not enhancing with the SD but enhancing with both the other two doses, and nine (41%) not enhancing with the SD or DD but enhancing with the TD. The total enhancing area was 3.2 cm2 on the SD images, 5.3 cm2 on the DD images, and 7.6 cm2 on the TD images. The mean CNRs were 13.5, 16.2, and 24.3, respectively. These results are also shown in Table 1, which displays the data on a patient-by-patient basis.
Significant differences among SD, DD, and TD images were found for the total number of enhancing lesions (P = .009), the total enhancing area (P = .002), and the CNR (P = .014). With the post hoc comparisons, we found a trend toward significance for the difference in the total number of enhancing lesions between the SD and DD methods. A significant difference was found between the SD and TD approaches, as well as between the DD and TD approaches. For the total enhancing area, significance was reached for all the three comparisons. For CNR, a trend toward significance was found between the SD and DD methods, and a significant difference was found in the two remaining comparisons. P values for all post hoc comparisons are reported in Table 2.
P values from the post-hoc comparisons
The proportion of patients with active disease was four of 10 with the SD, seven of 10 with the DD, and nine of 10 with the TD
In Figures 1 and 2, two typical cases are shown to illustrate the gains in the detection of enhancing lesion and in the conspicuity achieved with DD and TD.

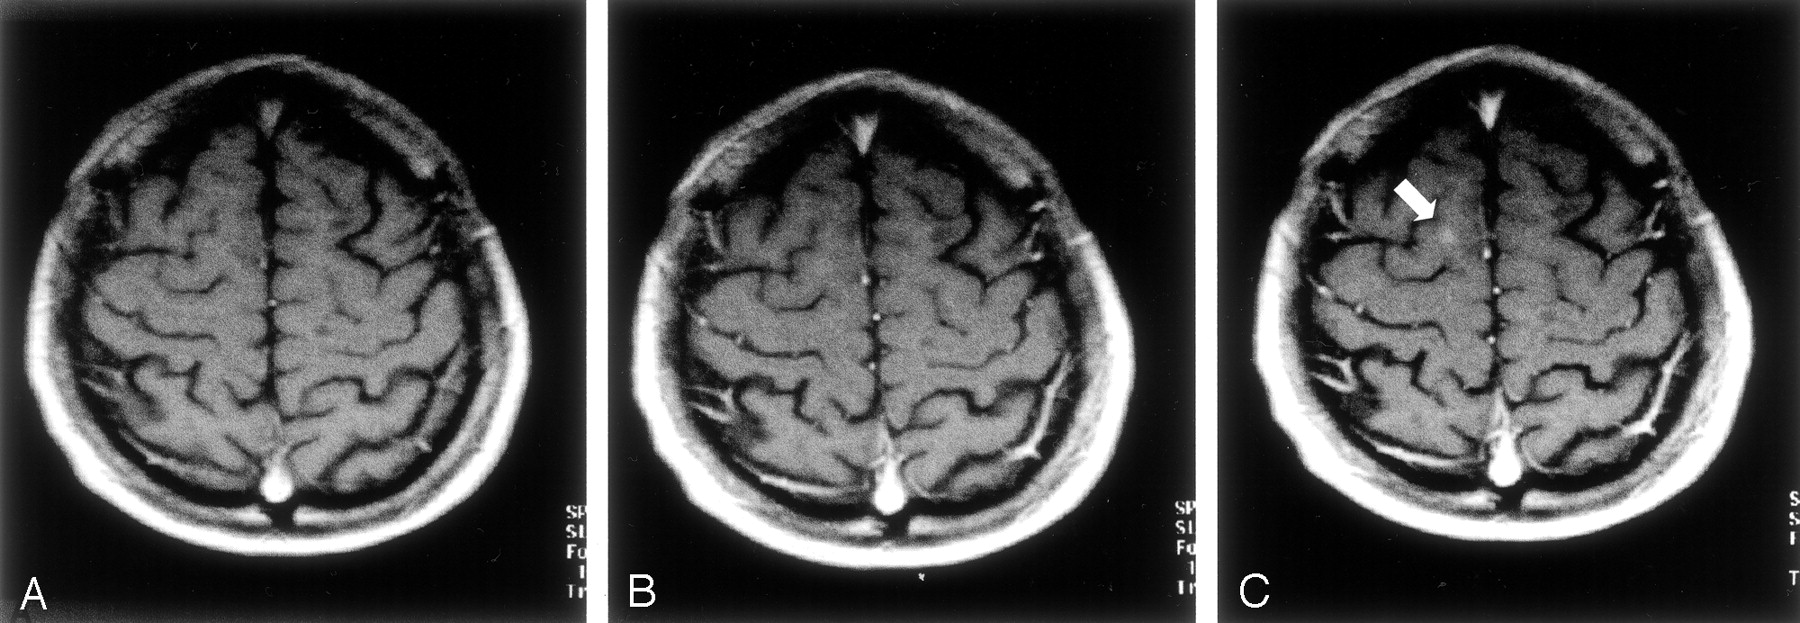
Para-axial T1-weighted spin-echo MR images.
A, Five minutes after the first intravenous administration of an SD (0.1 mmol/kg) of the paramagnetic contrast agent, no contrast enhancement attributable to a white matter lesions is visible.
B, Five minutes after the administration of a second SD of the paramagnetic contrast agent (for a total of 0.2 mmol/kg), no contrast enhancement attributable to a white matter lesion is detectable.
C, Five minutes after the administration of a third SD of the paramagnetic contrast agent (for a total of 0.3 mmol/kg), a small area of contrast enhancement is clearly visible in the right hemisphere (arrow).

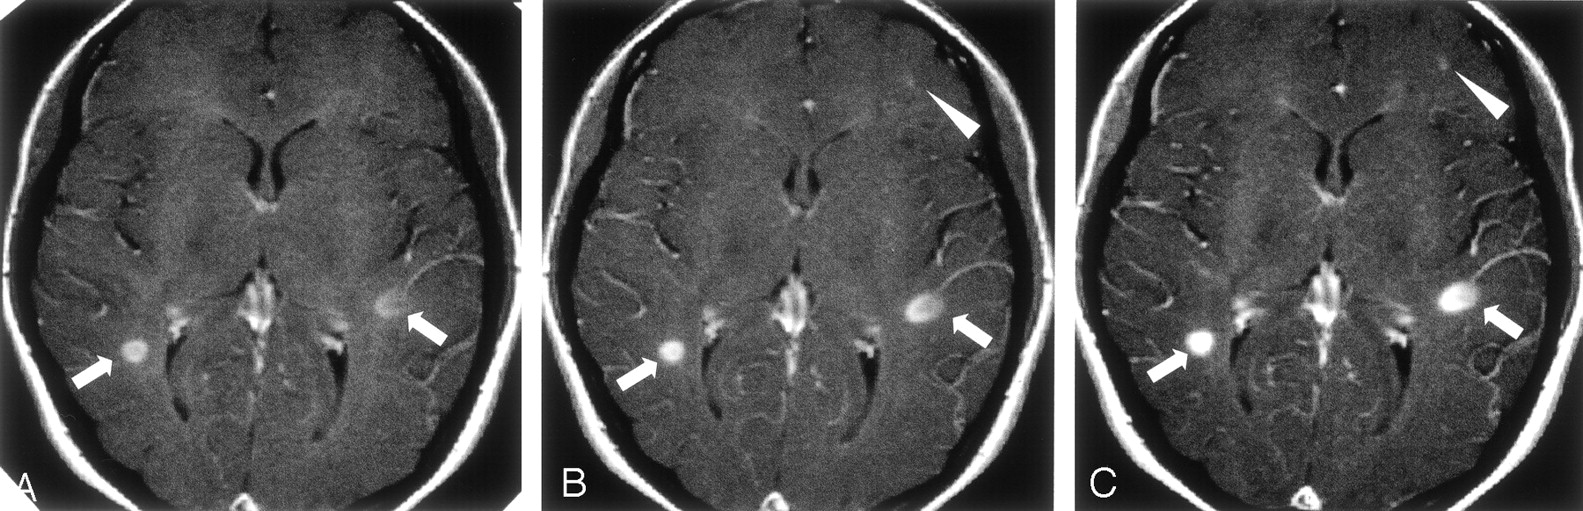
Para-axial T1-weighted spin-echo MR images.
A, Five minutes after the first intravenous administration of an SD (0.1 mmol/kg) of the paramagnetic contrast agent, two enhancing lesions are visible: one in the right and the other in the left hemisphere (arrows).
B, Five minutes after the administration of a second SD of the paramagnetic contrast agent (for a total of 0.2 mmol/kg), the enhancement in these two lesions is more conspicuous (arrows). A third area of focal contrast enhancement is barely detectable in the frontal left lobe (arrowhead).
C, Five minutes after the administration of a third SD of the paramagnetic contrast agent (for a total of 0.3 mmol/kg), the enhancement in all the three lesions becomes more conspicuous so that even the small enhancement in the frontal left lobe can be detected with higher confidence.
Discussion
MS lesion enhancement on T1-weighted images acquired after the intravenous injection of a paramagnetic contrast agent allows the demonstration of increased blood-brain barrier (BBB) permeability in which leakage of the contrast agent results in a focal hyperintensity. As a consequence, this approach enables us to distinguish inactive MS lesions (without contrast enhancement) from active MS lesions (with contrast enhancement). Thus we can monitor disease activity and evaluate treatment efficacy more accurately than we can on the basis of clinical assessment alone (1, 4, 22). This approach also increases the confidence level in making an early diagnosis of MS (4, 5).
In phase 2 trials, contrast-enhanced MR imaging is commonly used as the primary outcome measure for screening new MS treatments (1, 3, 23). In phase 3 trials, contrast-enhanced MR imaging is used to assess secondary endpoints to strengthen clinical observations (1, 24). Moreover, in longitudinal studies, the frequency of enhancement is correlated with clinical relapse (2, 24–26), and it may provide prognostic information about the long-term evolution of disease (7, 8).
The higher sensitivity of a TD of contrast agent compared with that of an SD has been convincingly demonstrated in a number of studies of patients with MS (11–13, 15–17). This advantage is observed even when a subsequent administration of an SD and a DD (10) is used, when this protocol is combined with immediate and delayed imaging (14), or when magnetization transfer (MT) effect is present (18, 19). However, an individual injection of a TD does not provide information about the severity of the pathologic process in a population of lesions, and its use in clinical practice is limited by cost considerations.
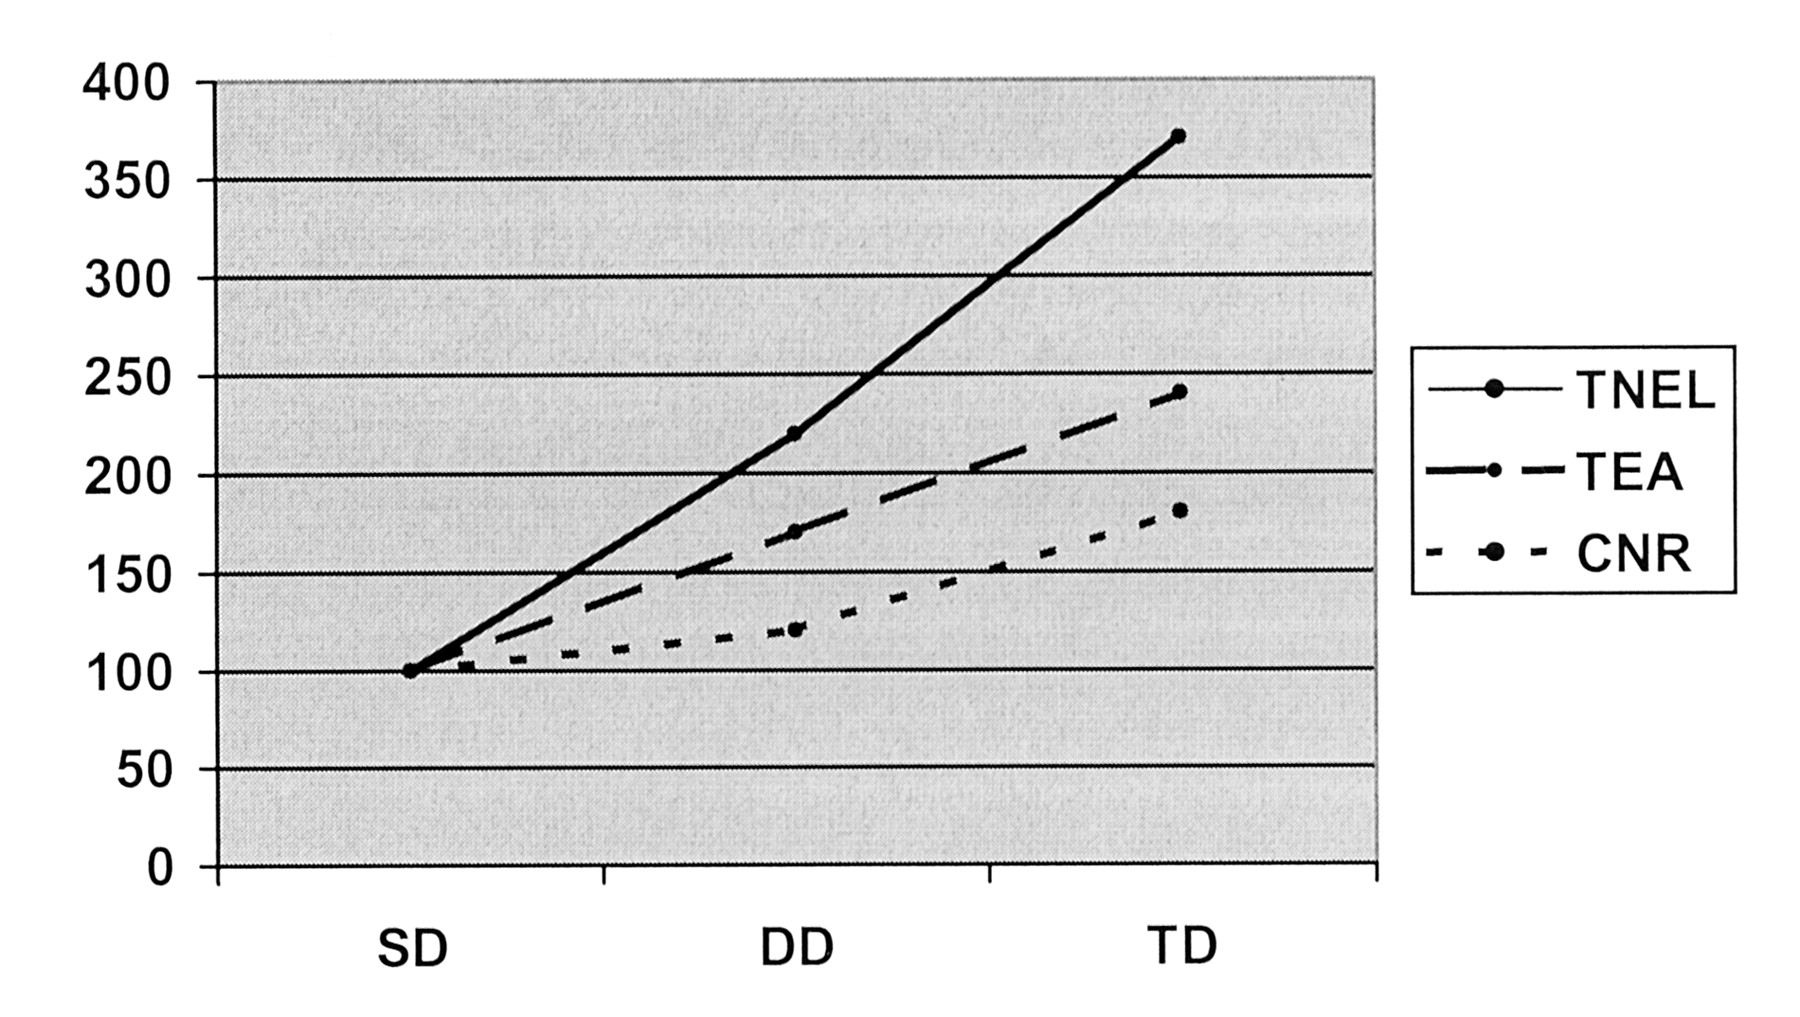
This study shows that three subsequent injections of an SD of contrast agent significantly increases the sensitivity of enhanced brain MR imaging for the detection of active lesions in MS. This strategy also increases lesion conspicuity and the total enhancing lesion area. The total number of enhancing lesions about doubled when the approach changed from an SD (six enhancing lesions) to a fractionated DD (13 enhancing lesions) and from a fractionated DD to a fractionated TD (22 enhancing lesions). The increase was 3.7-fold from an SD to a fractionated TD. A similar trend was also observed for the total enhancing area and for the mean CNR. The progressive increase of these three parameters is clearly shown in Figure 3.

Plot shows the progressive percentage increase in the total number of enhancing lesions (TNEL), the total enhancing area (TEA), and the mean CNR (CNR) with an SD (SD), fractionated DD (DD), and fractionated TD (TD) of the paramagnetic contrast agent in 10 patients with MS.
These results confirm that a TD performs better (in terms of sensitivity) than an SD in assessing disease activity in patients with MS. This difference was shown by several authors who administered the SD or TD as a single injection in separate sessions (11–13, 15–17). Other authors used two subsequent doses during the same session, although they administered an SD followed by a DD of gadolinium chelate, which is comparable to only an SD with a fractionated TD (10, 14). Thus, to our knowledge, this is the first study in which SDs, DDs, and TDs are compared in the same patients. We should emphasize that our results indicated a significant difference between the DD and the TD for all the three parameters. This finding differs from that of previous study in which a DD or a TD was administered in two separate sessions (24-hour interval) in 16 patients with MS, with an imaging delay of 15 minutes after the injection (27). These authors reported no difference in number of enhancing lesions and an increase (not significant) in the mean volume of the enhancing lesions (27). One possible reason for this discrepancy is the different imaging delays resulting from our temporal fractioning of the doses. The delays were about 9 minutes for the fractionated DD and about 13 minutes for the fractionated TD. However, our high ratio of patients with active disease (nine of 10) should be considered a combined result of patient selection (related to the small sample size of only 10 patients) and of the high sensitivity of the method (high dose of contrast agent and delayed imaging). The contributions of these factors is not distinguishable.
The most intriguing and novel aspect of this study is the possibility of gaining information about the nature of enhancing lesions. This is likely to be more complete with the strategy of three subsequent SD injections than that are based on the injection of a TD alone. Using the MT ratio (MTR) and black-hole analysis, investigators have previously demonstrated that new MS lesions that are enhancing on SD and TD images differ from those enhancing only after the TD (21). A corresponding hypointensity was found on T1-weighted images in 31% of the former group and in only 16% of the latter, whereas on follow-up images, 52% of the former group and 70% of the latter did not enhance with either dose. This finding suggests that “the pathologic process is less severe in MS lesions enhancing only after TD injection than in those enhancing after the SD” (21). Similarly, MTR values of lesions enhancing only on TD images are much higher than those of lesions enhancing on SD and TD images (20); this result again suggests more severe tissue damage in the latter population of active lesions. As a consequence, the approach presented in this article might be valuable for obtaining information to distinguish active lesions with different degrees of associated tissue damage. This possibility might be of interest, at least in research trials.
This strategy also shows a way of reducing the amount of contrast agent used; thus, it may lower costs. If the aim of a given study is to distinguish active disease from inactive disease there is, in fact, no need to study all patients with a TD. In this study, we were able to detect active patients in nine of 10 by using only 19 SDs of the paramagnetic contrast agent versus the 30 SDs (ie, 10 TDs) that we would have needed for a TD-based assessment. This approach resulted in a cost savings of 36%.
The advantages of this approach are partially counteracted by the prolonged examination times. The extra time required is approximately 16 minutes when all three injections are performed. However, in evaluating our patient’s active or nonactive status, the extra time was about 8 minutes for four of the six patients with inactive findings after the SD and about 16 minutes for the remaining two patients (inactive findings after the fractionated DD). This resulted in a mean extra time per patient of 6 minutes 24 seconds in the 10 patients examined.
The method of the three subsequent SDs is really a combination of a high dose of contrast agent with delayed imaging. Regarding the possibility that false-positive results may cause overestimation of the number of enhancing lesions, this technique is not different from the individual-injection TD method. The delayed imaging for the first two doses of this method results in the accumulation of gadolinium chelate where BBB damage is present, not in a higher frequency of false enhancements. In fact, in patients with MS, false enhancements can be the result of vascular structures being mistaken for enhancing lesions, or rarely, they can be caused by hyperintensities already present on precontrast T1-weighted images, especially if MT is used (28). With the new method, vascular structures are not further enhanced with respect to individual injection methods; hyperintensities in pre- and postcontrast images are not enhanced at all.
Conclusion
By using three subsequent SD injections, the number of enhancing lesions progressively increases. In addition, this method permits us to achieve a more complete assessment of the population of enhancing lesions by distinguishing three levels of enhancement. Finally, the method reduces the amount of contrast agent used, compared with that needed with TD alone, when it is used to distinguish active disease from nonactive disease, because the examination is stopped when the first enhancing lesion appears.
References
- Received September 19, 2002.
- Accepted after revision November 11, 2002.
- Copyright © American Society of Neuroradiology


