
Abstract
BACKGROUND AND PURPOSE: This study examined abnormalities of the recirculation phase of the contrast medium concentration time course curve in patients with moyamoya disease by using the relative recirculation (rR) parameter. Our aims were to increase understanding of the rR parameter and to assess its possible value in the investigation of moyamoya disease.
METHODS: Six patients with confirmed moyamoya disease and five normal participants were examined by using dynamic T2*-weighted MR perfusion imaging. Parametric maps of relative cerebral blood volume, time to peak (TTP), and rR were calculated. The width of the normal distribution of TTP and the normal upper limit for rR were derived from the normal participants by identification of the 97.5% confidence limits for the distributions. Major vessels were identified by selection of pixels with relative cerebral blood volume >0.5. Areas of abnormally prolonged TTP and of increased rR were then identified in patients, and the relationship between these parameters and major vessels was examined.
RESULTS: The combination of cerebral blood volume >50%, elevated TTP, and elevated rR values accurately identified areas of moyamoya vessel formation seen on angiograms. Larger well-developed meningeal and basal collaterals did not show abnormalities of rR. Areas of prolonged TTP were also observed to occur in the brain distal to arterial occlusion in all cases. In three of these, abnormal elevation of rR was observed in the center of regions of prolonged TTP.
CONCLUSION: These findings support those of our previous work, which suggested that rR can act as an indicator of regional microvascular abnormality, such as that seen in areas of angiogenic activity. They also suggest that measurement of rR may provide valuable additional information regarding patients with moyamoya disease.
The use of dynamic susceptibility contrast-enhanced MR imaging in cases of moyamaya disease has been examined by several groups (1–4). Prolongation of bolus width, time to contrast medium arrival (T0), and time to peak (TTP) contrast medium concentration seem to provide sensitive indicators of the extent to which cerebral blood flow patterns are abnormal distal to arterial obstruction. Diffusion-weighted imaging has been shown to identify areas of focal cerebral ischemia in these patients before the formation of stroke (1, 3, 5). The combination of dynamic susceptibility contrast-enhanced MR imaging and diffusion-weighted imaging therefore constitutes a powerful assessment tool for these patients, providing information similar to that provided by single photon emission CT regarding perfusion and indicating the presence and location of “sub-critical” ischemia. In a previous case presentation, we reported extensive abnormalities of T0, bolus width, and TTP maps (1). The changes in T0 and TTP were more marked than those in bolus width in most areas, which is a typical finding associated with cerebral ischemia distal to arterial stenoses. However, some areas showed considerable prolongation of bolus width with smaller changes in T0 and TTP. Examination of the regional ΔR2 time intensity curves from these areas show remarkable broadening of the curve with prolongation and elevation of the tail (recirculation phase) of the curve. We speculated that the probable explanation of this is that the presence of multiple small collateral vessels causes prolongation of the time course of the passage of contrast medium. Based on this observation, we have recently described a parameter, relative recirculation (rR), which identifies areas in which contrast medium concentrations during the recirculation phase fail to reduce to expected levels after passage of the main bolus of contrast medium (6–8). We think that elevation of the rR parameter occurs in areas of abnormal flow delay where the bolus of contrast medium will fail to clear through the microvasculature at the normal rate. This will occur if regional increases in vascular complexity (tortuosity) that lead to flow delay are present or where pooling of contrast medium occurs in poorly perfused vessels within the tissue (6, 8). This work was originally performed in gliomas, where rR was found to be high in areas of poor perfusion at the boundary between the well-perfused peripheral tumor and the poorly perfused central components (8). We had two aims: to use moyamoya disease as a model of vascular abnormality to explore the properties of the rR parameter and to examine whether rR might provide useful additional information regarding the diagnosis and management of patients with moyamoya syndrome.
Methods
Patients and Imaging
Six patients with angiographically confirmed moyamoya disease and five normal volunteers were examined to determine the characteristics of the recirculation phase of the contrast medium concentration time course curve. All participants provided informed consent for the study, which was approved by the local research ethics committee. MR perfusion imaging studies were performed on identical 1.5-T systems (Gyroscan ACS NT, Philips Medical Systems, Best, The Netherlands) with a standard birdcage head coil. For three patients, MR perfusion imaging was performed by using a T2*-weighted 2D gradient-echo echo-planar sequence (249/30 [TR/TE]; flip angle, 35 degrees; field of view, 230 mm2; matrix, 128 × 92; section thickness, 6 mm; echo-planar imaging factor, 9). For the other three patients, MR perfusion imaging was performed by using an echo-shifted 3D gradient-echo volume echo-planar imaging technique (20/28; flip angle, 10 degrees; filed of view, 230 mm2; section thickness, 3.5 mm; echo planar imaging factor, 9) also known as PRESTO (9). Five normal participants underwent imaging with the use of the 2D technique. Dynamic imaging was performed with a time resolution of 1.9 to 2.0 s per acquisition for seven to 30 sections. Data collection continued for 40 to 50 acquisitions. Before imaging, a 16- to 20-gauge IV catheter was inserted. Contrast medium (0.1 mmol/kg, gadolinium DTPA) was injected after five to 10 image acquisitions, and a chaser of 15 mL of saline was then administered. Other sequences were added for diagnostic purposes in clinical cases.
Production of Parametric Images
Data were transferred to an independent workstation (SUN Microsystems, Palo Alto, CA) for analysis. Both 2D and 3D data were analyzed in the same way. Data were processed to reduce noise by using a principal component technique (10). The resulting data sets were used to calculate T2* rate (ΔR2*) changes by using the relationship  1) where S(0) is the baseline signal intensity and S(t) is the pixel intensity at time t. To produce a theoretical first pass curve, free of recirculation effects, data were fitted to a gamma variate function by using a simplex curve-fitting algorithm and the relationship
  2) where Q, r, and b are fit constants. Curve fitting data were used to derive parametric maps of relative cerebral blood volume (rCBV) and TTP contrast medium concentration. A map of the scaled fitting error was also calculated on a pixel-by-pixel basis, and maps of scaled fitting error were generated to allow detection of areas of high fitting error in subsequent analysis (11).
The recirculation phase of the time signal intensity response curve was examined as described previously (6–8) by calculation of the area between the idealized first pass curve represented by the gamma variate function and the measured data during the recirculation phase. The measurement was made between the midpoint of the downslope of the gamma variate fit and a point 30 s after the initial T0. Because the area under the time intensity curve partially represents true contrast recirculation, it would be predicted to correlate closely with regional rCBV. To remove this correlation, the recirculation parameter was normalized by using the maximal value of the gamma variate fit. This normalized parameter, rR, was calculated on a voxel-by-voxel basis as  3) where ΔR2*max is the maximum value of R2*theoretical, A is the time corresponding to the onset of recirculation measured at half-height of the descending part of the ΔR2* curve, and N is the end point of the dynamic series (6).
Analysis of Parametric Maps
Parametric images were examined by using the software package ENVI (Floating Point Systems, Boulder, CO). Standard fitting error measures and measurements of rR were used to identify poor quality data. Standard fitting error is affected by poor signal intensity-to-noise ratio and by loss of conformance to a gamma variate function. In view of this, all pixels with a standard fitting error >20% were excluded (11) unless measured values of rR (which provides an independent indicator of conformance to a gamma variate function) exceeded 0.35. This exclusion criteria is designed to exclude spurious results due to poor curve fitting to data from areas in which signal intensity-to-noise ratio is low but not to exclude data from areas in which poor fitting reflects abnormal recirculation.
The width of the normal distribution of TTP and the normal upper limit for rR were derived from normal participants by identification of the 97.5% confidence limits for the distributions. Major vessels and areas of high vascular attenuation were identified by selection of pixels with rCBV >0.5. Areas of abnormally prolonged TTP and of increased rR were then identified in patients, and the spatial relationship between these parameters and major vessels was examined on compound color-rendered parametric maps. The maps were color-coded by using two schemes. The first scheme, designed to show the relationship between vessel structure and flow delay, was based on measured values of cerebral blood volume and TTP. The second scheme, designed to show the relationship between flow delay and abnormalities of recirculation, was based on rR and TTP.
Results
Patients and Volunteers
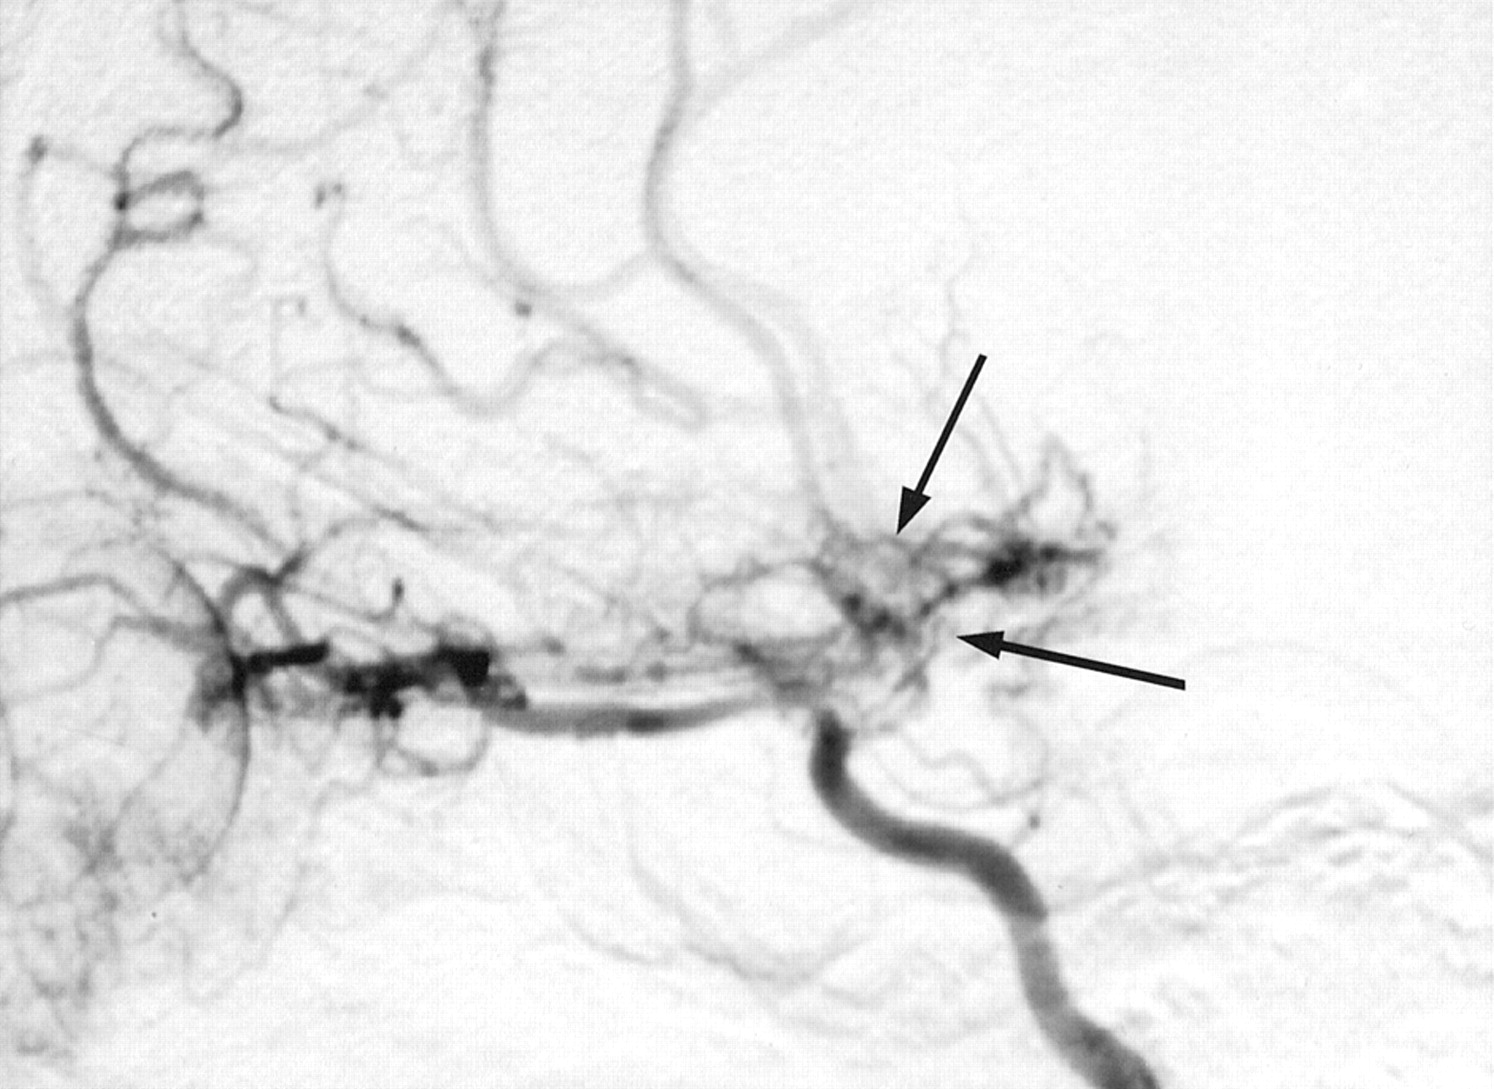
The six patients were comprised of four male and two female patients who were 3 to 17 years old. Presenting symptoms were fits (one case), transient neurologic disturbance (three cases), and stroke (two cases). The diagnosis of moyamoya syndrome was made in all cases based on observation of arterial occlusion and new vessel formation as revealed by digital subtraction angiography (Fig 1). In all cases, presentation was spontaneous with no associated risk factors. Angiographic descriptions and findings are presented in Tables 1 and 2. Patient details, including grade of disease according to the classification system described by Mugikura et al (12), which was adapted from the original staging system presented by Suzuki and Takaku (13), are shown in Table 3. Perfusion imaging of five normal control participants was also performed. Because of the ethical concerns associated with imaging of truly normal participants in this age group, the participants were selected from patients undergoing investigation to exclude cerebral tumor. In each of these cases (three male and two female participants; age range, 9–18 years), the participants were screened for tumors because of a family history and the results of all the investigations were normal.

Selective angiogram of the right carotid artery shows occlusion of the terminal branches of the carotid artery (case 1, internal carotid artery grade IV). Collateral vessels are seen around the base of the brain (arrows), and the right ophthalmic artery is dilated and also supplies collaterals to the cerebral circulation.
Classification of the severity of steno-occlusive change in the internal carotid artery circulation
Classification of the severity of steno-occlusive change in the posterior cerebral artery
Demographic data and severity of steno-occlusive disease
Perfusion Data
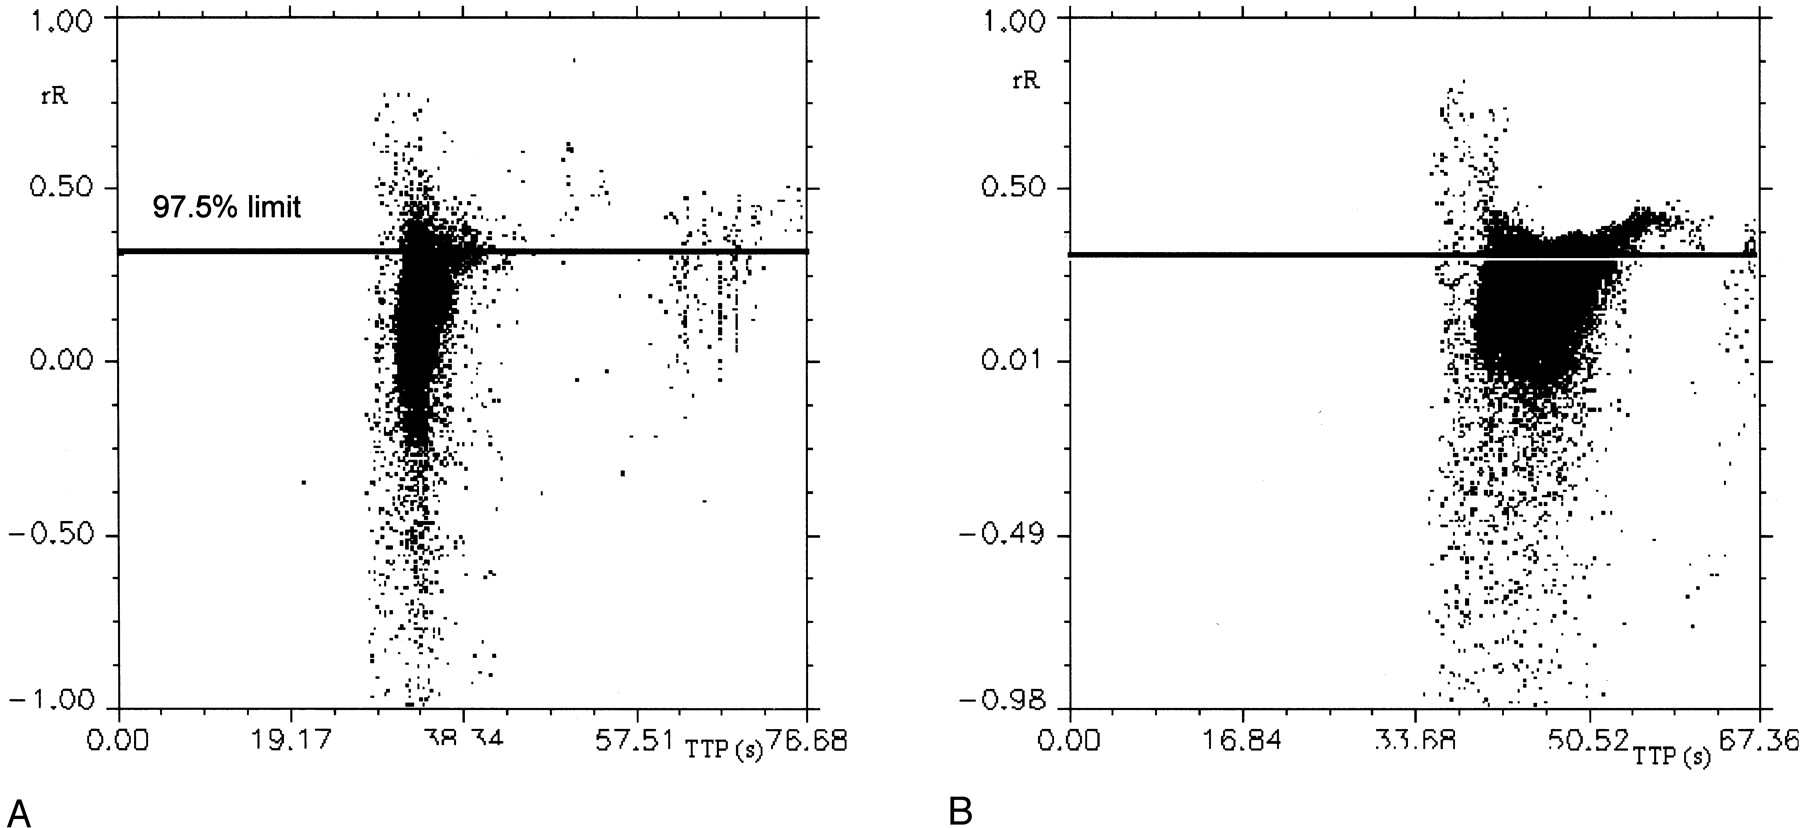
In normal participants, the maximal width of the TTP distribution for the whole brain was 6.0 s. The rR parameter had an upper limit of 0.35 (ie, 35% of the maximal height of the first pass bolus), with 2.5% of intracranial voxels lying above this level (Figs 2 and 3).

Scattergrams of rR versus TTP contrast medium concentration. Horizontal reference lines on both graphs indicate the 97.5th percentile of rR values in the normal participant.
A, Normal participant.
B, Patient with moyamoya disease (case 1). Note the increased values of TTP in the patient and the increased numbers of voxels above the reference line.

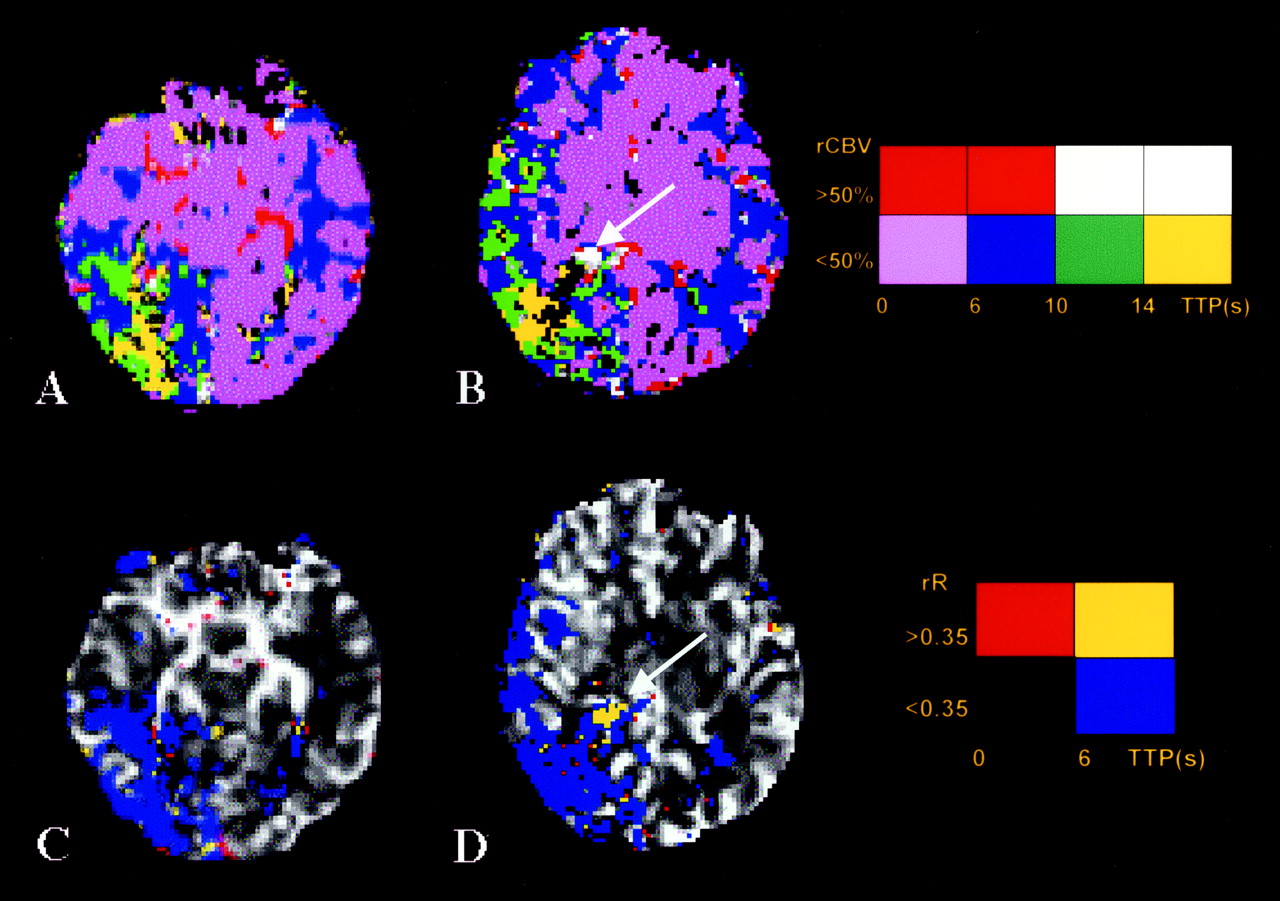
Parametric images of a normal participant. Color charts explain color coding for each image type.
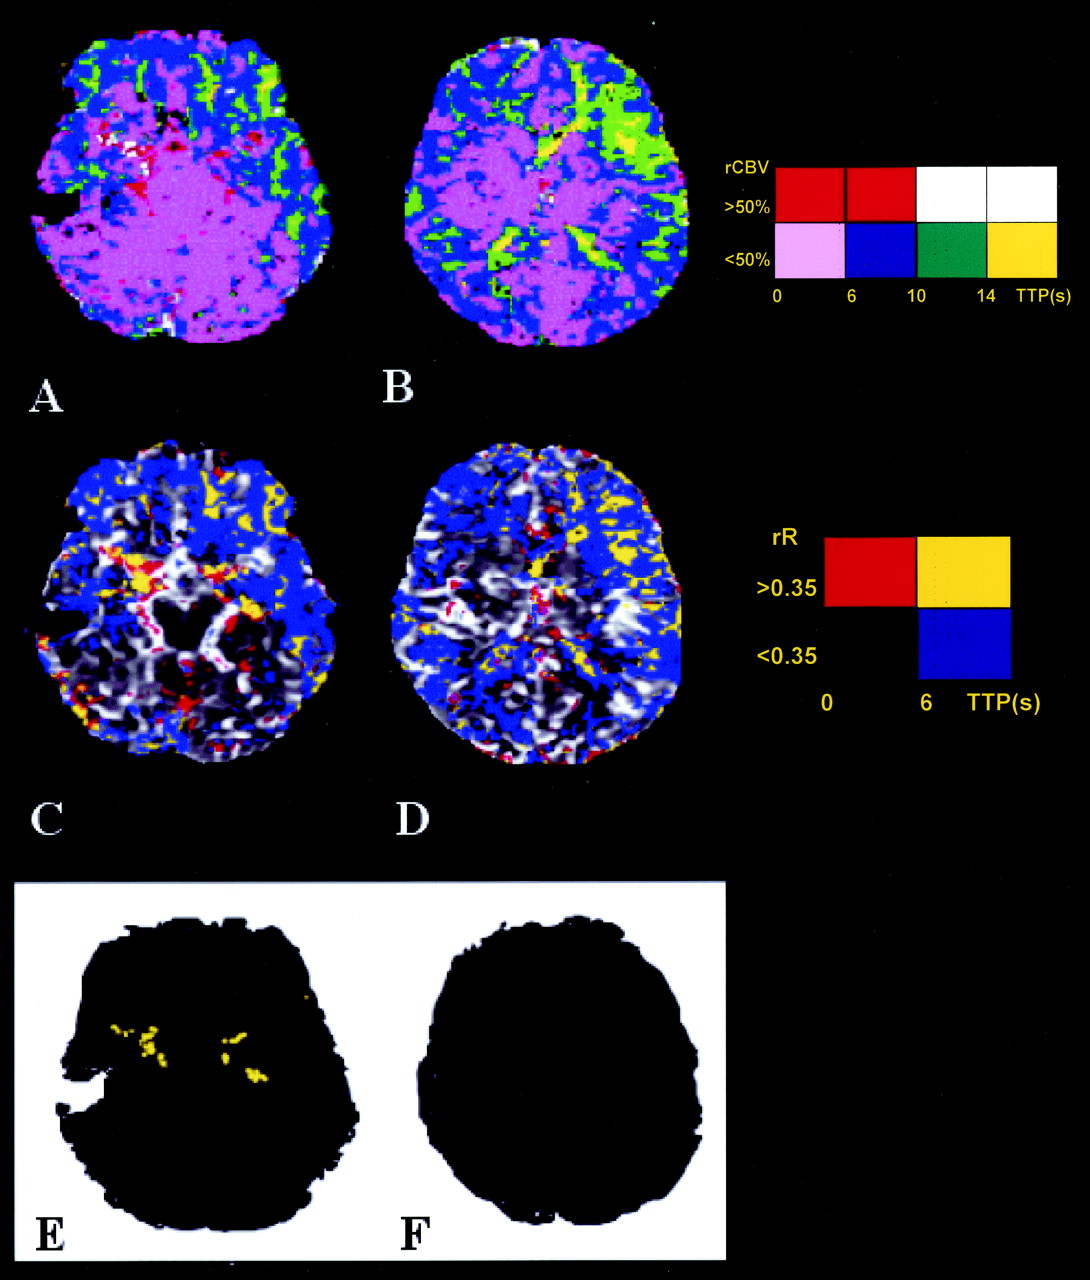
A, Distribution of rCBV and TTP. Colors attempt to identify the distribution of large blood vessels (red indicates rCBV >50% and TTP <10 s), areas of increased vascular attenuation and delayed flow (new vessel formation) (white indicates rCBV >50% and TTP >10 s), areas of normal capillary flow (orchid indicates rCBV <50% and TTP <6 s), and areas of delayed flow in capillary beds (blue indicates rCBV <50% and TTP from 6 to 10 s, green indicates rCBV <50% and TTP from 10 to 14 s, and yellow indicates rCBV <50% and TTP >14 s).
3B and C, Distribution of abnormal TTP. Colors identify the distribution as follows: red, areas of normal TTP and elevated rR (TTP <6 s and rR >0.35); blue, areas of elevated TTP but normal rR (TTP >6 s and rR <0.35); yellow, areas of delayed flow and elevated rR (TTP >6 s and rR >0.35)
In patients, the posterior fossa and basilar artery territory were not affected by disease and the values of TTP and rR were within normal limits (Figs 4 and 5). In the prosencephalon extensive areas, abnormal values were seen in all patients.

Parametric images of distribution of rCBV and TTP (A and B) and rR and TTP (C and D) in a patient (case 4) with minimal transient symptomatology. Angiogram shows only mild stenosis of the left internal carotid artery and that the right internal carotid artery was normal (internal carotid artery grade 1), but severe stenosis of the right posterior cerebral artery is shown with well-developed posterior cerebral artery moyamoya (posterior cerebral artery grade 3). Color coding is as described in the legend to Figure 3; Color charts explain color coding for each image type. Note the presence of abnormal areas of neovasculature (arrows) indicated by prolonged TTP, high rCBV, and abnormal prolongation of rR. The presence of moyamoya vessels was confirmed on digital subtraction angiograms. Distal to the abnormal vessels, a wedge-shaped area of prolonged TTP is seen; values of rR throughout this area are normal.

Parametric images of distribution of rCBV and TTP (A and B) and rR and TTP (C and D) in a patient presenting with expressive dysphasia and an established left-sided cortical laminar stroke (case 1). Angiogram shows advanced steno-occlusive changes in the left internal carotid artery (see Fig 1, internal carotid artery grade IV) with associated moyamoya changes. Color coding is as described in the legend to Figure 3; Color charts explain color coding for each image type. Areas of increased TTP and rR (E and F) where rCBV is >50%. Note the presence of abnormal areas of neovasculature around the middle cerebral arteries, indicated by prolonged TTP, high rCBV, and abnormal prolongation of rR. The presence of neovascularization was confirmed on digital subtraction angiograms (Fig 1). Extensive areas of prolonged TTP can be seen throughout both hemispheres. Abnormal values of rR are seen in the central portions of these areas (yellow on E and F). The rCBV in these areas is low in distinction to the areas of prolonged rR seen in areas of neovascularization.
The major vessels composing the circle of Willis were clearly identified by their high rCBV and displayed normal values of both TTP and rR throughout their length (Figs 4 and 5). In four of six patients, areas adjacent to these major arteries showed clear increases in TTP (6–16 s) and in rR (>0.35) (Fig 5). These areas also showed high values of rCBV (>0.5) and corresponded exactly to the location of abnormal new microvasculature (moyamoya change) shown on angiograms. In the remaining two cases, angiography revealed moyamoya formation limited to small focal areas along the course of smaller branches distal to the circle of Willis. Small areas of prolonged TTP and increased rR were observed in these areas on perfusion maps of both patients (Fig 4). Parametric maps identifying areas with elevated values of cerebral blood volume, TTP, and rR accurately identified areas of moyamoya change in all six cases (Fig 5). Larger well-developed meningeal and basal collaterals did not show abnormalities of rR.
In the substance of the forebrain itself, areas of increased TTP were seen in multiple vascular territories distal to vascular occlusions. The values of TTP in these areas ranged from 6 to 18 s. Centrally within the larger confluent regions of increased TTP, abnormal areas of rR were also seen in three cases (Fig 5). The elevations of rR were not present in all areas of abnormal TTP and were larger in one patient with severe hypoperfusion in whom a small infarct had already occurred. They were associated with low values of rCBV (<50%). Estimates of the extent of cerebral involvement were made by measurement of the cross-sectional area of abnormalities on the most severely affected prosencephalic section. Areas of abnormal TTP were seen in all cases and affected 38.7% to 53.8% of the cross-sectional area. Abnormal rR was seen in only three cases and affected only 7.6% to 12.2%.
Discussion
Moyamoya disease is a rare progressive cerebrovascular occlusive disease characterized by parenchymal collateralization. Ischemia results in increased development of small arterial and arteriolar collateral vessels around the obstructed major arteries (Fig 1) (1, 3). These new vessels are chaotic and tortuous, and their angiographic appearance, “like a puff of smoke hanging in the air,” gave rise to the term moyamoya, which is derived from Japanese (Fig 1). Moyamoya disease was first described in 1957 by Takeuchi and Shimizu (14). It has a much higher incidence among Japanese and Asian populations but is being increasingly recognized outside Japan (15, 16). A female dominance exists, with a male-to-female ratio of 1:1.7. Two separate age peaks are recognized, the first at approximately 3 to 4 years and the second at approximately 35 years. Children have higher rates of cerebral ischemia resulting in transient ischemic events or strokes and intellectual deterioration, whereas adults are more prone to hemorrhage and aneurysmal hemorrhage (16). A prodromal period of reversible neurologic abnormalities may exist, often provoked by physical activity or hyperventilation. The typical vascular changes have also been associated with other underlying conditions, such as neurofibromatosis, Down syndrome (17), Sjögren syndrome (18), and previous cranial irradiation (19). These cases should more properly be termed moyamoya syndrome to describe the progressive occlusive vasculopathy that occurs. Although the exact mechanism of vascular obstruction remains unclear, elevation of the angiogenic growth factor “basic fibroblast growth factor” is observed to occur in patients with moyamoya syndrome, reflecting new vessel formation (20). After adequate restoration of blood flow by surgical intervention, the resulting loss of angiogenic drive can lead to complete resolution of these abnormal vessels (21). However, in contrast to angiogenic neovasculature observed in association with other inflammatory and neoplastic disorders, the neovasculature in moyamoya disease maintains a blood-brain barrier and parenchymal enhancement is rarely seen except in relationship to areas of recent infarction or in the leptomeninges (ivy sign), where it seems to represent intravascular contrast medium in areas of extremely slow flow (22).
Medical management with corticosteroids, low molecular weight dextran, calcium channel blockers, and anti-platelet agents is disappointing. Surgical management aims to revascularize brain tissue where perfusion is compromised by means of external carotid artery/internal carotid artery anastomoses. However, direct procedures such as anastomosing the superficial temporal artery to a middle cerebral artery branch or branches are poorly tolerated, particularly in children, because of the interruption of middle cerebral artery supply (23, 24). Indirect bypass procedures include encephaloduroarteriosynangiosis, which involves suturing part of the superior temporal artery and attached fascia onto a slit fashioned in the dura (25, 26).
Radiologic investigation classically involves formal conventional digital subtraction angiography to show collateral patterns of flow and the presence of moyamoya change. Conventional MR imaging and MR angiography are able to show areas of abnormal vessel formation in most cases (27, 28) and have been suggested as an alternative to digital subtraction angiography for diagnosis. Nonetheless, digital subtraction angiography remains an important component of the diagnostic and therapeutic workup to avoid misdiagnosis of other occlusive vascular disorders and to establish the anatomy and contribution of external carotid branches to the cerebral circulation before indirect anastomotic surgery. Further investigation to observe the extent and severity of ischemic compromise is also essential, and several authors have documented the increased sensitivity of positron emission tomography and single photon emission CT over conventional cross-sectional imaging in assessing perfusion defects and in evaluating the response to bypass surgery (29–31). Acetazolamide challenge can be used to elucidate cerebral hemodynamic factors, including cerebral blood flow reserve, which cannot be detected angiographically. However, both these techniques have potential disadvantages. Positron emission tomography is limited by availability, and single photon emission CT has a relatively low spatial resolution. Both incur exposure to ionizing radiation (32, 33).
The rR measurement reflects the area under the contrast medium concentration time course curve in the period immediately after the first passage of the bolus of contrast medium. This measurement is directly proportional to the blood volume in the voxel, a relationship that is removed by scaling the measure by using the height of the first pass bolus curve. The resulting scaled measurement indicates areas in which the amount of contrast medium in the tissues is abnormally high after the first passage of the bolus of contrast medium. This will occur where heterogeneity of the rate of passage of contrast medium into, or through, the measurement space exists (6). Such heterogeneity is common in pathologic vasculature and is seen in tumors, where it has been used as an angiographic indicator of malignancy.
After our preliminary observations in a single case of moyamoya syndrome, we speculated that rR could be reliably derived from dynamic susceptibility contrast-enhanced MR imaging data and should provide useful information concerning the structure and blood flow characteristics of the microvasculature. The physiological causes of high rR values remain uncertain (34), and this study was conducted, at least in part, to attempt to further understand the biologic implications of abnormal values. One interpretation is that the measurement is detecting areas of extravascular contrast leakage, which would cause enhancement on T1-weighted images. However, measurements of rR in cerebral tumors show that the distribution of abnormal values is distinct from enhancement patterns (8) seen on matched T1-weighted acquisitions. Assuming that the rR abnormality reflects intravascular contrast medium, it seems likely that it corresponds to the phenomenon of tumoral staining that can be seen in some tumors on formal angiograms. With angiography, the blush that results from delayed passage of contrast medium arrives early and stays late (35). This is traditionally ascribed to persistence of contrast media within tumor vasculature, which typically shows “increased vascular attenuation, irregular bizarre looking vessels, laking and pooling of contrast, pseudoaneurysms, and arteriovenous shunt surgery” (35). It should be appreciated that abnormality of rR is not an anticipated result of simple local increases in vascular attenuation because the value is scaled to the height of the first pass curve, which is directly related to rBV. Similarly, simple hypoperfusion in a normal vascular bed is unlikely to cause abnormality of rR because such areas will show decrease or loss of the signal intensity change due to the first passage of the bolus of contrast medium. The persistence of intravascular contrast medium in areas with a detectable and normal first pass bolus curve is therefore likely to occur in areas where abnormal vascular structure leads to local trapping of contrast medium in abnormal vessels. We have recently shown an increase in rR in malignant gliomas compared with intermediate grade tumors (8). We have also shown that elevation of rR in malignant gliomas occurs specifically in the border zone between viable and poorly perfused tumor, where angiogenic activity is greatest and where there is a combination of abnormal neoangiogenic vessels and decreased regional flow (6, 8). The application of the rR technique to moyamoya disease offers the opportunity to extend our understanding of the parameter. Moyamoya disease is characterized by the presence of angiogenesis with the development of neovasculature (moyamoya) around the areas of large vessel occlusion. These new vessels appear to have an intact blood-brain barrier but extremely slow flow and classical contrast medium retention, which gives rise to the puff of smoke appearance. Vascular occlusion also results in the development of larger collateral flow pathways, especially from the external carotid circulation, which contribute extensively and often predominantly to the distal cerebral circulation but the development of which is not marked by the development of moyamoya change. In addition, these patients have areas of severe flow disruption within the brain, secondary to large vessel occlusion, which are characterized by slow flow, expended cerebrovascular reserve and central ischemia, which can lead to stroke (12).
The investigation of moyamoya syndrome in a patient will also inevitably include an assessment of the disturbance of cerebral perfusion by using single photon emission CT, positron emission tomography, xenon CT (29–31), or, more recently, dynamic susceptibility contrast-enhanced MR imaging (1–3). Diffusion-weighted MR imaging also seems to provide beneficial clinical information and should be routinely performed wherever it is available (1, 3, 5). We have investigated the effects of neovascularization on regional perfusion characteristics to learn whether characteristic abnormal patterns of flow that improve the identification of new vessel formation can be identified. Our previous observations suggested that increased rR should occur within these areas, although we were unsure whether the effect would be limited to the areas of vascular proliferation because the pattern of flow in the outflow vessels will also be affected. In all six cases reported herein, the proliferation of multiple small vessels (moyamoya) was marked by a prolongation of TTP combined with elevation of rR, occurring in voxels with rCBV values >50%. These features, seen along the course of the major intracranial arteries, were diagnostic of moyamoya change, which was confirmed by angiography in all cases. Similar changes in rR were not seen in the vicinity of larger, well-developed meningeal collateral vessels. The abnormalities of rR were also limited to the immediate area of vascular proliferation and were not seen in the vascular territories immediately distal to these vessels. This suggests that the outflow of these small tortuous moyamoya vessels makes little effective contribution to the perfusion of the brain substance, which is subserved by larger more well-developed basal and meningeal collaterals, as shown by digital subtraction angiography. If this were not so, the abnormal flow pattern seen in the neovasculature would also be seen in the brain that receives the vascular runoff from these vessels. The finding of marked increases in TTP within the area of neovascularization, which exceeds the values observed in adjacent brain tissue, also supports this conclusion.
Increases in rR were not specific to regions of moyamoya vessel formation but were also seen within the substance of the brain in the two most severely affected patients. In both these cases, prolongation of TTP was seen throughout the vascular territory distal to the affected arteries (Figs 4 and 5). This prolongation of TTP within the capillary beds has been described in moyamoya syndrome by several groups and seems to represent slowing of capillary blood flow due to a combination of vasodilation and decreased regional perfusion pressure (1, 2). As such, they provide clear demarcation of the extent of the cerebral vasculature that is experiencing a reduction in effective perfusion pressure as a result of the vascular abnormality. Thus, prolongation of TTP will be observed to occur in areas of cerebral auto regulation where blood flow is maintained and in areas where auto regulation is exhausted and flow is compromised (1, 3). The identification of areas of rR in the central portions of large areas of increased TTP is potentially interesting because such areas were seen only in the three most severely affected patients. The mechanism underlying these areas of abnormal rR is unclear. Neovascularization does occur in ischemic lesions (12) as a result of ischemia-mediated cytokine release, and it is possible that we are identifying this process in the center of moyamoya lesions where ischemic insult is most pronounced. However, the center of these large areas of delayed flow may also show inflow heterogeneity simply as a result of the extreme prolongation of inflow times in these areas. Whether these changes in rR correspond to ischemic angiogenesis, it seems probable that they identify areas of severe ischemic change and may be useful in assessing the risk of infarct in regions of disturbed flow.
The presence of increased rR in regions of moyamoya disease is easily distinguished from similar changes occurring distally in the brain parenchyma. These later changes were seen only in the central portions of areas of increased TTP, were never associated with high values of rCBV (>50%), and were never seen in association with the major basal arteries.
Conclusion
We have shown abnormalities of the recirculation phase of passage of the bolus of contrast medium in patients with moyamoya disease. Elevation of the rR measure was shown to occur in all areas of moyamoya disease that were also marked by prolongation of TTP and high levels of cerebral blood volume. These changes were observed to occur only in the region of the tiny moyamoya vessels themselves and not in the areas of larger basal and meningeal collateral vessels. Elevation of rR was also observed to occur in the central portions of areas of prolonged TTP within the ischemic cerebral parenchyma. These findings support the findings of our previous work, which suggested that rR can act as an indicator of regional vascular tortuosity and associated abnormalities in flow and suggested that measurement of rR may be helpful in the assessment of patients with moyamoya disease.
Acknowledgments
The authors thank Dr. E. Keller, University Hospital in Bonn, Germany, and Dr. Y. Chan, Prince of Wales Hospital in Hong Kong, China, for providing moyamoya data sets.
Footnotes
This study was made possible by funding from Philips Medical Systems, London, England.
References
- Received June 12, 2002.
- Accepted after revision October 8, 2002.
- Copyright © American Society of Neuroradiology
In this issue


Jump to section
Related Articles
Cited By...
- Quantitative Assessment of Neovascularization after Indirect Bypass Surgery: Color-Coded Digital Subtraction Angiography in Pediatric Moyamoya Disease
- Deregulation of Retinaldehyde Dehydrogenase 2 Leads to Defective Angiogenic Function of Endothelial Colony-Forming Cells in Pediatric Moyamoya Disease
- Normal-Appearing White Matter Permeability Distinguishes Poor Cognitive Performance in Processing Speed and Working Memory
- Characterization of Cortical Microvascularization in Adult Moyamoya Disease