
Abstract
BACKGROUND AND PURPOSE: Change in signal intensity due to acute ischemic stroke can be detected on diffusion-weighted (DW) images soon after symptom onset. Fluid-attenuated inversion recovery (FLAIR) DW imaging suppresses signal intensity from water and has been suggested to be better than conventional DW imaging as a diagnostic imaging technique in acute stroke. We compared the signal intensity-to-noise ratio (SNR) and contrast-to-noise-ratio (CNR) between ischemic and normal tissues by using these two sequences.
METHODS: Twenty stroke patients underwent imaging less than 6 hours after stroke onset by using both acquisition methods. The SNR of six regions of interest in normal brain and one region in ischemic brain were compared on both DW imaging and FLAIR DW imaging. We also compared CNR in normal and ischemic tissues. The calculated apparent diffusion coefficient (ADC) maps from each acquisition technique were similarly assessed.
RESULTS: The SNR was significantly lower for FLAIR DW imaging than for DW imaging (P < .05). The CNR between normal and ischemic tissue was also lower on FLAIR DW imaging (P < .05). SNR and CNR of the ADC maps were significantly different (P < .05) for all tissues except the putamen and white matter (for SNR and CNR) and globus pallidus (for CNR only).
CONCLUSION: Ischemic tissue on FLAIR DW imaging was significantly less conspicuous than on DW imaging and potentially limits the clinical utility of this sequence.
Diffusion-weighted (DW) imaging is sensitive to changes in the local diffusion of water (1). This property allows visualization of early tissue damage in acute ischemic stroke. Treatment decisions are increasingly based on the presence, location, and extent of acute ischemic tissue seen with this rapid, noninvasive imaging sequence (2). Radiologic detection of stroke depends on the conspicuity of the abnormal ischemic tissue compared with that of surrounding normal brain tissues. Maximization of this ischemic tissue-to-normal tissue conspicuity is therefore a desirable objective. Quantitative apparent diffusion coefficient (ADC) maps can be derived from DW images. ADC values are known to change over time and can be used to estimate the age of the stroke (3). More importantly, early reductions in ADC values may predict the risk of tissue infarction (4). A reliable determination of ADC is therefore also desirable if reproducible and accurate thresholds for the prognosis of infarction are to be established.
Fluids, such as CSF and water, have long T2 relaxation times and high ADC values compared with those of normal or acutely ischemic parenchyma. A few studies have shown that suppressing CSF with a fluid-attenuated inversion recovery (FLAIR) preparatory pulse before DW imaging, results in lower ADC values in acute ischemic tissue (5–7). Such groups have suggested that these lower ADC values are more accurate than those obtained without FLAIR preparation because of the absence of partial-volume effects from CSF and water. We have observed, however, that FLAIR DW images typically have a signal intensity-to-noise ratio (SNR) lower than that of DW images, and the prior studies have not explicitly examined this factor. A lower SNR could limit the conspicuity of ischemic tissue and the clinical utility of the FLAIR DW imaging sequence.
The aim of this study was to compare ischemic tissue conspicuity on conventional DW images and FLAIR DW images and their respective ADC maps in patients with hyperacute ischemic stroke (≤6 hours from symptom onset). We used two objective measures: SNR of normal tissues and ischemic tissue and contrast-to noise ratio (CNR). The latter was defined as the ratio of signal-intensity difference to noise between ischemic and normal tissues.
Methods
Patients and MR Imaging
Twenty consecutive adult patients were examined. All patients presented with unilateral, hyperacute ischemic stroke less than six hours from time of symptom onset or from time last seen well. The study was approved by our institutional review committee, and written informed consent was obtained from all participants. Stroke neurologists (A.M.B., M.D.H.) diagnosed their ischemic stroke, both clinically and by using plain cranial CT scans acquired before MR imaging. DW images were acquired at 3T (Signa; GE Medical Systems, Milwaukee, WI). This was part of an acute stroke imaging protocol including MR angiography, FLAIR imaging, and perfusion-weighted imaging (8). DW imaging (b = 0 and 1500 s/mm2 along three axes, spin-echo echo-planar imaging, TR/TE/NEX = 7000/96.5/1, 19 oblique axial sections, 5-mm section thickness with a 2-mm gap, field of view = 320 mm × 190 mm, acquisition matrix 192 × 192) was performed after a T1-weighted sagittal scout was obtained and before any contrast agent was administered. The b value of 1500 s/mm2 was previously validated as the optimal value for maximizing differences in signal intensity between ischemic and contralateral tissue in acute stroke at 3T (9). The water-suppressed, FLAIR DW images were acquired immediately after DW imaging with the same parameters except for a TR of 9500 milliseconds and the use of an inversion pulse with a TI of 2200 milliseconds.
Image Analysis
DW images and FLAIR DW images were transferred to a commercial workstation (Advantage Windows, version 3.1; GE Medical Systems). The mean and SD of the signal intensity was measured in a region of interest (ROI). A standard circular ROI was used (approximate area of 140 mm2) and reduced to a smaller ellipse when necessary to fit entirely within a given tissue type. These ROIs were placed in eight readily identifiable areas: 1) ischemic tissue (on the section with the largest hyperintense ischemic region visible on the DW image with a corresponding hypointense ADC region), 2) CSF (in the body of the lateral ventricle), 3) gray matter (occipital interhemispheric fissure at the same section level as for CSF), 4) white matter (periventricular white matter at the same level), 5) putamen (on the section where the putamen is widest), 6) globus pallidus (on the same section as for putaminal measurements), 7) insular cortex (on the same section as for putaminal measurements), and 8) air (ROI placed on the top right corner of the section with putaminal measures).
ROIs for nonischemic tissues were all placed contralateral to the ischemic tissue. Simultaneous measures from each ROI were made from the ADC maps (Functool; GE Medical Systems) derived as follows: ADC = −ln(Sb/Sb=0)/b, where S is the signal intensity, b is the diffusion-weighting b value (in this study, b = 1500 s/mm2). The user-defined image-intensity threshold for this calculation was set to 0 to allow an accurate assessment of the signal intensity in air that was used to define background noise. Typically, a threshold of 20% is used in clinical practice to remove this noise (Fig).

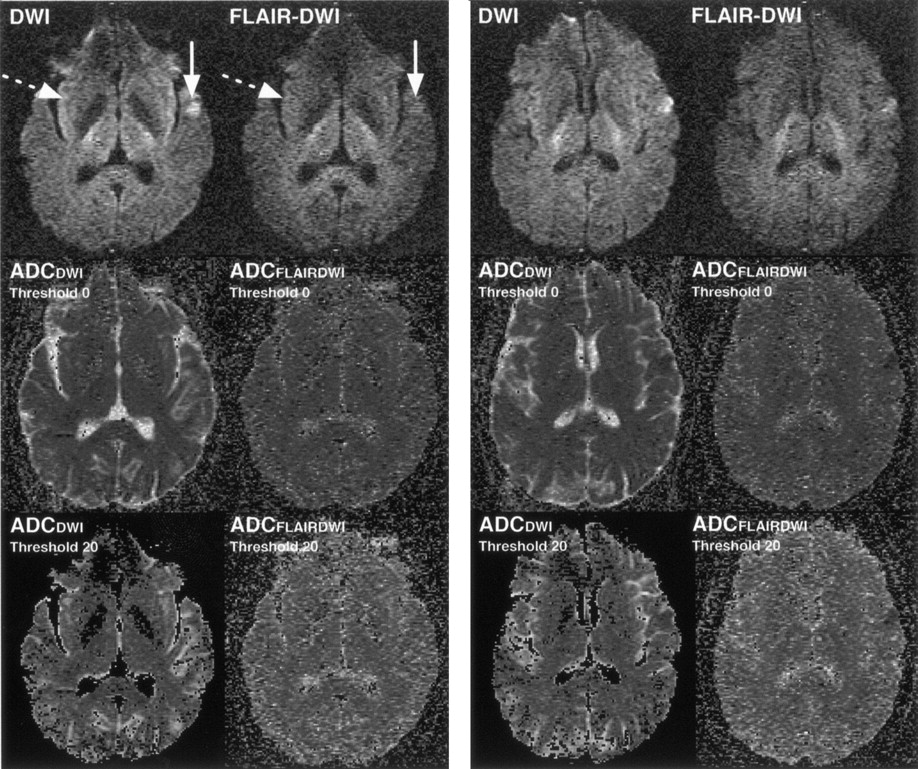
DW image, FLAIR DW image and corresponding ADC maps from one patient illustrate differences in ischemic tissue conspicuity (solid arrow) and in insular cortex appearance (dotted arrow). On the ADC maps (middle row), elevated signal intensity in air (noise) is observed with the use of a magnitude threshold of 0 for calculating the ADC. Typically, a magnitude threshold of 20% is used in clinical practice to remove such noise. Third row shows such thresholded ADC maps; greater noise is evident on ADCFLAIRDWI than on ADCDWI.
DW images and FLAIR DW images from a given patient, paired with their respective ADC maps (ADCDW IMAGE and ADCFLAIR DW IMAGE), were consecutively analyzed to ensure similar ROI placement and ROI shape and size with each sequence. To avoid observer bias, we randomized the order in which the images were presented. Interrater reliability was assessed in an independent analysis of the images by two readers (J.E.S., D.K.C.) blinded to clinical and other imaging information. One reader (J.E.S.) made repeat measurements, obtained not less than 24 hours apart, for the evaluation of intrarater reliability.
Statistical Analysis
The SNR for each tissue ROI was defined as follows: SNRtissue = Stissue/σair, where Stissue is the signal intensity in a given tissue, and σair is the SD of the signal intensity in air. The SNR of each tissue on the DW image was compared with that from the FLAIR DW image by using one-way analysis of variance (ANOVA). The CNR between each of the normal tissues and the ischemic tissue was calculated as a measure of ischemic lesion conspicuity as follows: CNR = (Snormal tissue − Sischemic tissue)/σair. These differences in signal intensity between normal tissue and ischemic tissue on DW imaging and FLAIR DW imaging were also compared by using one-way ANOVA. In addition, for signal intensity, the percentage difference in SNR and CNR between DW imaging and FLAIR DW imaging was calculated. The same SNR and CNR analysis was performed for the ADC values (SNRADC and CNRADC). Interrater and intrarater reliability of the signal intensity measures, for each tissue type, were determined in a two-way ANOVA random-effects model (10).
Results
The median interval from symptom onset to MR imaging was 2.6 hours (range, 1.7–4.6 hours). Fourteen patients had anterior-circulation strokes (nine left and five right, middle cerebral artery [MCA] territory), and six patients had posterior-circulation infarcts. The patients’ median age was 67.5 years (range, 20–83 years). Thirteen were men, and seven were women, and 50% of the patients had National Institutes of Health scores greater than five (range, 1–24). In seven, thrombolytic infusion (intravenous tissue plasminogen activator) commenced before imaging.
Figure 1 illustrates the differences in mean signal intensity, SNR, and CNR on images obtained with DW imaging and FLAIR DW imaging and their respective ADC maps. Tables 1 and 2 summarizes these differences. The mean signal intensity of brain tissues on FLAIR DW imaging was significantly lower than that of DW imaging (P < .05). The SNR was significantly higher for DW imaging than for FLAIR DW imaging in all ROIs (P < .05). Similarly, CNR was larger for DW imaging than for FLAIR DW imaging in all ROIs (P < .05).
Comparison of DWI and FLAIR DWI b = 1500 s/mm2 images
Comparison of ADCDWI and ADCFLAIR DWI
Similar results were observed when we reviewed the ADC maps (Table 2). As expected, the SNRADC and the CNRADC were also greater for ADCDW IMAGING than for ADCFLAIR DW IMAGING because of fluid nulling, although this change did not reach statistical significance for all ROIs.
Interrater and intrarater reliabilities for each tissue and technique were good to excellent. Interrater reliability ranged from 0.73 to 0.96 for DW imaging and 0.89 to 0.97 for FLAIR DW imaging. Intrarater reliability ranged from 0.81 to 0.99 for DW imaging and 0.78 to 0.99 for FLAIR DW imaging.
Discussion
FLAIR DW imaging had an SNR significantly lower than that of DW imaging (18–40% lower), and the same trend was observed for ADC maps. A reduction in the signal intensity from tissues on FLAIR DW imaging is expected and agreed with the findings of others (5–7). This occurred because the fraction of the signal intensity due to a partial volume of CSF or water in each ROI is reduced by FLAIR preparation. Differing fractions of fluid in each tissue explains the variability in this reduction in signal intensity in the regions. For example, the gray matter ROI likely contained more CSF contamination than did the putaminal ROI.
Unexpectedly, the signal intensity in air (background noise) was higher on FLAIR DW imaging than on DW imaging. Although statistically significant, the difference was small and probably due to the FLAIR DW imaging having a longer TR. This may cause a change in the degree of artifact on FLAIR DW imaging, as a mild increase in ghosting could bias the noise estimates. This small increase in noise, coupled with the more profound decrease in tissue signal intensity, resulted in lower SNR measures for FLAIR DW imaging compared with DW imaging.
FLAIR DW images also showed lower conspicuity between normal tissues and ischemic tissue, as measured with the CNR (26–60% lower). SNR, and particularly CNR, can be considered an objective measure of clinical lesion conspicuity. These results suggest that the sensitivity of FLAIR DW imaging for detecting acute ischemic stroke detection may be lower than that of DW imaging.
The main advantage proposed for the FLAIR DW imaging sequence is related to the estimation of ADC. Some have suggested that lower ADCFLAIR DW IMAGING values might identify damaged tissue more accurately than the larger values obtained on DW imaging (5, 7). This is important, as ADC values are increasingly used to assess the severity and duration of ischemia. In addition, in diffusion tensor imaging, the use of a FLAIR-preparatory pulse may improve the delineation of white matter tracts close to the ventricles (11). These potential advantages might be negated if the increased noise associated with FLAIR DW imaging obscures the presence of ischemic tissue. Figure 1 illustrates this hypothesis. In this patient, the ischemic lesion in the temporal cortex was less conspicuous on FLAIR DW imaging than on DW imaging, although with both sequences ischemic tissue was clearly visible more superiorly. However, no follow-up images were obtained for this patient; therefore, the tissue outcome of this differential appearance of the lesion with the two sequences remains uncertain.
Figure 1 illustrates another potential advantage of the FLAIR DW imaging sequence, which is an absence of the insular cortex hyperintensity that is often seen on conventional DW imaging. This insular hyperintensity can sometimes be misinterpreted as being due to ischemia. The use of FLAIR DW imaging might increase the specificity in detecting ischemic tissue, but at the cost of reduced sensitivity. Whether there are differences in the clinical detection of ischemic tissue by using the two image acquisition methods is the subject of an ongoing study (12).
We used a 3T MR machine in this study. The current standard field strength for clinical MR imaging units is 1.5T. The primary advantage of imaging at a higher field strength is an increase in SNR, which we have used to improve spatial resolution. However, a disadvantage is that susceptibility-induced image distortions may be greater due to faster T2* relaxation when single-shot echo-planar imaging is used (as in this study). Both DW imaging and FLAIR DW imaging have little T1 weighting and thus are not affected by increased T1 relaxation in parenchyma at 3T. In addition, the FLAIR TI does not change with field strength, so that CSF suppression with FLAIR DW imaging would be the same at 1.5T (13). Theoretically, field strength does not affect diffusion-imaging properties, and the choice of b value does not affect the degree of fluid suppression. Therefore, these results should be reproducible at other b values, including b = 1000 s/mm2 at 1.5T (the current clinical standard).
Conclusion
Our SNR and CNR results suggest that FLAIR DW imaging provides ischemic tissue conspicuity lower than that of DW imaging. Deriving ADC values from FLAIR DW imaging may have advantages, but FLAIR DW images may be inferior to DW images for the visual detection of hyperacute strokes.
Acknowledgments
We are grateful to Dr. M. Louis Lauzon for helpful discussions and Dr. Michael Eliasziw for statistical support.
Footnotes
Supported by the Alberta Foundation for Health Research, Alberta Heritage Foundation for Medical Research (AHFMR), the Canada Foundation for Innovation, the Canadian Institutes for Health Research (CIHR), the Heart and Stroke Foundations of Canada (HSFC) and of Alberta, NWT and Nunavut.
References
- Received December 23, 2003.
- Accepted after revision March 4, 2004.
- Copyright © American Society of Neuroradiology


