
Abstract
BACKGROUND AND PURPOSE: High-resolution imaging of the internal auditory canal and labyrinth at 1.5 T is often performed by using three-dimensional (3D) fast spin-echo or T2* techniques. We evaluated both techniques at 3 T in the preoperative assessment of patients being considered for cochlear implants.
METHODS: Sagittal 3D fast recovery fast spin-echo (FRFSE) and 3D constructive interference in the steady state (CISS) images were acquired in eight patients at 3.0 T by using dual surface coils. Contrast-to-noise ratios (CNRs) for the intracanalicular nerve and CSF were measured in the internal auditory canal. Two neuroradiologists reviewed the images to determine whether the techniques provided images of diagnostic quality.
RESULTS: CNRs for 3D CISS were twice those obtained with 3D FRFSE. Both techniques provided images of diagnostic quality, though spurious signal intensity loss at the apex of the superior semicircular canals was encountered on 3D FRFSE images in four of eight patients.
CONCLUSION: Both 3D FRFSE and 3D CISS provide high-resolution images of the internal auditory canal and labyrinth at 3.0 T. We predict that the superior CNRs obtained with 3D CISS will prove advantageous as we move to smaller fields of view at higher field strength.
Imaging plays a crucial role in the selection of candidates for cochlear implants to treat profound sensorineural hearing loss. High-resolution sequences using three-dimensional (3D) fast spin-echo and 3D gradient-echo techniques have been recently advocated for this type of application at 1.5 T (1–3). Two techniques we currently perform at 3.0 T to image the cochlear nerves and membranous labyrinth are 3D fast recovery fast spin-echo (FRFSE) and 3D constructive interference in the steady state (CISS), which is also referred to as fast imaging employing steady-state acquisition with phase cycling (FIESTA-C). We undertook this study to evaluate the strengths and weaknesses of both techniques.
Methods
All studies were performed on a clinical 3.0-T machine (GE Medical Systems, Milwaukee, WI) by using a hybrid phased-array coil to optimize both resolution and the signal intensity–to-noise ratio (SNR) (4). We examined eight cochlear implant candidates utilizing both techniques in the oblique sagittal plane, perpendicular to the long axis of the cochlear nerve. Efforts were made to standardize imaging parameters between the two techniques (eg, imaging time), but image quality and acceptance ultimately determined the imaging protocol. The inherently lower SNR of the 3D FRFSE technique prohibited imaging at fields of view (FOVs) smaller than 12 cm. 3D FRFSE was performed with the following parameters: 12-cm FOV, TR/TE/NEX of 2000/300/1, 32 sections of 1-mm thickness, 256 × 256 matrix, bandwidth of ±32 kHz, echo train length of 64, and an acquisition time of 4 minutes 23 seconds. FRFSE differs from standard fast spin-echo by the addition of a −90° pulse at the end of the echo train. The purpose of this pulse is to return transverse magnetization with a long T1 and a long T2, such as that of CSF, to the longitudinal axis. This in turn allows heavily T2-weighted images to be acquired with a shorter TR (eg, 2000 msec instead of 5000 msec) (5).
3D CISS was performed with these parameters: 10-cm FOV, TR/TE of 8/4, 32 sections of 1-mm thickness, 256 × 256 matrix, flip angle of 45°, bandwidth of ± 32 kHz, two phase cycles, and an acquisition time of 2 minutes 24 seconds. Phase-cycling involved two 3D steady-state datasets acquired sequentially, each with a specific radiofrequency phase shift added at every TR. This technique provided a means to reduce or eliminate banding artifact caused by susceptibility variation. Both acquisition techniques used zero-filled reconstruction in all three directions.
Two neuroradiologists (J.I.L., R.J.W.) reviewed the studies. Contrast-to-noise ratios (CNRs) between nerve and CSF were calculated in the internal auditory canal (IAC) by using both acquisition techniques. CNR was calculated by using mean signal measurements within regions of interest (ROI) drawn around the facial nerve (SFN), CSF in the IAC (SCSF), and background signal in the temporal bone (SBG). CNR was defined as (SCSF − SFN)/SBG. Facial nerve ROIs were used to avoid issues of cochlear-nerve atrophy in these profoundly deaf patients. Ratios of CNRs between protocols were calculated for each IAC to account for signal changes arising from anatomic differences and surface coil placement. Hypothesis testing was performed to evaluate the null hypothesis that the CNR of the two protocols were equal, or equivalently, to determine whether the mean ratio of CNR between protocols was equal to 1. Data were tested for normality, and a paired t test was performed.
Images were reviewed for definition of all four intracanalicular nerves (facial, cochlear, superior, and inferior vestibular), the modiolus and scalar lamina of the cochlea, all three semicircular canals, and the presence of an endolymphatic duct and for visualization of the seventh cranial nerve within the facial nerve canal (FNC).
Results
In all patients, 3D CISS resulted a CNR more than twice that of 3D FRFSE in the IAC (Table 1). The subjective evaluation of the structures within the IAC and membranous labyrinth are shown in Table 2. Nerve discrimination was satisfactory with both techniques (Fig 1), but the increased signal intensity in the IAC on 3D CISS images provided better nerve definition, particularly in patients with smaller IACs (Fig 2). The spiral lamina and modiolus were adequately visualized with both techniques (Fig 3). Loss of fluid signal intensity in the labyrinth, particularly in the semicircular canals, was encountered on 3D FRFSE images in one-half of the cases (Fig 4). Visualization of the FNC and endolymphatic duct was limited with both techniques (Figs 5, 6). Banding artifact inherent to the 3D CISS technique was partially corrected by using two phase cycles postprocessed as MIPs (Fig 7). Any motion during the two acquisitions caused significant misregistration artifact on MIP images (Fig 8).

Comparison of the IAC on oblique sagittal images.
A, Two-phase–cycled, 3D CISS reconstructed image oriented perpendicular to the long axis of the cochlear nerve demonstrates excellent signal intensity in the IAC good definition of all four nerves.
B, 3D FRFSE image demonstrates less intense CSF signal with greater background noise. Nerve definition is satisfactory.

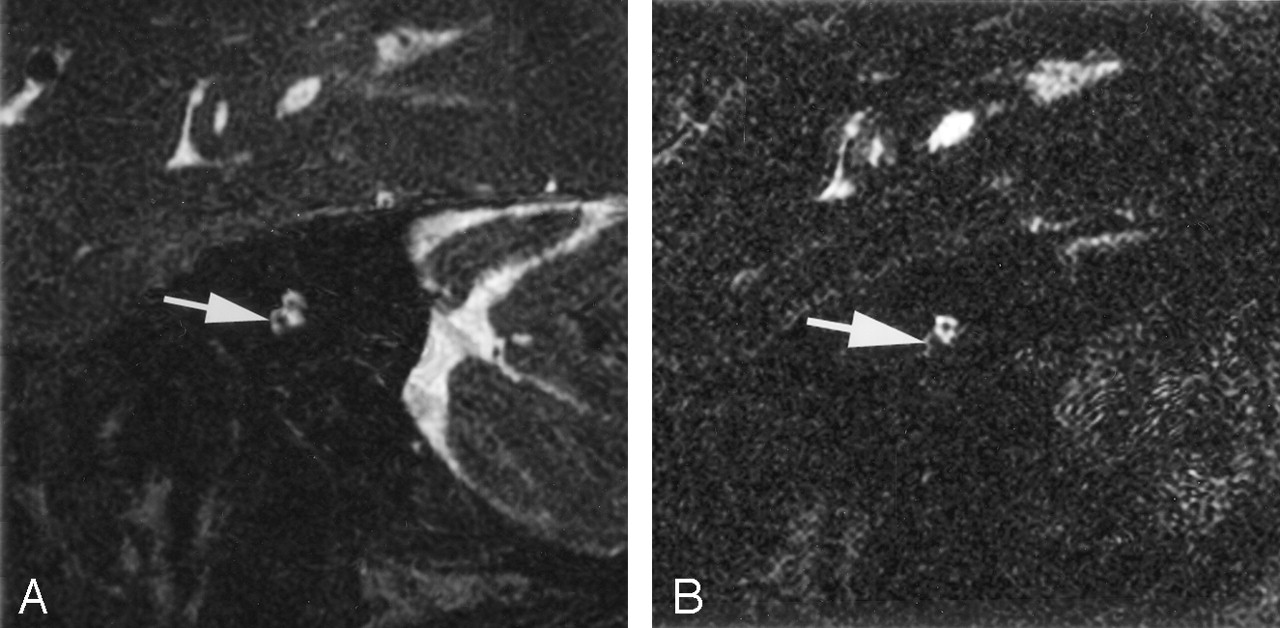
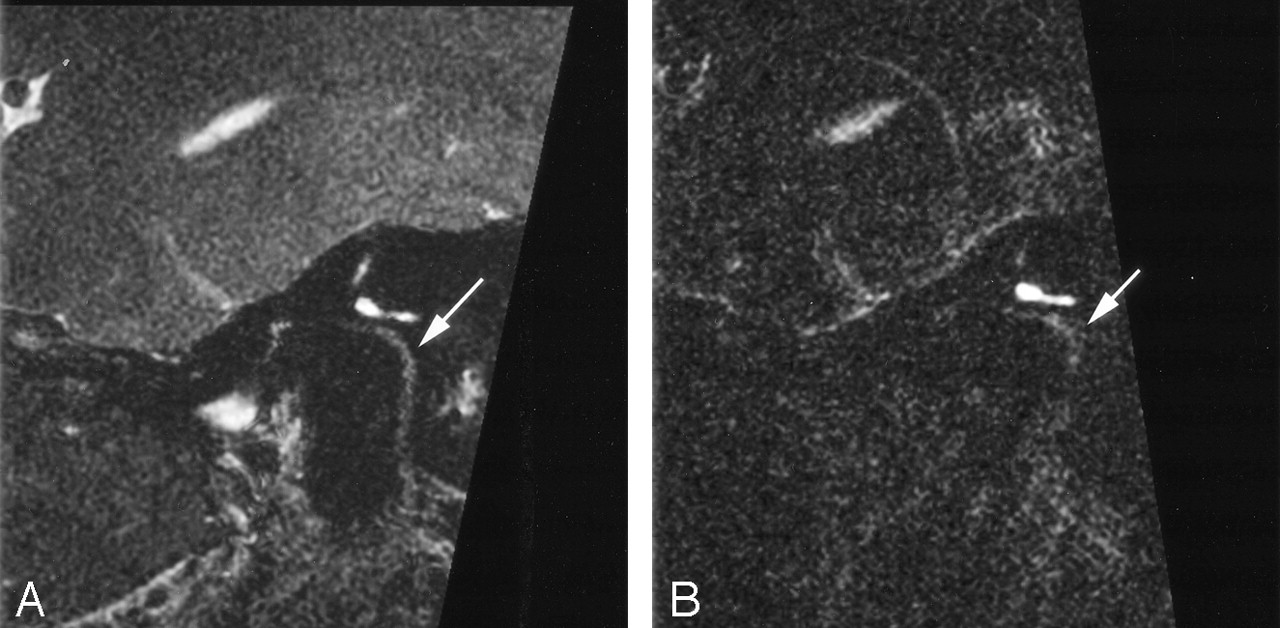
Comparison of a small IAC on oblique sagittal images.
A, 3D CISS image demonstrates satisfactory nerve definition within the IAC despite the small caliber of the bony canal. Note CSF surrounding the cochlear nerve (arrow).
B, 3D FRFSE image shows relatively low CSF signal intensity and high background noise. Note the loss of CSF signal intensity around the cochlear nerve (arrow).

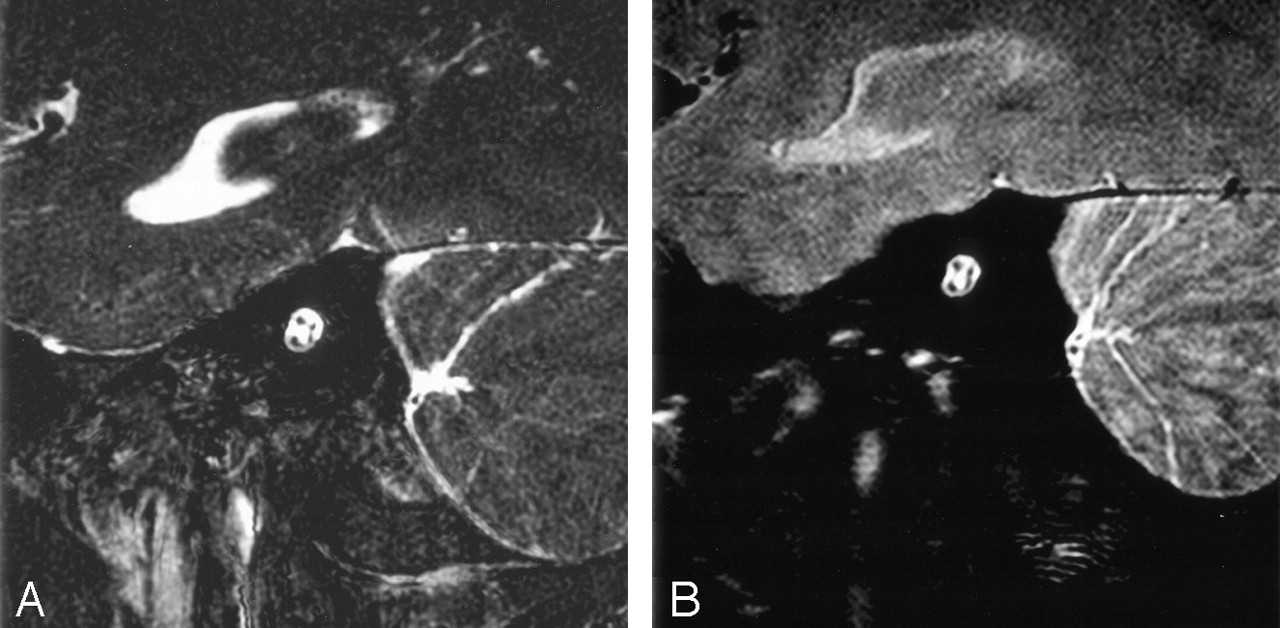
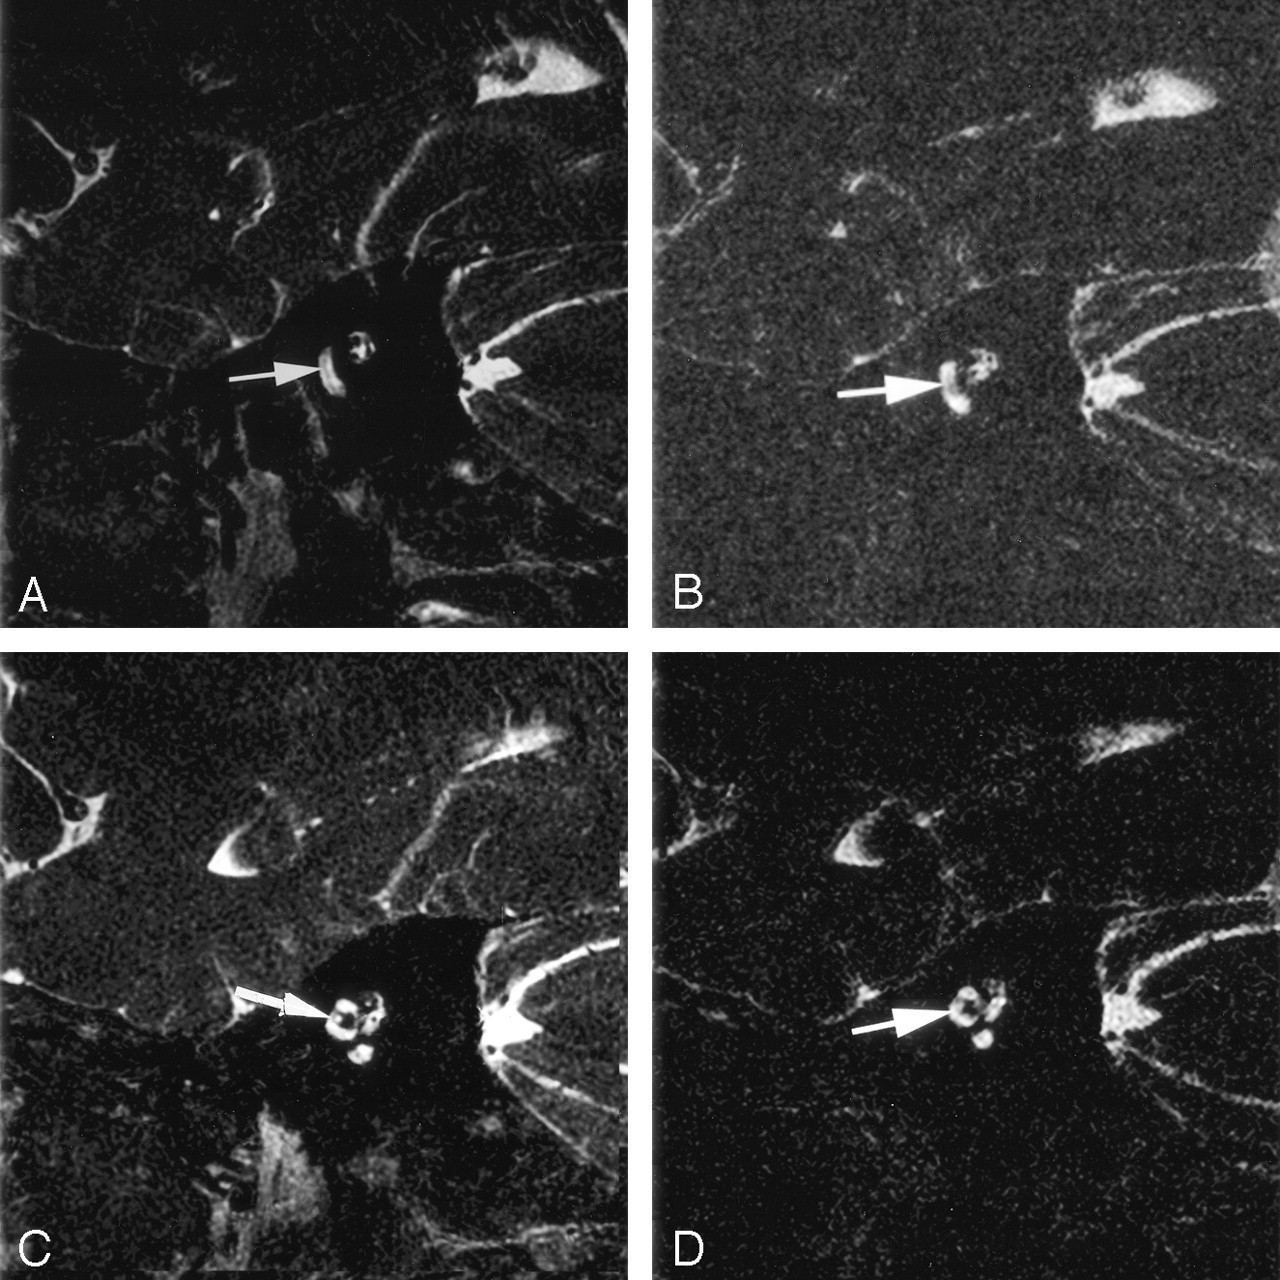
Comparison of the spiral lamina and the modiolus of the cochlea on oblique sagittal images..
A and B, 3D CISS (A) and 3D FRFSE (B) images demonstrate a linear focus of decreased signal intensity that represents the spiral lamina (arrow).
C and D, 3D CISS (C) and 3D FRFSE (D) images demonstrate the modiolus (arrow).

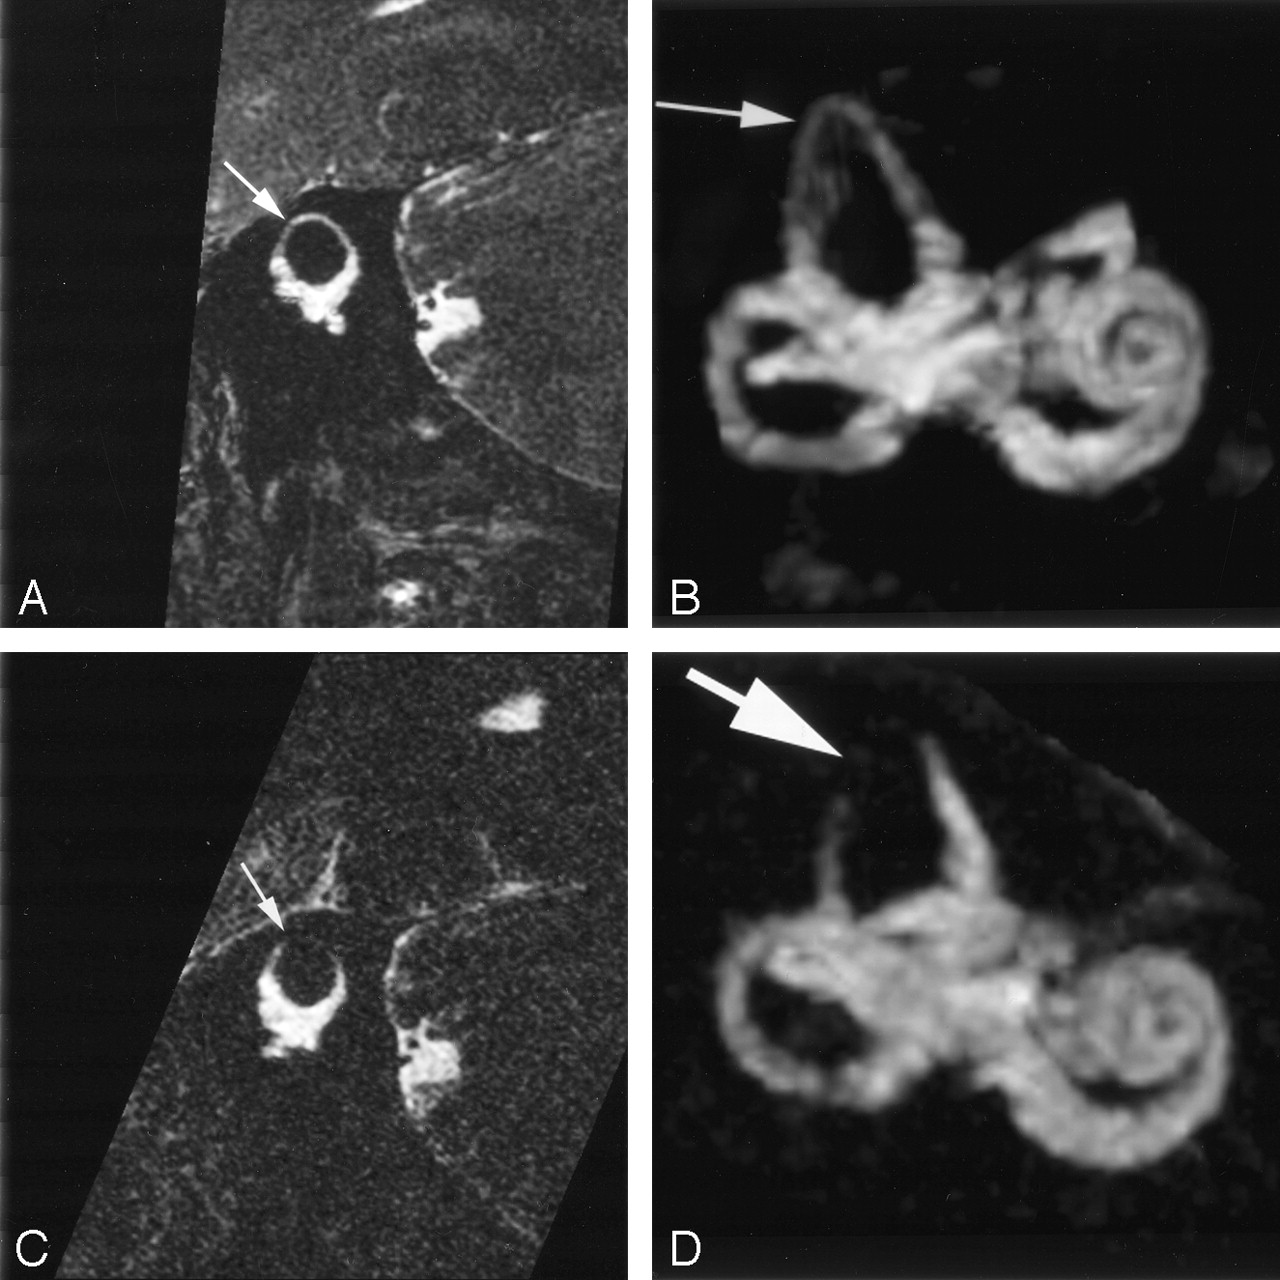
Comparison of the semicircular canal and its apex (arrow) on oblique sagittal images.
A, 3D CISS reformatted in the plane of the superior semicircular canal (SSC) demonstrates excellent definition of fluid in the apex.
B, Volume-rendered maximum intensity projection (MIP) of A shows intact fluid rings in all semicircular canals.
C, 3D FRFSE image also reformatted in the plane of the SCC demonstrates signal intensity loss at the apex.
D, Volume-rendered MIP of D also depicts this finding.

Comparison of the FNC (arrow) on oblique sagittal images.
A, 3D CISS image adequately displays the normal course of the FNC.
B, Corresponding 3D FRFSE image shows considerably less signal intensity.

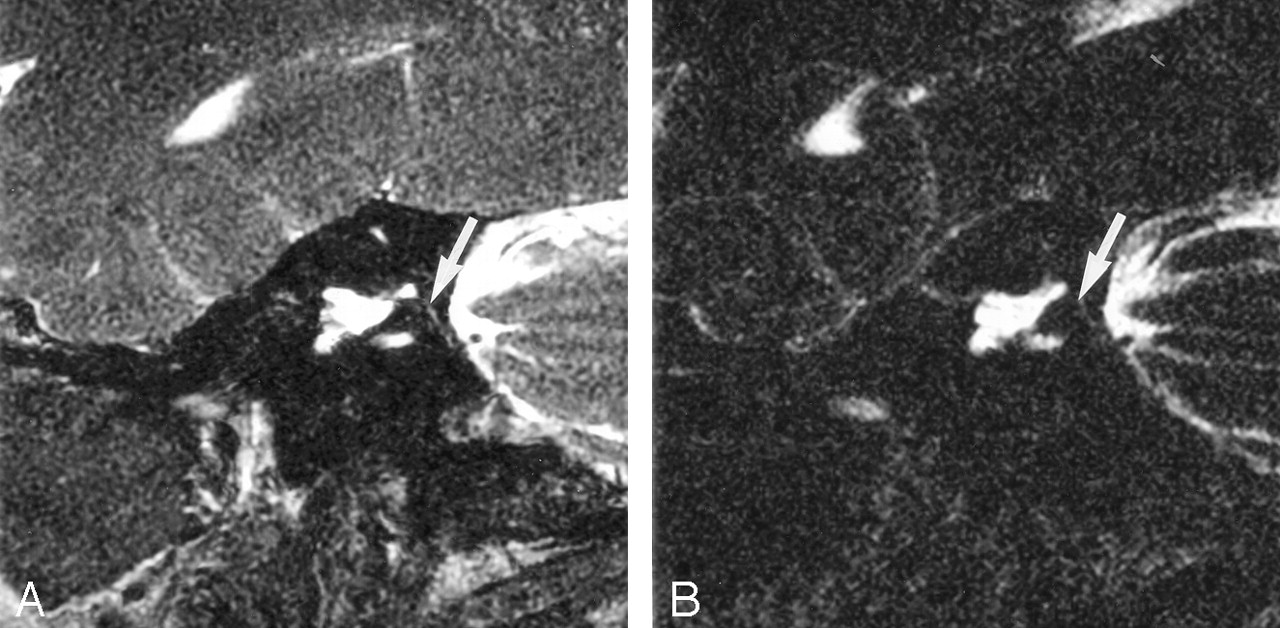
Comparison of the endolymphatic duct on oblique sagittal images.
A, 3D CISS demonstrates modest signal intensity in the normal small endolymphatic duct in the vestibular aqueduct, which is seen just medial to the common crus of the superior and posterior SSCs (arrow).
B, The duct (arrow) is barely identifiable on the corresponding 3D-FRFSE image. The window and level may need to be adjusted to visualize this normally small duct, which is often not visualized with either technique.

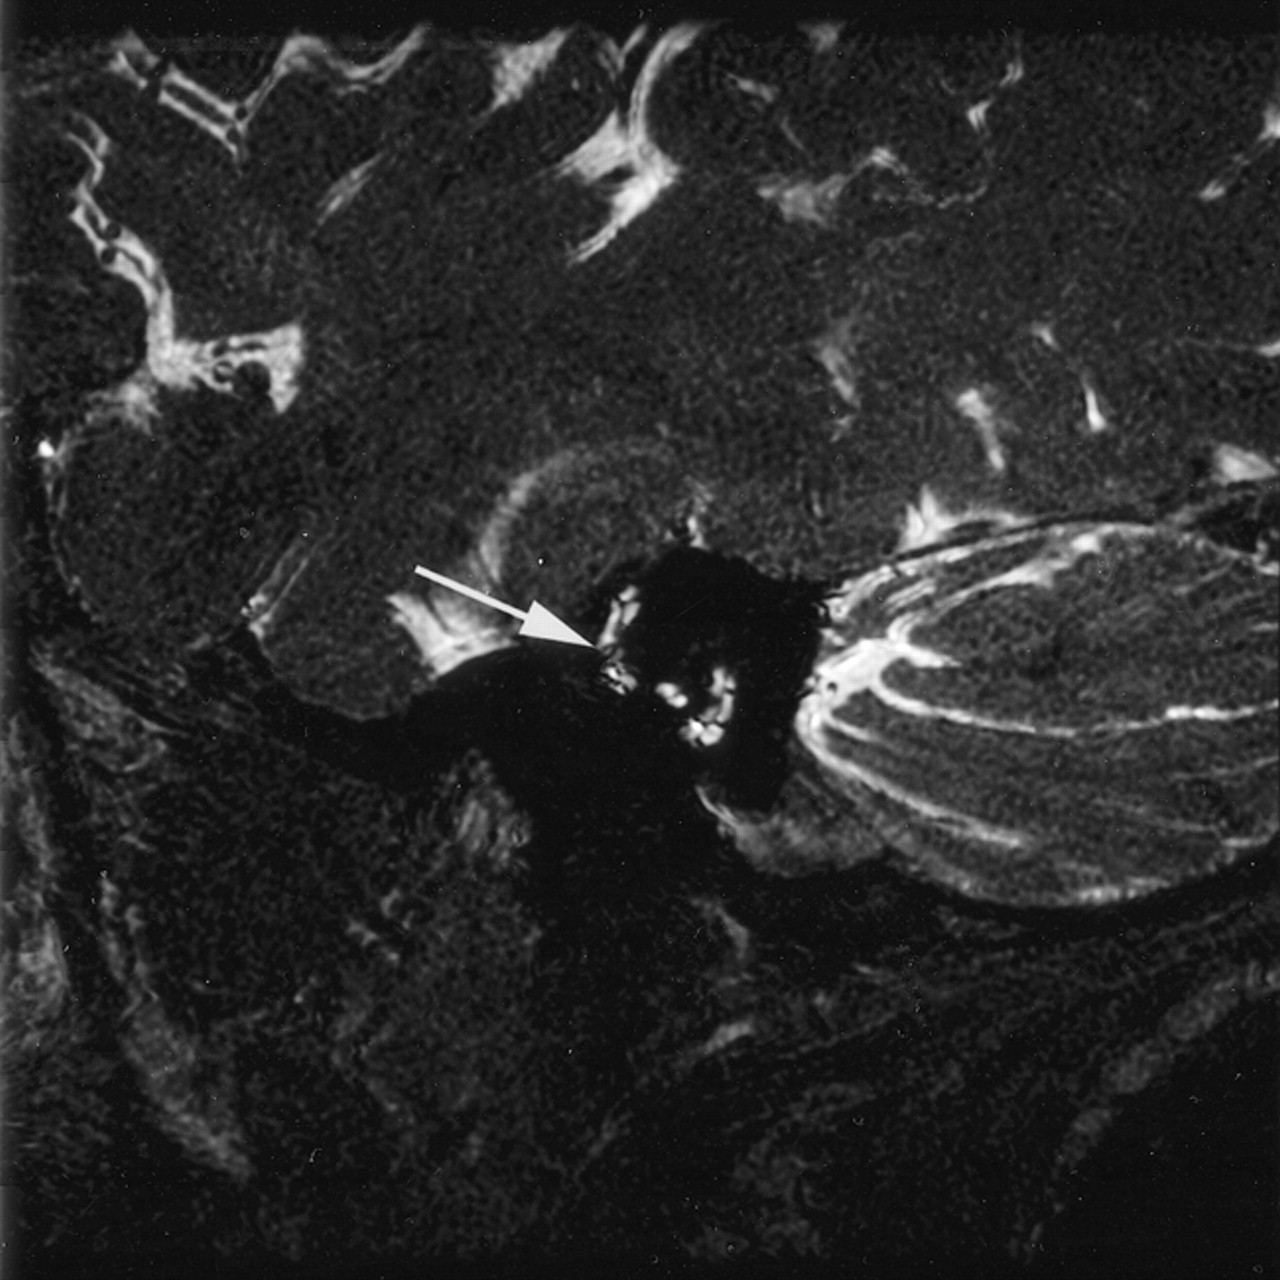
3D CISS banding artifact.
A, Oblique sagittal source image from two-phase–cycled 3D CISS demonstrates marked banding artifact through the SSC and vestibule (arrow).
B, Postprocessed MIP image at the same level demonstrates subtle irregularity of the contour of the SCC, which represents incomplete averaging of the banding artifact (arrow).

Motion artifact between phase cycles on 3D CISS images. Postprocessed MIP image fails to remove banding artifact secondary to patient motion during data acquisition (arrow).
Contrast-to-Noise Ratios
Subjective evaluation of the structures in the IAC and membranous labyrinth
Discussion
The increased CNR and improved resolution available on clinical 3-T units provides us the opportunity to advance high-resolution imaging of the cranial nerves. T2 and T2* 3D sequences have been advocated as techniques best suited for demonstration of the seventh and eighth nerves (2,6). Although these techniques have been compared at 1.5T, to our knowledge this is the first comparison at 3 T. Each sequence was optimized by using phantoms and volunteers before the clinical study was performed.
We considered both techniques equally capable of producing diagnostically acceptable images of the IACs and intracanalicular nerves (Fig 1). However, CNRs were superior with the 3D CISS technique. This difference was most notable when we imaged patients with small IACs (Fig 2). The relative paucity of CSF signal intensity in the small IACs with the 3D FRFSE technique made it difficult to define the margins of the cochlear nerve. The nerve was better depicted by using the 3D CISS technique because of its improved CNR.
The labyrinthine structures were better depicted by using the 3D CISS technique. Although both techniques resolved the spiral lamina and modiolus, edge definition was sharper with CISS (Fig 3). The loss of signal intensity in the SSC in four of eight patients with the FRFSE technique could potentially lead to misinterpretation as an anatomic anomaly (Fig 4). We directly attributed this result to the decreased CNR of the FRFSE sequence. We cannot adequately explain why this was noted more often in the SSC than in the lateral and posterior canals. Visualization of the endolymphatic duct was inconsistent both techniques (Fig 6, Table 1) and probably related to the small size of the duct in the healthy patient. The 3D CISS technique more reliably depicted the FNC (Fig 5, Table 1) than did 3D FRFSE; this difference was most likely related to its increased CNR.
We attempted to keep imaging time in the range of 4 minutes to reduce patient motion artifacts. This time constraint required an echo train length of 64 for the FRFSE technique. Therefore, we had to accept some image blurring, a limitation inherent to fast spin-echo techniques that results from the long echo trains needed to achieve heavily T2-weighted images in as short a time as possible. Image blurring can be minimized by reducing the echo train length at the expense of increasing imaging time.
Banding artifact was problematic with the CISS technique and partially compensated for by MIP processing of the two phase cycles (Fig 7). In general, banding is more problematic at 3.0 T than 1.5 T because susceptibility changes linearly with field strength. Increasing the number of phase cycles from 2 to 4 reduces banding artifacts at the expense of doubling the imaging time. We are currently working on a nonlinear averaging technique that promises to be more effective in removing banding artifact
Motion artifact was problematic with both techniques. It was particularly troublesome when any motion occurred between acquisitions of the two phase cycles of the CISS sequence (Fig 8). Preliminary results with motion correction algorithms show promise in addressing this issue. We noted no problems with susceptibility artifact on the 3D CISS images, an observation also made by Schmalbrock (2) in a comparison of 3D FRFSE with 3D gradient-echo acquisitions at 1.5 T. Schmalbrock also noted more loss of fluid signal intensity in the cerebellopontine cisterns secondary to CSF pulsation on FRFSE images, a finding that was also evident in our series. This could be an issue in evaluating the integrity of the cisternal segments of the cranial nerves.
Conclusion
Both techniques provide reliable definition of the pertinent anatomy in the clinical setting of an evaluation for a cochlear implant. Improved CNR in the IAC with 3D CISS may lead to more accurate assessment of nerve integrity. Further refinement of the 3D CISS technique will need to address problems related to banding artifact and motion sensitivity. Although 3D FRFSE remains useful in the imaging of candidates for cochlear implants, its relatively low CNR will limit its utility compared with 3D CISS as we move toward higher resolution at smaller FOV.
- Received July 11, 2003.
- Accepted after revision September 10, 2003.
- Copyright © American Society of Neuroradiology
In this issue


Jump to section
Related Articles
Cited By...
- Correlation between Histopathology and Signal Loss on Spin-Echo T2-Weighted MR Images of the Inner Ear: Distinguishing Artifacts from Anatomy
- Diagnostic Accuracy of Screening MR Imaging Using Unenhanced Axial CISS and Coronal T2WI for Detection of Small Internal Auditory Canal Lesions
- High-Resolution MRI of the Intraparotid Facial Nerve Based on a Microsurface Coil and a 3D Reversed Fast Imaging with Steady-State Precession DWI Sequence at 3T
- 3D Double-Echo Steady-State with Water Excitation MR Imaging of the Intraparotid Facial Nerve at 1.5T: A Pilot Study
- Is All "Communicating" Hydrocephalus Really Communicating? Prospective Study on the Value of 3D-Constructive Interference in Steady State Sequence at 3T
- Detailed MR Imaging Anatomy of the Cisternal Segments of the Glossopharyngeal, Vagus, and Spinal Accessory Nerves in the Posterior Fossa: The Use of 3D Balanced Fast-Field Echo MR Imaging