
Abstract
BACKGROUND AND PURPOSE: Standardized time to peak (stdTTP) enables a quick quantification of time to peak measurements. An stdTTP ≤3.5 seconds is reported to be regular, and evidence suggests that an stdTTP ≥7 seconds indicates critically perfused tissue. We verified this stdTTP in acute ischemia (within the first 6 hours after the onset of symptoms), when perfusion is critical, and after 24–72 hours.
METHODS: Combined diffusion-weighted imaging (DWI) and perfusion MR imaging was performed in 20 consecutive patients with acute cerebral ischemia. Distributions of stdTTP ≥7 and ≤3.5 seconds were analyzed in corresponding regions with (ischemic injury) or without (no ischemic injury) substantial hyperintensity on DWI in both hemispheres. Follow-up examinations were available in 11 patients.
RESULTS: About 80% of voxels in regions with ischemic injury showed an stdTTP ≥7 seconds. StdTTP of about 80% of voxels was ≤3.5 seconds in regions without ischemic injury. In both conditions, 14% of stdTTP values were between 3.5 and 7 seconds. We found a strong correlation between areas with stdTTP ≥7 seconds and resulting infarct (r2=0.86).
CONCLUSION: StdTTP is reciprocal in regions with and without ischemic injury. An stdTTP ≥7 seconds (regular range) is strongly correlated with resulting infarct and reflects critical perfusion with a high probability of ischemic tissue injury in acute ischemia, whereas this is unlikely in regions with stdTTP ≤3.5 seconds (regular range). An stdTTP of 3.5–7 seconds is equivocal concerning ischemic injury and may indicate a tolerable perfusion condition.
Standardized time to peak (stdTTP) is a parameter quickly applicable for evaluation of MR perfusion images because measurements in other sections than the relevant brain sections or selection of regions of interest (ROIs) for any input curve by the examiner is not needed. In patients with regular and hemodynamically compromised perfusion, stdTTP in the range of 0–3.5 seconds is related to regular perfusion (1–3). In compromised perfusion stdTTP significantly exceeded 3.5 seconds, but the distinction between still tolerable and already critical perfusion in this range was not possible. A higher incidence of watershed infarctions in few patients in one study suggested an stdTTP ≥7 seconds in the border zones to be critical, but this finding remained unproven (3). However, the assessment of critical perfusion by using stdTTP would be useful for correct estimation of perfusion disorders. To investigate whether stdTTP ≥7 seconds is related with regional critical perfusion or not, stdTTP was measured in acute ischemic lesions and compared with stdTTP in corresponding regularly perfused regions in the contralateral hemisphere.
Methods
Twenty consecutive patients (15 male, five female; mean age ± SD, 58.3 ± 13.5 years, range, 17–80 years) with acute ischemic brain infarcts were retrospectively investigated. All patients were examined according to the approved institutional protocol for stroke assessment. The period between onset of symptoms and the MR examinations was 0.9–5.3 hours. Follow-up examinations by using the same protocol were available in 11 patients and were performed 1–3 days after the initial event.
Imaging
Perfusion MR imaging was performed as dynamic susceptibility contrast-enhanced MR imaging on 1.5-T units (Gyroscan ACS-NT and Intera; Philips, Best, the Netherlands) by using a single shot T2*-weighted sequence (TR/TE/NEX, 710/20/1; flip angle, 45°; effective echo-planar imaging factor, 39) with 20 axial sections. The first pass of an intravenously administered bolus of contrast agent was traced over of 60 seconds with a temporal resolution of about 725 milliseconds. The bolus (gado-teridol, 0.2 mmol/kg) was administered through a 20-gauge venous cannula into a cubital vein with an 8-mL/second flow rate, by using an MR-motor injector (Spectris; Medrad-Europe, the Netherlands). The acquisition matrix was 80 × 80 with a FOV of 240 mm, a section thickness of 6 mm, and a 0.1-mm gap. The images were reconstructed within a matrix of 256 × 256. DWI was performed with a spin-echo, echo-planar sequence in three orthogonal directions with two b values (bmax=1000 seconds/mm2) with additional calculation of apparent diffusion coefficients (ADCs) to avoid misinterpretation of b images from underlying interfering T2 effects. The same image geometry as for perfusion MR imaging was applied. Additionally, a geometrically matched dual-echo inversion-recovery sequence (TR/IR/TE/NEX, 7000/1800/110/3) was performed to demonstrate T2-related alterations due to ischemia (echo 2) and possible pre-existing older postischemic disruptions in the blood-brain barrier (echo 1) with sufficient liquor suppression in both echoes. Finally, a fast CE MR angiography was performed covering the range from the aortic arch to the circle of Willis to assess underlying cerebrovascular disease.
Postprocessing and Statistical Analysis
The data were transferred to a workstation, and regional stdTTP was calculated. The measured volume consisted of 20 sections, where each section contained the dynamic information of 80 images measured during 1 minute. To exclude voxels outside the brain, mask- and time-leveling was applied to each section of the measured volume. Only voxels with a signal intensity change six times higher than background noise (confidence level) were enclosed as measurably perfused into further assessment. Peak enhancement for each voxel was calculated according to its absolute time position in the dynamic images, and a 3% offset level for stdTTP calculation per section was introduced. With this procedure, the time point when the first 3% of voxels in each section reached their peak enhancement was identified. This time point was considered the starting point of the bolus entering the individual section and was called offset by definition. StdTTP was calculated in each section as the difference between the offset and the peak enhancement time of each voxel; by definition, the 3% of voxels contributing to calculation of the offset had a value of zero. Thus, every voxel had an absolute stdTTP value given in seconds after this subtraction. Although the absolute time point of the offset from the different sections varied, all offsets were considered as equivalent, simulating simultaneity of perfusion of each section. (In absolute time, the bolus enters sections closer to the skull base earlier than those closer to the vertex, whereas in relative time, ie, after application of stdTTP calculation, the contrast bolus seems to reach each section simultaneously.)
Simulated simultaneity due to offset calculation in stdTTP solved some problems known to other methods, at least with measurements in the axial plane, where this method was tested. First, the 3% offset was not calculated from one input vessel alone (except when there was only one vessel), but it received its time-to-peak (TTP) values from arterial voxels from all represented territories in each section. Therefore, the computer weighted the offset independently from the user with respect to different major input vessels to the measured volume of each section. Second, because offset calculation was based on the TTP values of early enhancing (or arterial) voxels in a section and per definition all offsets are treated as equivalent, stdTTP could be calculated, even without visualization of arteries near the skull, as no ROI had to be positioned. Third, the proposed offset acted as an internal standard (hence the term stdTTP), where simply the early perfused voxels (normally arterial voxels in central vascular territories) and late perfused voxels (normally voxels in border zones or those representing veins) were compared and an absolute value of this comparison was given. Therefore, in case of a regional perfusion deficit (as in focal ischemia), the absolute stdTTP value could serve in the diagnosis without the need to compare the affected and unaffected side, as this feature was already built in by using the proposed offset. Most other TTP methods with most complicated calculations end up with such comparisons of the affected and corresponding contralateral regular region (eg, testing the predictive power of TTP to estimate resulting infarct volume); this fact underlines the practicability of stdTTP. Ranges for stdTTP comparable to measurements for regional cerebral blood flow have been evaluated and investigated (for more details, see reference 2). Thus, absolute stdTTP values were assessed as follows.
For the evaluation stdTTP, maps were overlaid with corresponding isotropic b=1000 seconds/mm2 DWI maps after a 512 × 512 matrix frame for both image types was applied. ROIs were drawn according to the visually obvious margins of the acute ischemic lesions, as depicted on DWI maps in consensus by two neuroradiologists (C.N., S.K.); thresholding or standardization of ADC values, as proposed in the literature, does not yet hold a proved advantage in routine work. DWI and ADC maps could easily be switched by using the evaluation software during the assessment. In three cases, no underlying high T2-signal intensity (which might have shone through on DWI) was encountered, except in reference regions. ADC maps were used to differentiate recent infarction from old lesions. After these ROIs were projected onto the corresponding stdTTP maps, the regional stdTTP values were recorded into separate files (group 1, infarction). In the contralateral hemisphere, the region corresponding to the acute ischemic lesion was evaluated in the same way, with ROIs comparable to those in the ischemic hemisphere (group 2, reference). The sizes of some reference ROI sizes had to be adapted with respect to the different shapes of the sulci and gyri in the two hemispheres. Regions of pathologic hyperintensity on the T2-weighted images that indicated chronic lesions were not included into the measurements. Chronic lesions and ROIs were separated by at least 1 cm. The size of the resulting lesions was additionally measured on available follow-up DWIs and compared with the sizes of the initial critically and tolerably perfused volumes on the stdTTP map.
Descriptive statistics assessed were the mean, SD, and median values. Because no normal distribution of data was expected, frequencies of regional stdTTP values were examined. Differences between groups were analyzed by using the nonparametric Kruskal-Wallis test at a 0.05% level of significance. Linear regression and r2 (Pearson) was calculated for comparison of volume sizes. The data quality was considered to be rationally scaled.
Results
In two cases, the ROIs had to be significantly altered for the reference measurements (one old infarct with high signal intensity on T2-weighted images and one acute hemodynamic infarct with restricted diffusion on isotropic maps with b=1000 seconds/mm2). In total, 211,973 voxels in group 1 (infarct) and 301,474 voxels in group 2 (reference) were evaluated. In group 1, 158,919 (75%) voxels showed measurable perfusion, whereas in group 2, 296,397 (98%) voxels with perfusion could be measured. After the exclusion of nonperfused voxels in both groups, stdTTP was 12.4 ± 7.6 seconds in group 1 and 1.9 ± 2.1 seconds in group 2. The two groups were significantly different with nonparametric statistical testing (Kruskal-Wallis, P < .05). Included the nonperfused voxels, the median was 14.64 seconds in group 1 and 1.46 seconds in group 2. The difference between groups 1 and 2 in the range of 3.5<stdTTP<7 seconds was significant (t test for independent samples, P < .05).
Considering nonperfused voxels as equivalent to an stdTTP ≥7 seconds (critically perfused), the following distribution of stdTTP values was found: In group 1 (infarct), 79.9% of the voxels exhibited an stdTTP ≥7 seconds, and 12.7% of the voxels showed an stdTTP of 3.5–7 seconds (mean ± SD, 5.2 ± 1.04 seconds; median, 5.5 seconds). Therefore, 92.6% of all voxels in group 1 (infarct) showed an irregular perfusion assessed with stdTTP measurement.
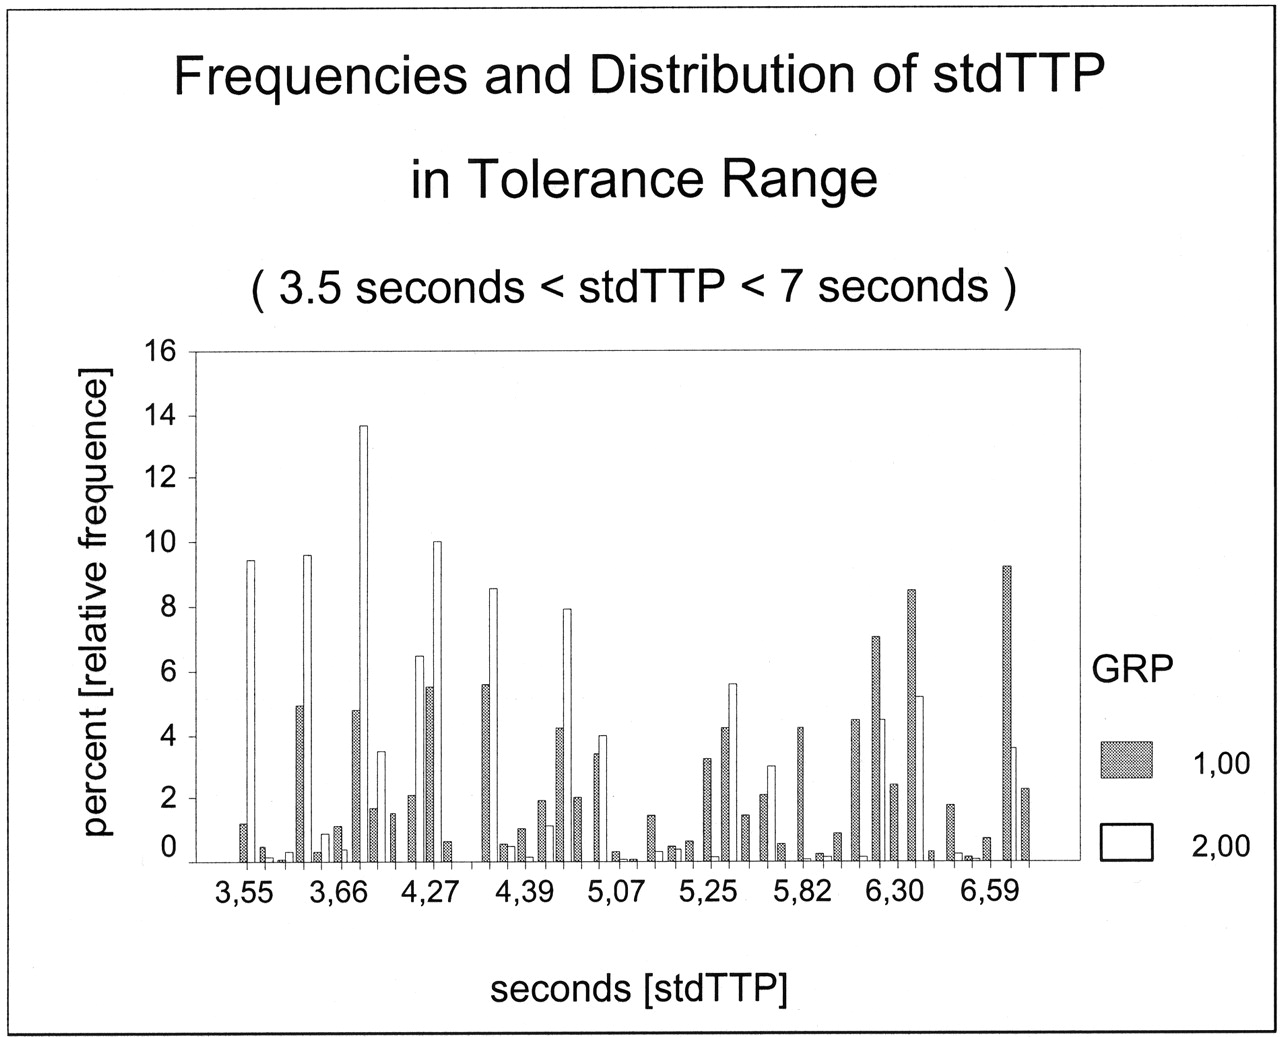
In group 2, 3.7% of all voxels exhibited an stdTTP ≥7 seconds, 14.8% of the voxels showed an stdTTP between 3.5 and 7 seconds (mean ± SD, 4.5 ± 0.95; median, 4.3 seconds) and 81.5% were within the regular range. Therefore, only 18.5% of the voxels in group 2 exhibited had an irregular perfusion (Fig 1).

Frequencies of stdTTP values in group 1 (infarct) and group 2 (reference). The predefined limits of the proposed model for stdTTP were as follows: stdTTP ≤3.5 seconds=regular range, stdTTP ≥7 seconds=critical range, and 3.5 seconds<stdTTP<7 seconds = tolerance range. A complementary distribution of stdTTP between infarcted and normal areas is depicted. In the tolerance range (about 13.5% of all voxels in both groups), interpretation of the perfusion measurement was possible depending on the context.
Volumes in acute ischemia showing stdTTP in the critical range, those with stdTTP in critical and tolerance range, and those with obvious DWI alterations were compared with the volumes of the resulting infarcts derived from DWIs after 24–72 hours. A linear regression analysis forcing the curves through the origin and Pearson correlations with estimation of r2 were used (Fig 2). The correlation of volumes with critical stdTTP during acute ischemia and in the resulting infarct volume was strong (Pearson corrected r2=0.86, r=0.933), as was the correlation of volumes containing critical and tolerable stdTTP in acute ischemia and the resulting infarct volume (Pearson corrected r2=0.82, r = 0.913). However, the correlation between DWI alterations measured in acute ischemia and those in resulting infarctions was weak (Pearson corrected r2=0.45, r = 0.708).

Linear regression analysis.
A, Comparison of volumes derived from stdTTP measurement during acute ischemia, with only critically perfused voxels (stdTTP ≥ 7 seconds) taken into account, and DWI findings in the resulting lesion after 24–72 hours (linear regression through the origin; Pearson corrected r2=0.86, r=0.933). In larger (nearly complete hemispheric) infarcts, there may be a slight tendency to underestimate the resulting ischemic volume, as defined by DWI.
B, Comparison of volumes derived from stdTTP measurement during acute ischemia, with critically and tolerably perfused voxels (stdTTP > 3.5 seconds) taken into account, and DWI findings in the resulting lesion after 24–72 hours (linear regression through the origin; Pearson corrected r2=0.82, r=0.913). The stdTTP volumes contain voxels with stdTTP in the critical (≥7-second) and tolerable (3.5–7- second) ranges during acute ischemia. The results suggest a tendency to overestimate the resulting ischemic volume, as defined by DWI, especially in smaller infarcts.
C, Comparison of volumes derived from DWI during acute ischemia and from DWI of the resulting lesion after 24–72 hours (linear regression through the origin, Pearson corrected r2=0.45, r = 0.708). Cytotoxic edema develops over time; therefore, in acute ischemia, DWI cannot predict the possible size of the infarction. Nevertheless, DWI is essential to exclude ischemic injury in tissue at risk; the latter is defined, eg, by stdTTP measurements.
Discussion
In cerebrovascular disease, a quantitative measure is useful for the exact assessment of the degree of a perfusion impairment. Perfusion MR imaging with the calculation of stdTTP can be used to reach this objective.
Former studies reported that an stdTTP ≤3.5 was related to regular perfusion (1, 2). Although an stdTTP >3.5 seconds may indicate a perfusion disorder, the critical stdTTP range with a high risk of ischemic tissue injury is significantly above this value. Accordingly, in one study, a higher incidence of watershed infarcts was found with an stdTTP ≥7 seconds in border zones, but because of the small number of cases in this study, this finding was not significant (3). Therefore, to prove the relevance of this observation, stdTTP in conditions of critical cerebral perfusion was evaluated again.
Analysis of acute restriction of cerebral perfusion reveals that the related hemodynamic disorder worsens gradually from the marginal zone to the center, which refers to the most severely affected part of the impaired region. Hemodynamic impairment, as visualized with stdTTP, can therefore contain all grades from nonperfusion (center) to nearly regular perfusion (margin). Not every grade of the hemodynamic disorder leads to an ischemic injury because residual perfusion just sufficient to prevent neurons from death may persist. Hence, the area with hemodynamic impairment visualized with stdTTP is nearly always larger than the demonstrable ischemic injury, which is often falsely interpreted as overestimation of the resulting infarct by perfusion measurement. A critical perfusion deficit may be considered only if a demonstrable ischemic tissue injury directly results. According to published experimental data, any substantial increase in signal intensity on DWI during acute ischemia represents ischemic tissue injury, regardless whether or not the diffusion alteration resolves after time (4). StdTTP measured only in regions with DWI alterations during acute ischemia should therefore represent critical perfusion because these alterations can be considered to be the most direct consequence of ischemia. Therefore, if it is sensitive for ischemia at all, stdTTP should exhibit critical values. For several reasons (eg, duration of ischemia, thrombus migration, drop in blood pressure, local microcirculation failure due to progressive local edema, and also early reperfusion), regional hemodynamic impairment may change substantially in the course of acute ischemia. Therefore, a comparison of the resulting infarct size, which is the product of many dynamic processes caused by ischemia, with perfusion measurement in acute ischemia, which shows the perfusion condition at the beginning of only a possible resulting infarct, seems to be less accurate in defining a critical perfusion condition indicated by a perfusion parameter. Consequently, the critical range for stdTTP was investigated within the first 6 hours after the onset of clinical symptoms in regions where an ischemic injury could be differentiated by DWI as a direct consequence of ischemia at the time injury occurred.
In ischemic regions (group 1) 79.9% of voxels had an stdTTP ≥7 seconds, whereas in unaffected brain (group 2), only 3.7% of voxels had an stdTTP in that range. In regular brain tissue, voxels were excluded from the calculation if the regional signal intensity–to-noise ratio was insufficient, eg, when the contrast medium bolus was highly diluted. Furthermore, the absence of pathologic T2-weighted signal intensity and diffusion alteration (inclusion criteria for regular tissue in this study) did not completely exclude microangiopathic disease with small perfusion deficits. Although the same effects also existed in critically perfused regions, these voxels were masked and contributed to the nonperfused cohort of voxels. On the other hand, in regions with ischemic injury, about 7% of the apparently regularly perfused voxels were mainly the result of an involuntarily, inexact projection of DWIs onto the stdTTP maps due to different image distortions on perfusion MR images and DWIs.
In group 1, about 13% of voxels showed an stdTTP in the range of 3.5–7 seconds, though an stdTTP ≥7 seconds was expected in the regions that were ischemic by definition. This suggests the application of a lower limit for stdTTP in critical perfusion. This finding also substantiates the suggested limit of stdTTP ≤3.5 seconds for regular perfusion. When we applied this limit, 92.6% of the voxels in ischemically injured areas and 81.5% of the voxels of regular brain tissue were correctly identified. Unfortunately, this was not a realistic reflection of the nature of hemodynamic disorders. A new, lower threshold for the critical range would not explain voxels without ischemic injury above this threshold. On the other hand, using a higher threshold for regular perfusion would not explain ischemic voxels in this regular range. To overcome this problem, the application of a tolerance range between regular (3.5 seconds) and critical (7 seconds) seems to be reasonable. About 13% of voxels in group 1 and 15% of those in group 2 had an stdTTP between 3.5 and 7 seconds. Although stdTTP values in group 1 tended toward the critical limit while values in group 2 tended toward the regular limit, it is clear that within the range of 3.5–7 seconds, voxels with ischemic injury are often represented as often as voxels without ischemic injury (Fig 3). One can consider whether this tolerance range is a first indicator for cerebrovascular disease in apparently regular tissue or whether it indicates regions in ischemic tissue that are most likely to recover. Both possibilities can influence therapy planning. Therefore, the concept of a three-range model to apply stdTTP appears to be promising. The importance of still-tolerable but irregular perfusion in cerebrovascular disease must be evaluated further. However, as a consequence of the proposed three-range model for stdTTP, cerebrovascular disorders might begin earlier than the morphology shows.
The comparison of stdTTP measurements and resulting infarct sizes emphasizes a high predictive value of this three-range model for ischemic infarction. Because of the small number of follow-up examinations, the differentiation of subgroups was statistically problematic; however, some tendencies could be shown. Using stdTTP in the critical range as an indicator of a high risk of ischemic injury works perfectly in small and medium infarcts. However, large (hemispheric) infarcts are slightly underestimated. The main difference between these infarcts and smaller ones is the extent of local edematous swelling. In addition, local perfusion seems to be progressively diminish with the continuing increase in infarct volume over time. Because severe edematous swelling is not present in the very acute phase of ischemia, when the initial stdTTP measurement is performed, the amount of tissue at risk appears to be smaller than the resulting infarct. Adding regions with stdTTP in the tolerance range to the investigated volumes improves the prediction of the size of large infarctions, but it leads to an overestimation of smaller ones. Therefore, regions with an stdTTP in the critical range are the first areas affected by ischemic injury in acute ischemia, whereas those with an stdTTP in the tolerance range are affected second, when additional factors modify the initial ischemic event. However, the prognosis for ischemic injury in these latter areas is uncertain, though cerebrovascular disease may be indicated. As a result, a comparison of different volumes and resulting infarcts directly reflects the conclusions derived from direct measurement of early ischemic injuries. The proposed three-range model for stdTTP measurements seems to be a practical tool for assessing acute ischemia (Fig 4a–c).

Frequencies of stdTTP values in group 1 (infarct) and group 2 (reference) in the tolerance range. Within the range of 3.5–7 seconds, voxels with ischemic injury (group 1, 12.7%) are represented as often as voxels without ischemic injury (group 2, 14.8%). A tendency of stdTTP values in group 1 (median, 5.5 seconds) toward the critical limit of 7 seconds and in group 2 (median, 4.3 seconds) toward the regular limit of 3.5 seconds is shown. A clear cutoff value between critical and regular perfusion cannot be determined.

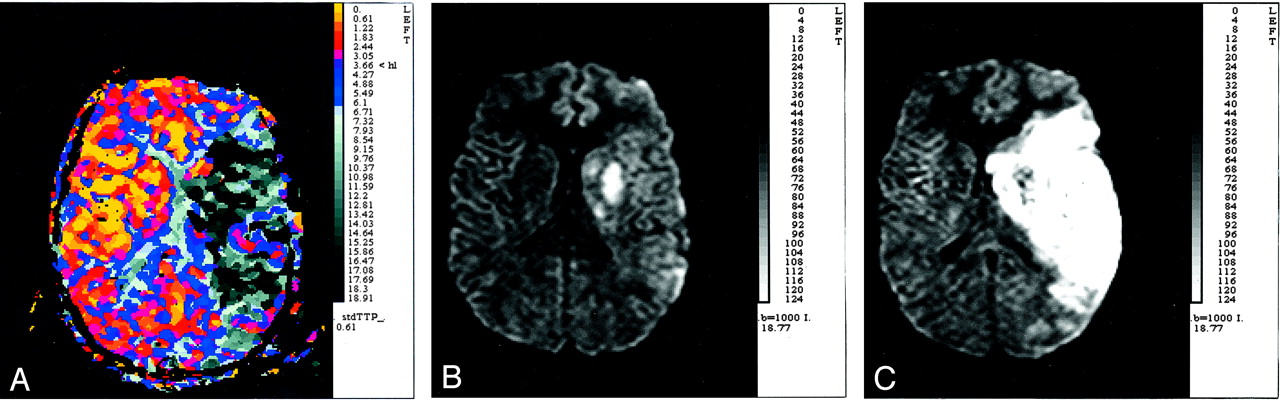
StdTTP measurements as a tool for assessing acute ischemia.
A, StdTTP map (time resolution, 610 milliseconds; unit of scale, seconds) calculated within the first 6 hours (at 1.5 hours) after the onset of stroke symptoms. Although the patient was agitated during imaging, the study is interpretable. The depicted hemodynamic disorder gradually worsens from the margins to the center, which is an area with nonperfusion (black) in the central territory of the left middle cerebral artery. The surrounding tissue had stdTTP values of ≥7 seconds (gray), which indicate critical perfusion. At the margins, stdTTP is in the tolerance range (blue).
B, DWI map (isotropic b=1000 seconds/mm2) of the corresponding section of the stdTTP map in A. DWI was performed during the same examination as perfusion MR imaging but reveals an only a small area of ischemic injury.
C, DWI map (isotropic b=1000 seconds/mm2) of a section comparable to those in A and B obtained 24 hours after the initial event. This study reveals an ischemic injury (infarct) that now almost entirely matches the area indicated as critically perfused in A. Critical perfusion, depicted as stdTTP ≥7 seconds, seems to suggest a high risk of ischemic injury in brain tissue. Additionally, severe edematous swelling of the hemisphere is depicted in this large infarct.
During acute ischemia when the decision for treatment or no treatment is made, evidence suggests that DWI measurement alone is insufficient because of severe underestimation of the possible extent of ischemic injury and limitations in predicting resulting infarct volume. Nevertheless, in this period, DWI is essential to (widely) exclude ischemic injury of tissue at risk, as identified by stdTTP measurements, which indicate the tissue that can benefit most from therapy.
Conclusions
We propose a regular range (0 ≤ stdTTP ≤ 3.5 seconds), a critical range (stdTTP ≥7 seconds), and a tolerance range (3.5 < stdTTP < 7 seconds) for the interpretation of stdTTP maps. StdTTP in the regular range indicates an extremely low value, and stdTTP in the critical range indicates a high risk of ischemic injury. StdTTP in the tolerance range suggests a perfusion disorder, but the correct interpretation of findings in the tolerance range must be based on the perfusion context, ie, ischemia or no ischemia.
- Received April 10, 2003.
- Accepted after revision December 18, 2003.
- Copyright © American Society of Neuroradiology


